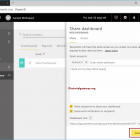
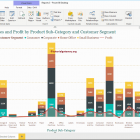
Subscribe to the Power BI dashboard

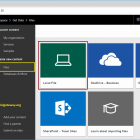
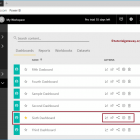
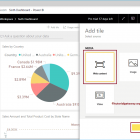
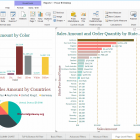
In this section, we show you the step-by-step approach of the Subscribe Power BI dashboard with a practical example. Before starting the subscription process for a panel of ...
R Digital Marketing28/05/2022