Power BI's Top N filters are useful for displaying the best performing records, and the Bottom N filters are useful for displaying the lowest performing records. For example, we can show the 10 best or worst products by orders or sales. Let me show you how to create Power BI top 10 filters and bottom filters with examples.
How to use the top 10 filters in Power BI
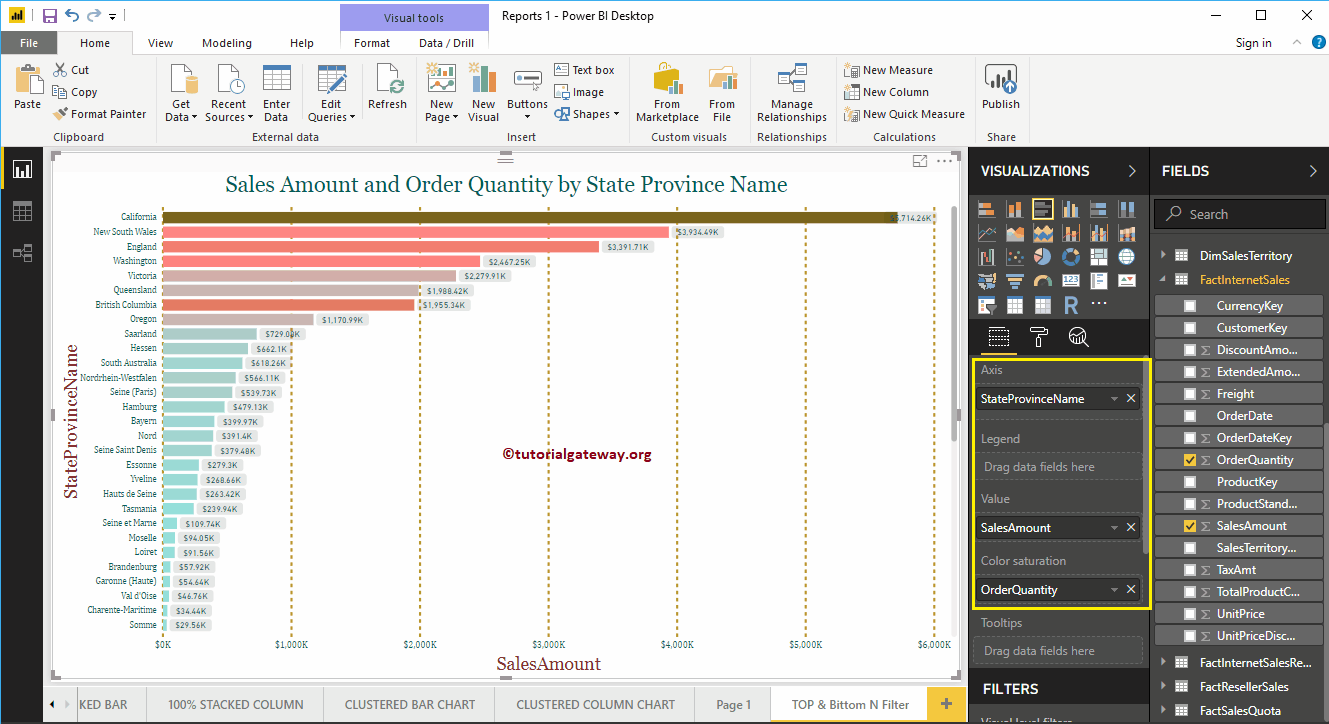
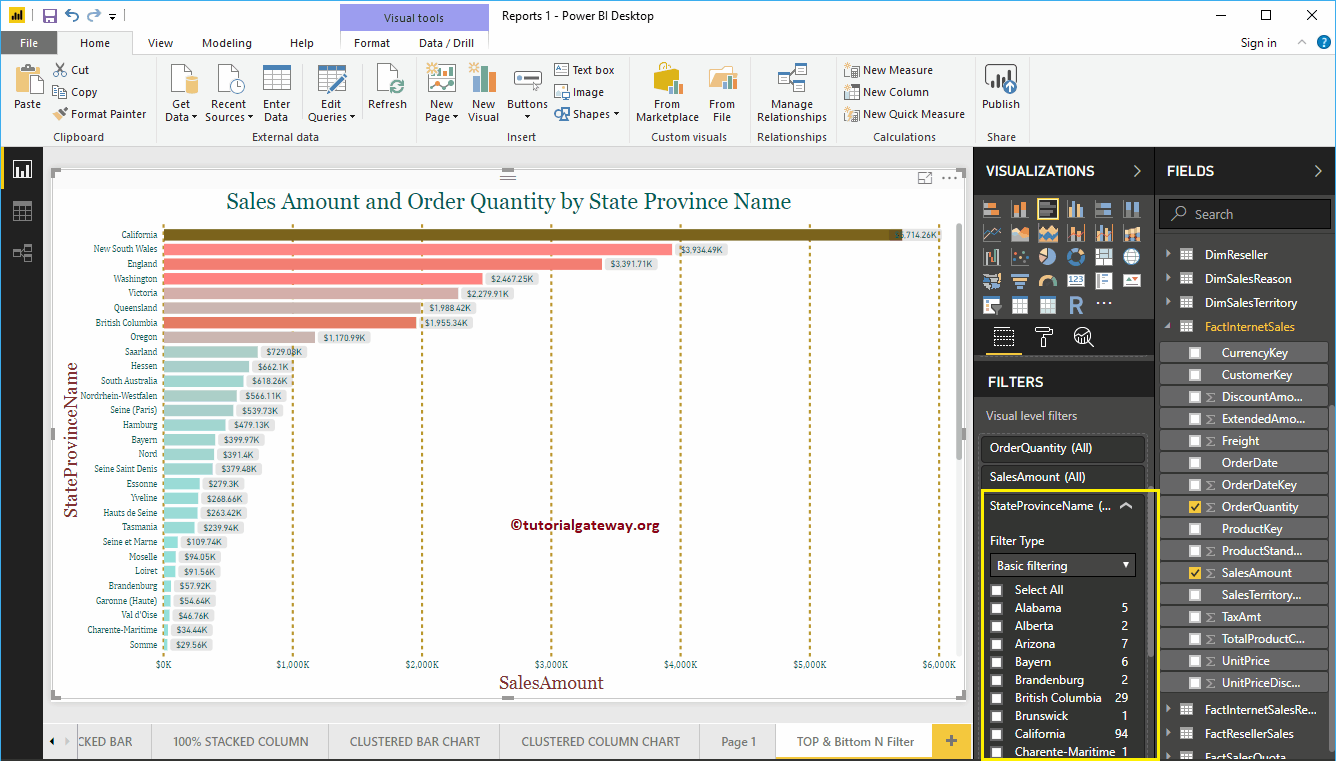
To demonstrate the top N filters in Power BI, we'll use the bar chart we created in our previous post. As you can see in the Power BI screenshot below, we use the state province name as the Axis field, the sales quantity as the Value field, and the order quantity as the color saturation.
In the Filters section, you can see the list of filters that are available in Power BI
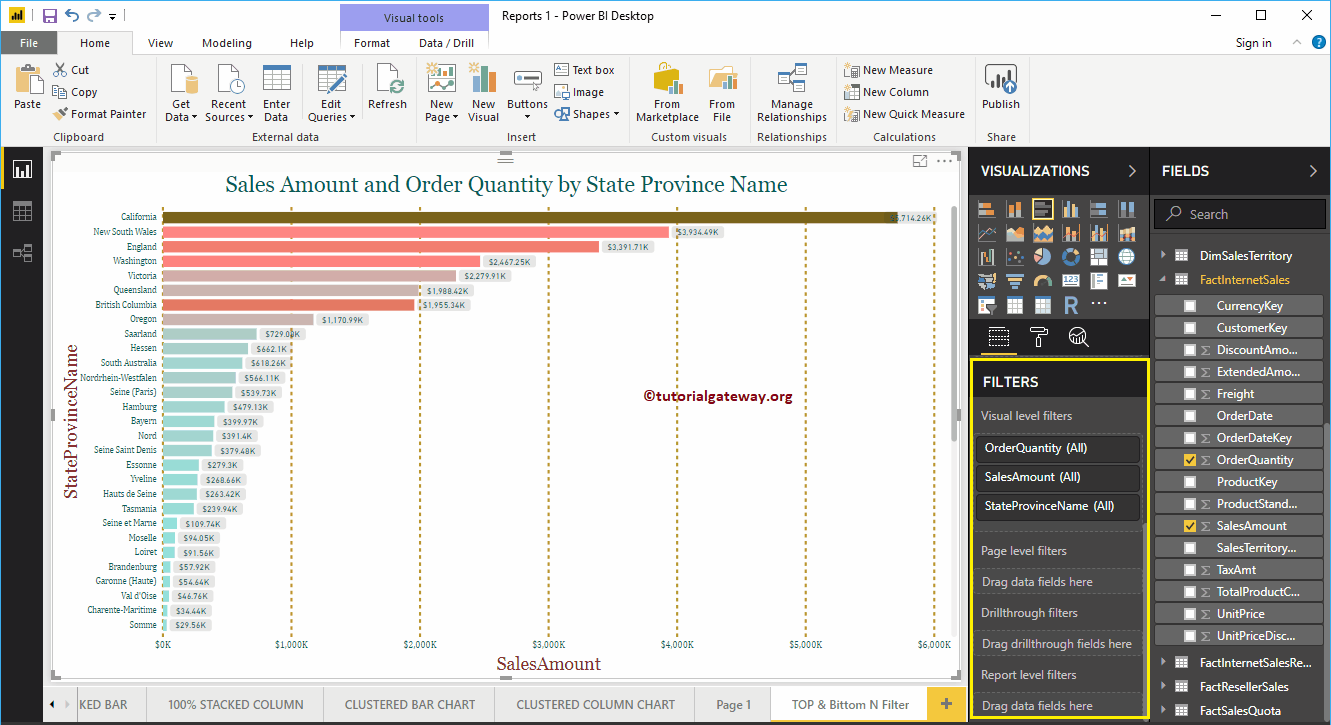
Let me expand the state province name (in short state) to see the filter types. By default, the Basic Filters option selected as the Filter Type.
Top 10 Power BI filters
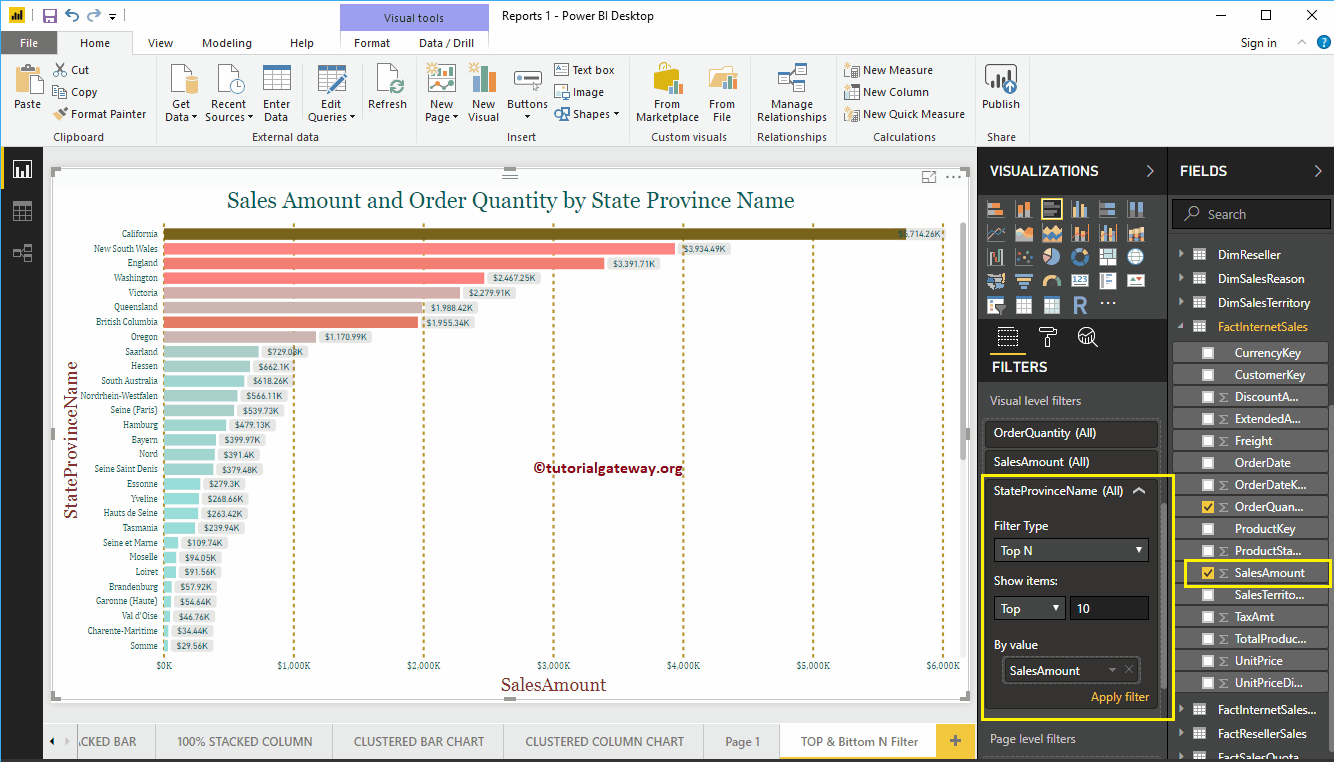
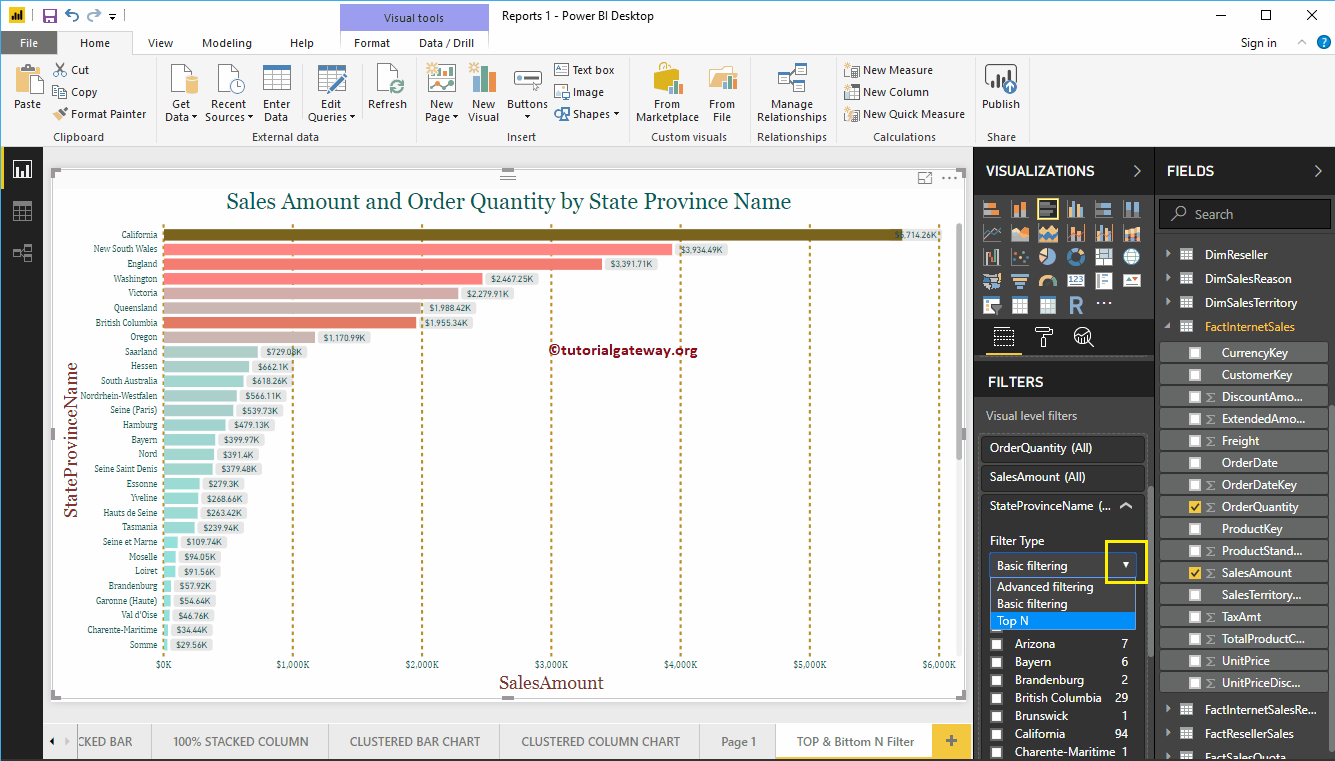
To enable Power BI's top 10 filters, use the drop-down menu to change it to Top N filters
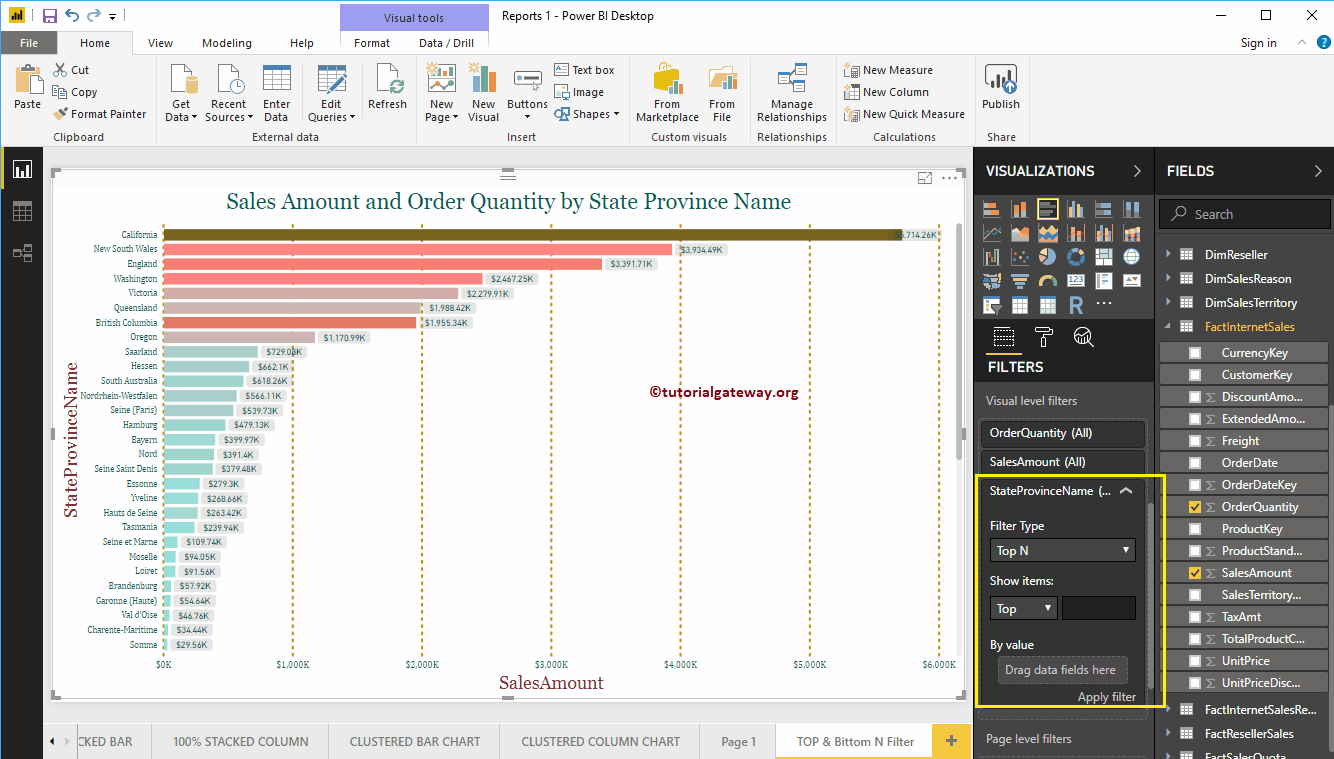
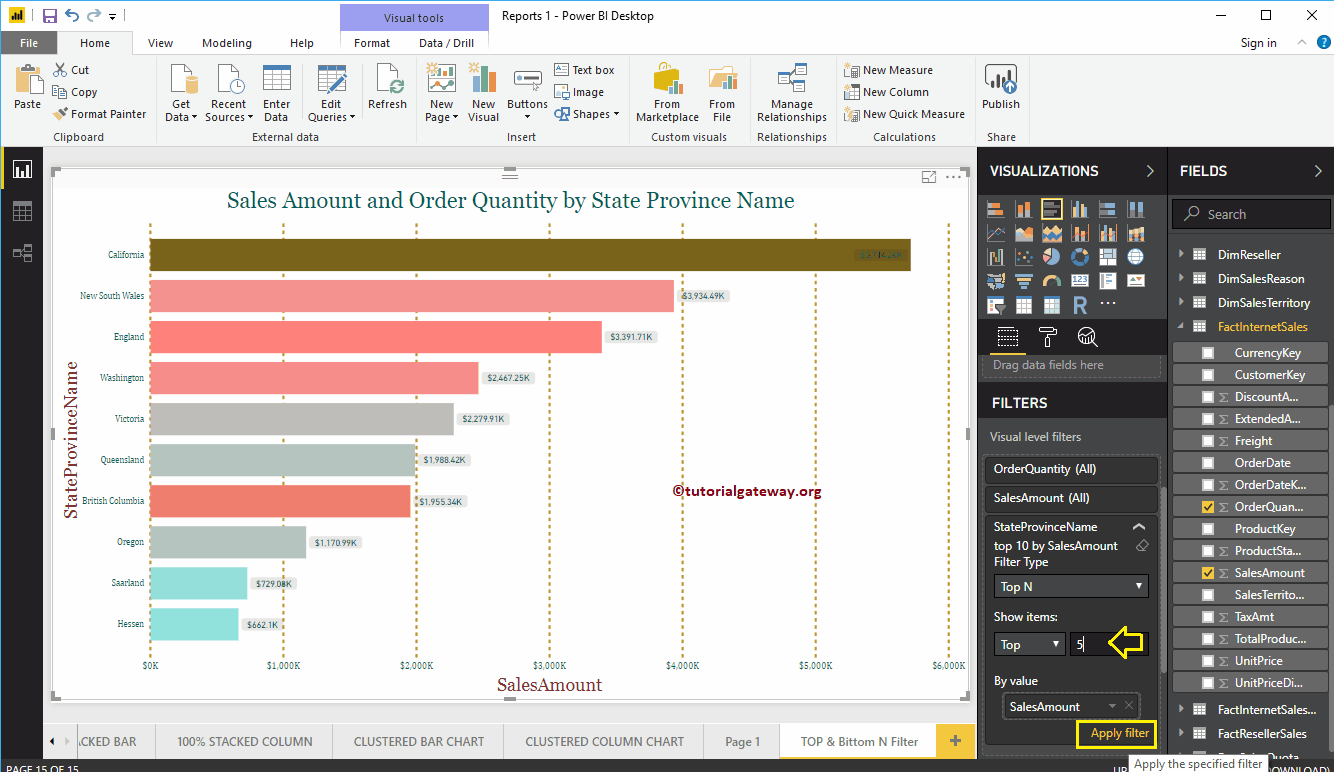
Below is the list of options that are available for Power BI TOP 10 filters
- Show Items: Top filter selected by default. However, you can change this to Lower by clicking the down arrow.
- Empty text box: Specify any integer value, for example 10 means, 10 main records.
- By value: You have to drag and drop the required Measure value present in the Fields. The Top N filter uses this measure to find the Top 10 and Bottom 10 records.
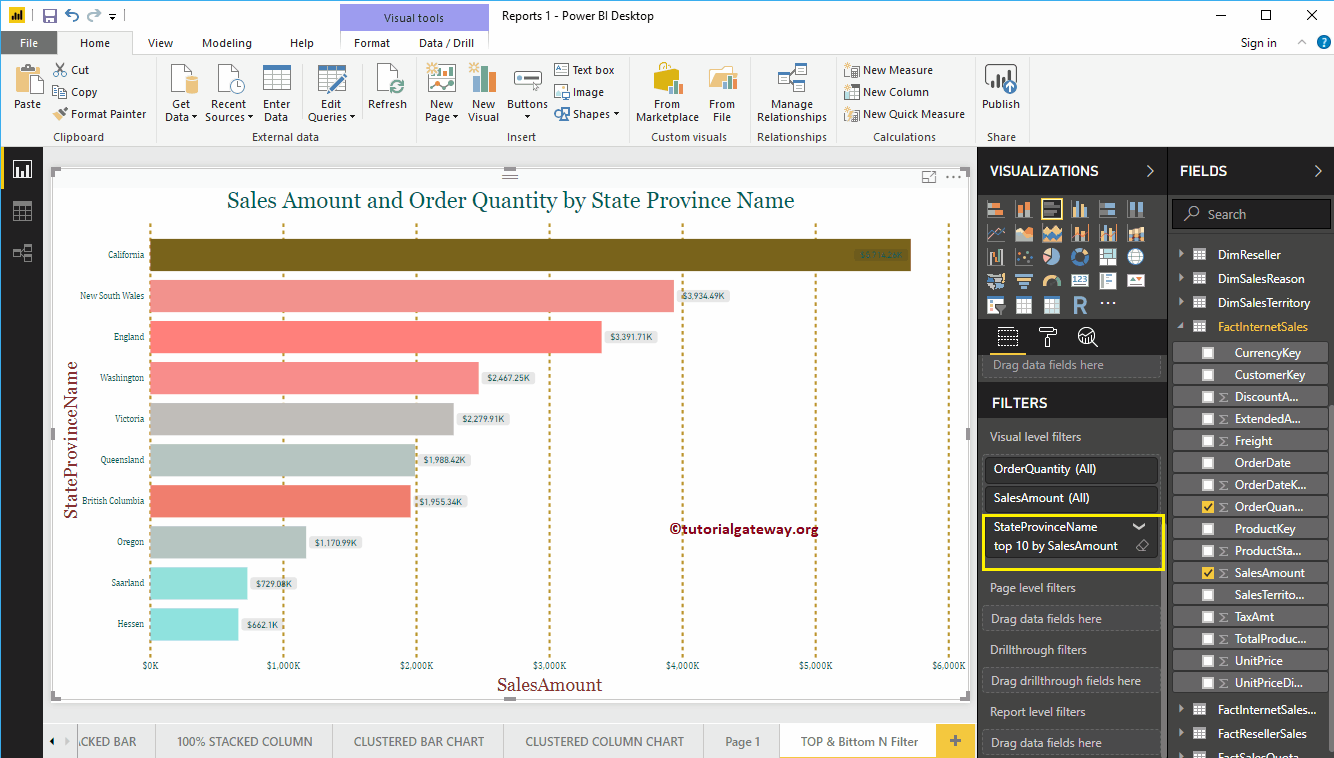
Let me add Sales Amount to the By Value section and 10 to the textbox

The following Power BI report shows the top 10 statuses based on their sales amount. Or we can say, the top ten states according to the amount of their sales.

Use drop down arrow to minimize filter

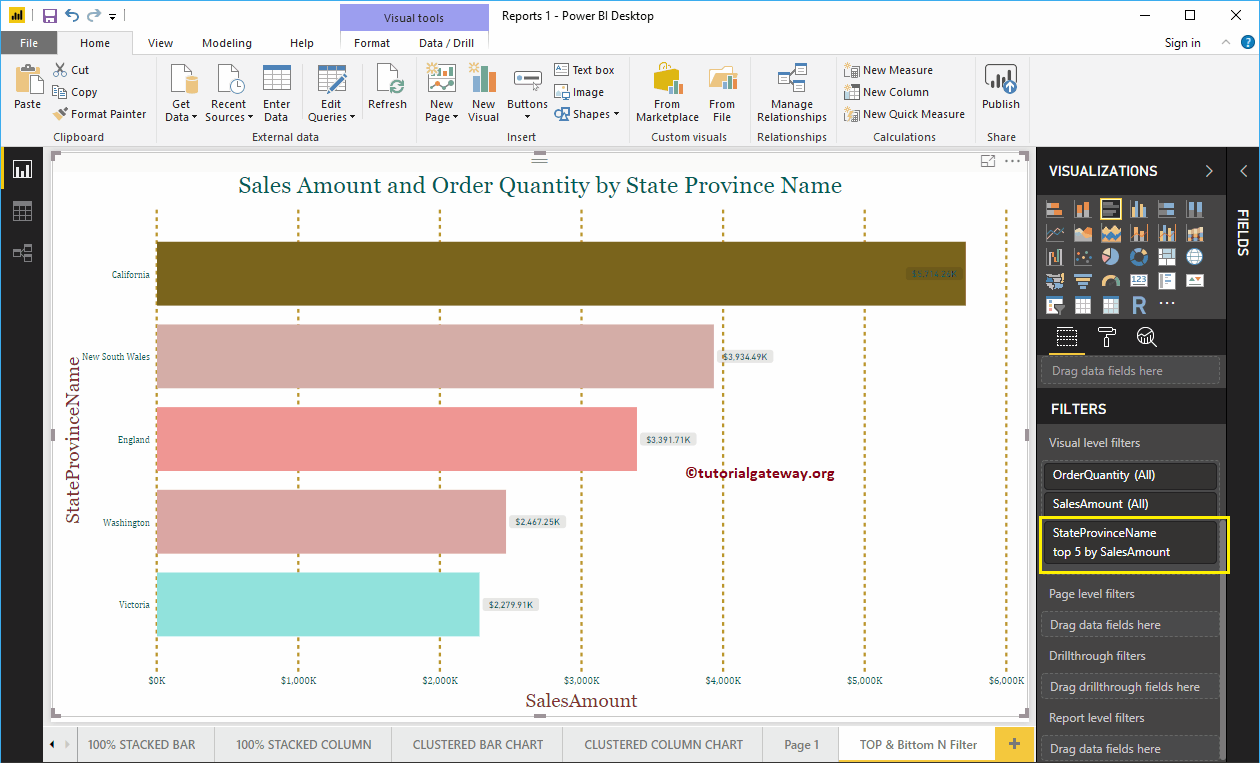
Let me change the value to 5. Ie Power BI Top 5 filter

As you can see, the Power BI filter has selected the top 5 state province names by sales amount

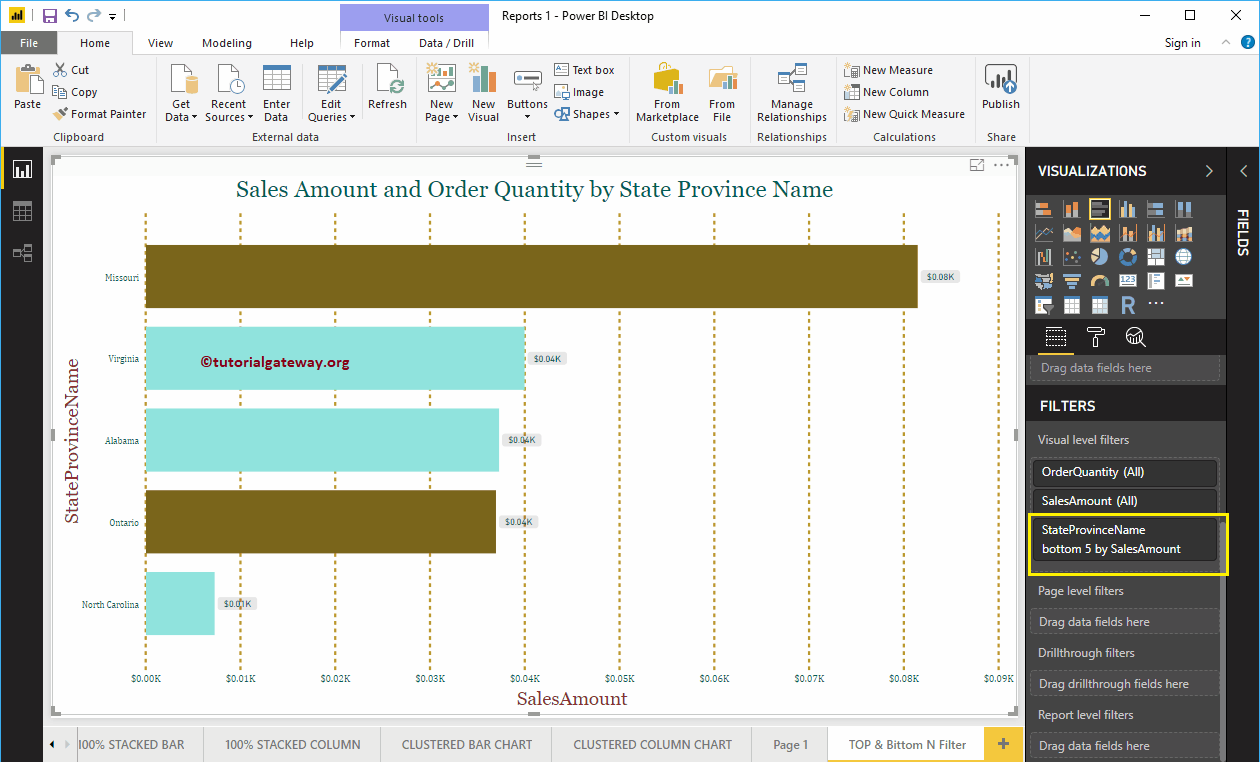
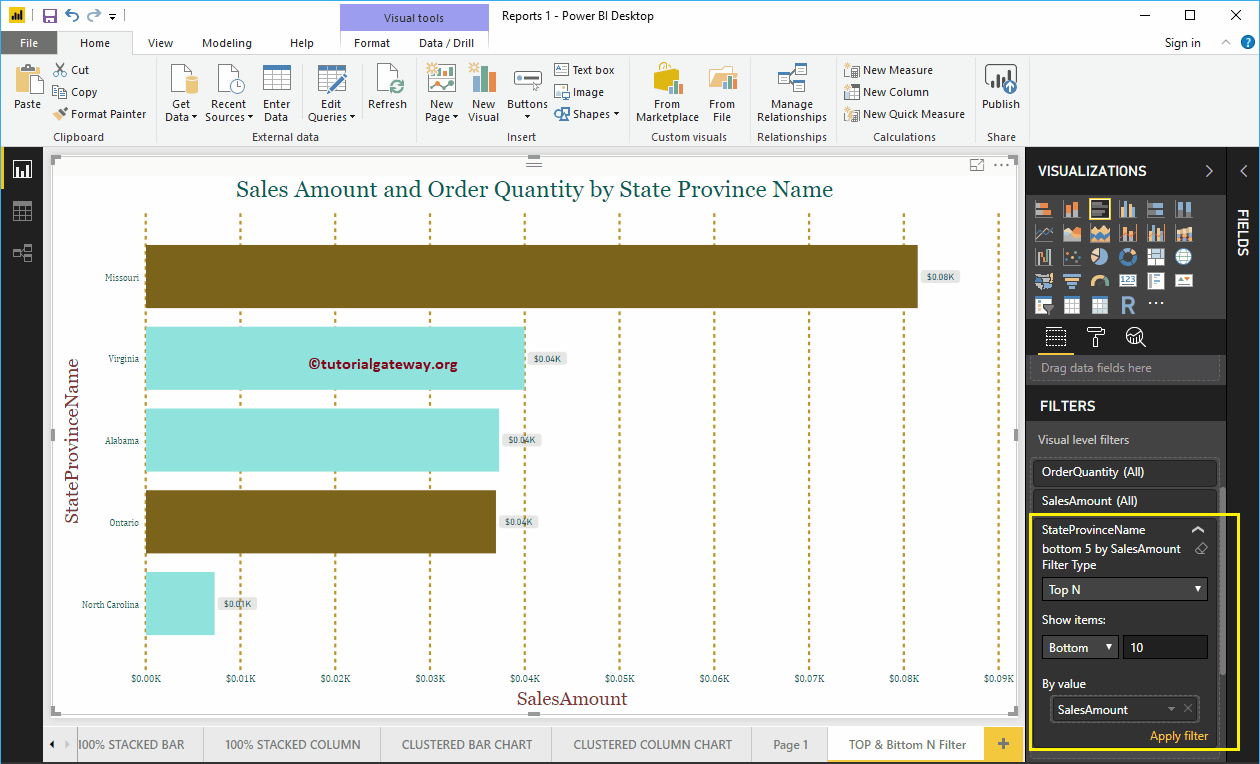
Power BI Bottom Ten Filters
To apply the bottom 10 filters in Power BI, let me change the Show Items option from top to bottom and leave the integer value at 5
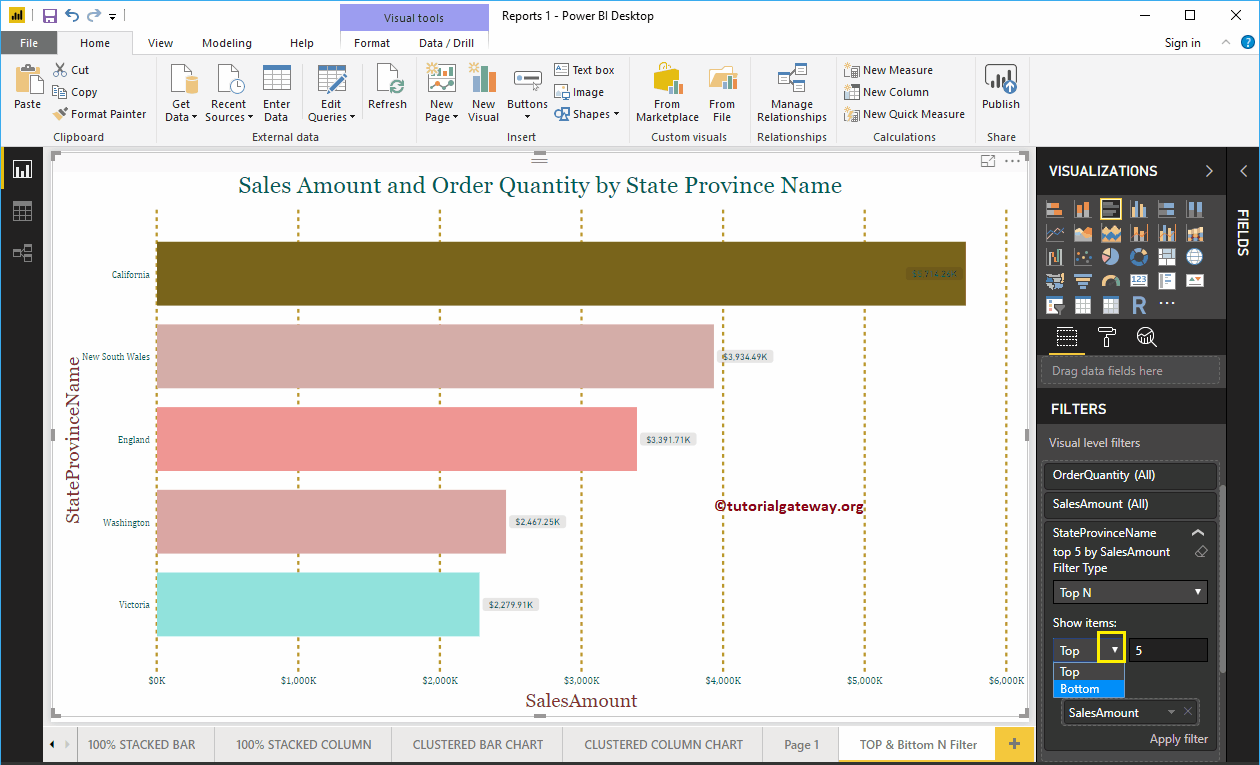

Click on the Apply filter button

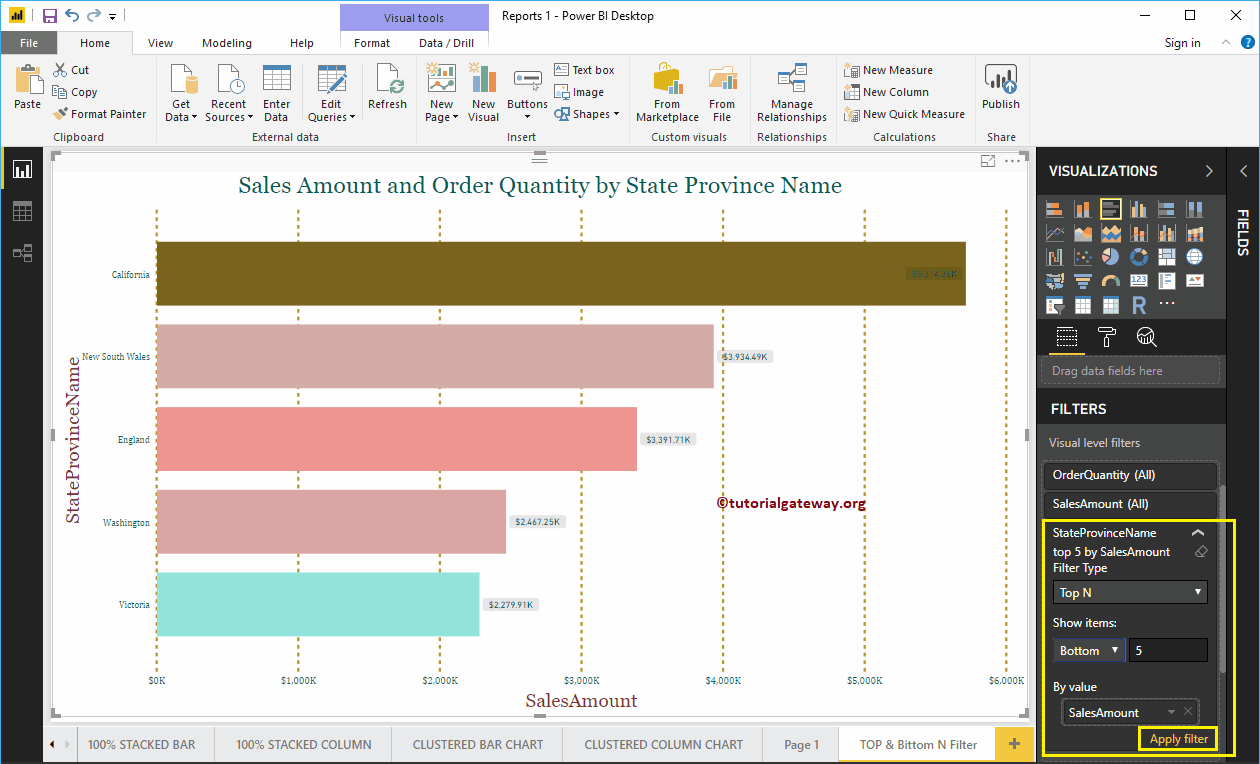
The following Power BI report shows the bottom 5 statuses based on their Sales Amount. Or we can say, lower performance states.

Let me change the integer value to 10

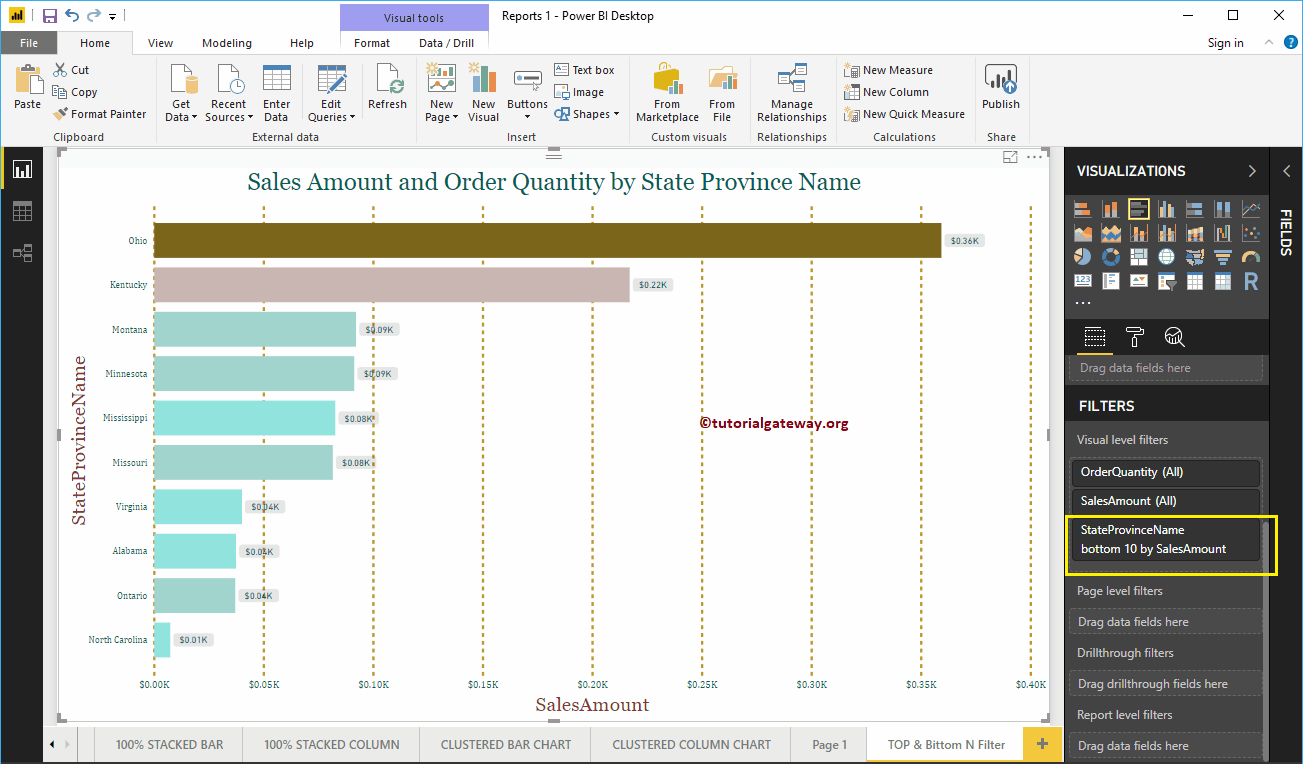
The following report shows the bottom 10 Power BI statuses based on their Sales Amount.