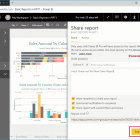
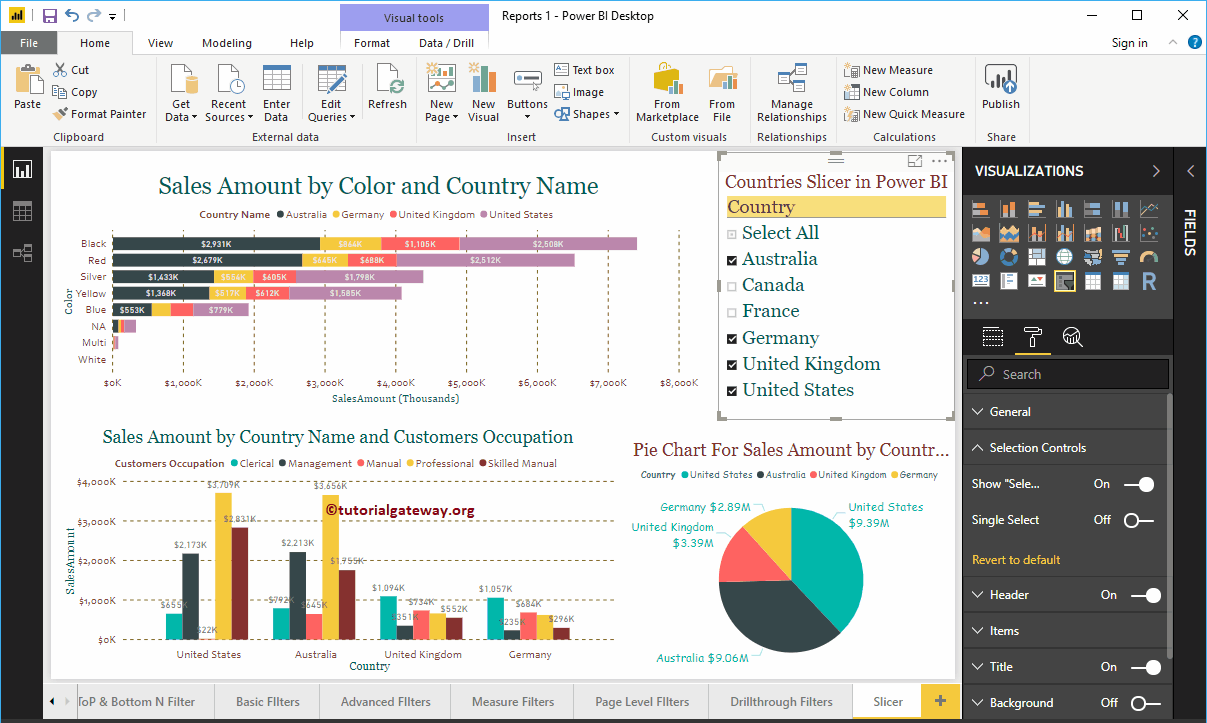
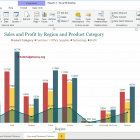
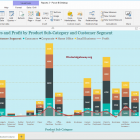
How to share the Power BI dashboard

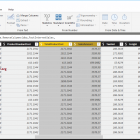
Let me show you the step-by-step approach to sharing the Power BI dashboard across your organization with a practical example. Before you start sharing your dashboard ...
R Digital Marketing04/06/2022