Share your Power BI workspace

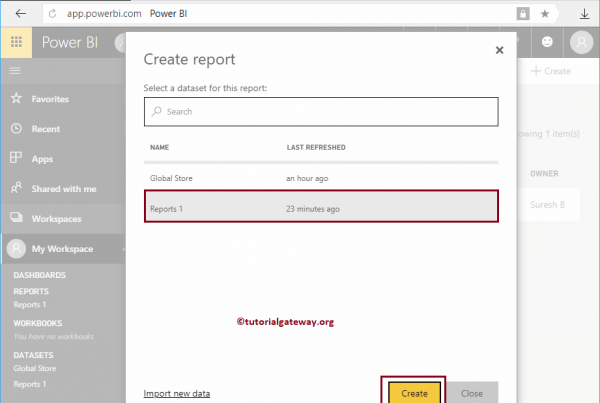
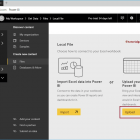
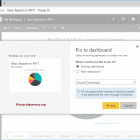
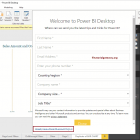
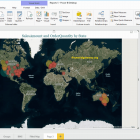
Let's take a step-by-step approach to sharing the Power BI workspace across your organization with a practical example. Before starting to share the area ...
R Digital Marketing25/05/2022