El gráfico de funnel de Power BI es muy útil para mostrar los datos en etapas. Por ejemplo, podemos utilizar este gráfico de embudo de Power BI para visualizar en detalle el costo de un producto en cada etapa.
For this Power BI Funnel Chart demo, we will use the SQL data source that we created in our previous article. So, check out the Connect Power BI to SQL Server article to understand the Power BI data source.
How to create a funnel chart in Power BI
First, click on the funnel chart below the Display section. Automatically create a funnel chart with fictitious data, as shown in the screenshot below.
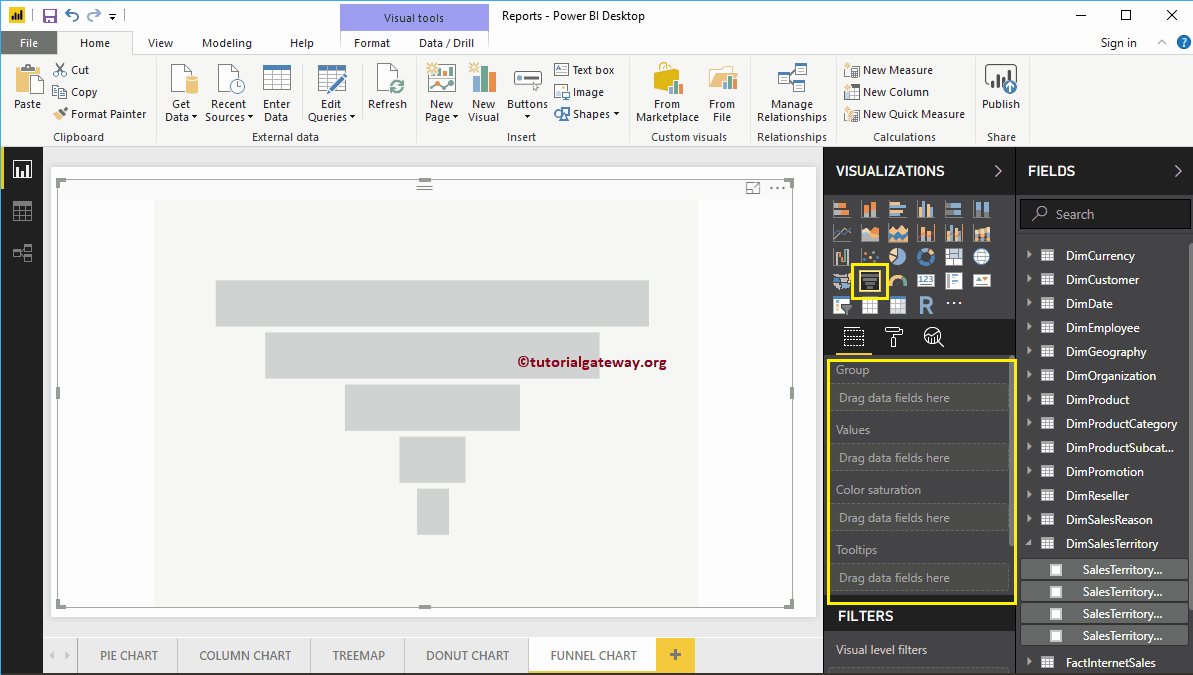 <>
<>To add data to the funnel chart in Power BI, we have to add the required fields:
- Group: Specify the column that shows the stages.
- Values: Any numerical value, such as sales amount, total sales, customer count, etc.
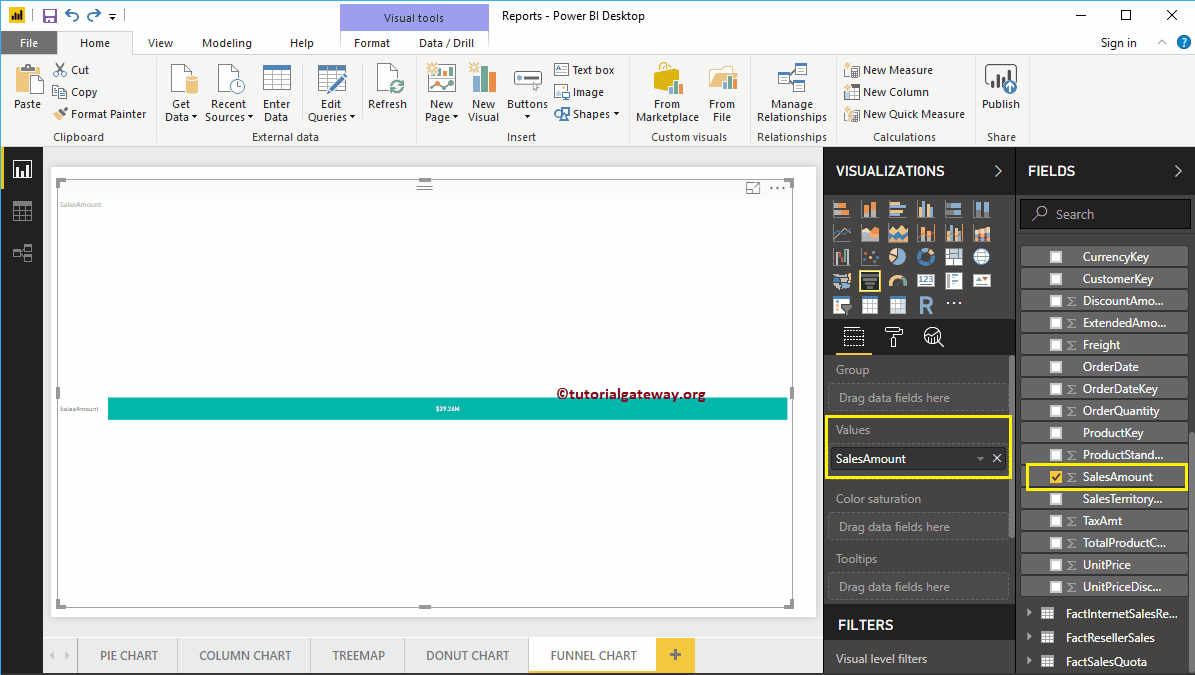
Let me drag and drop the sales amount from the Fields section to the Values field.
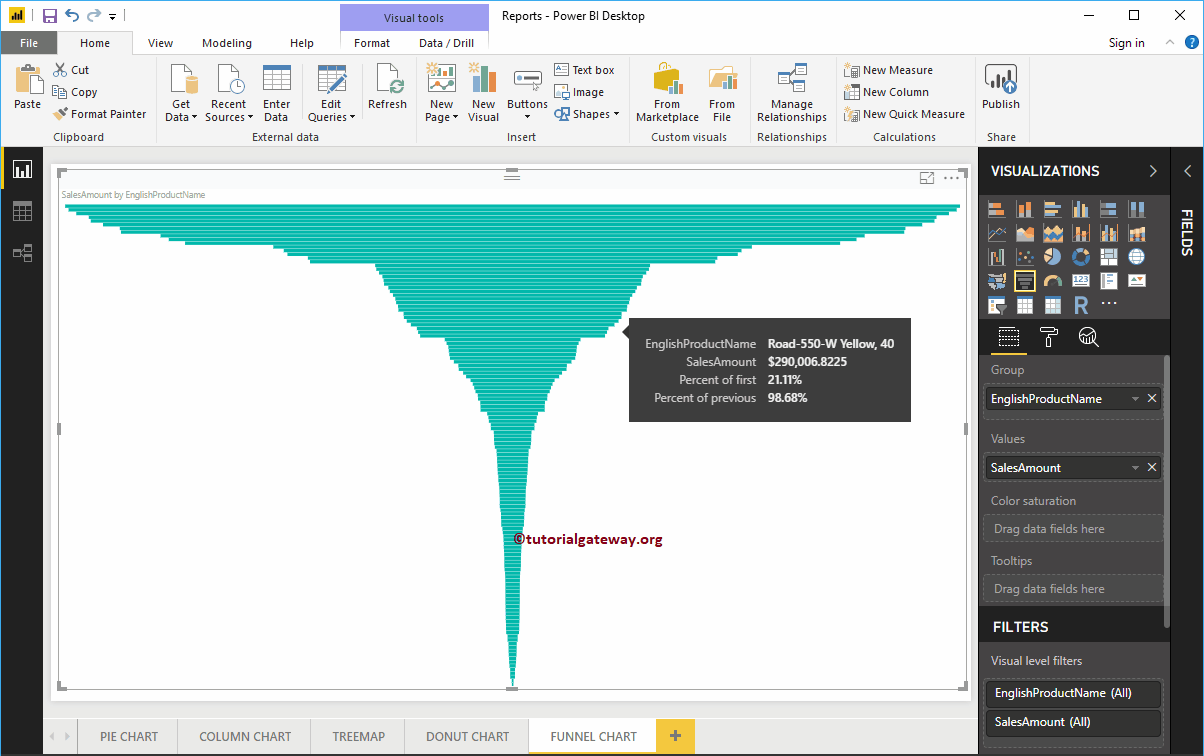
Then add the English product name from the DimProduct table to the group section. You can do this by dragging Product Name to the Group section, or just check the Product Name column
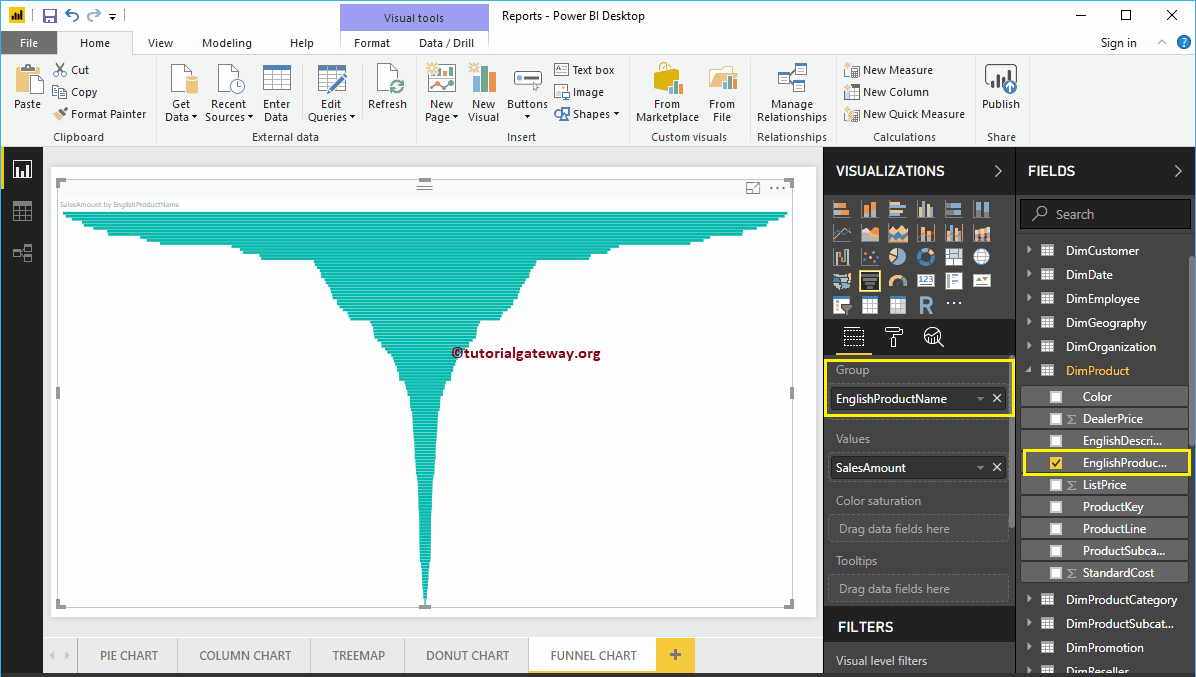
Now you can see the funnel chart for the sales amount for each product. Hover over any box to see the tooltip for the product name and its sales amount.

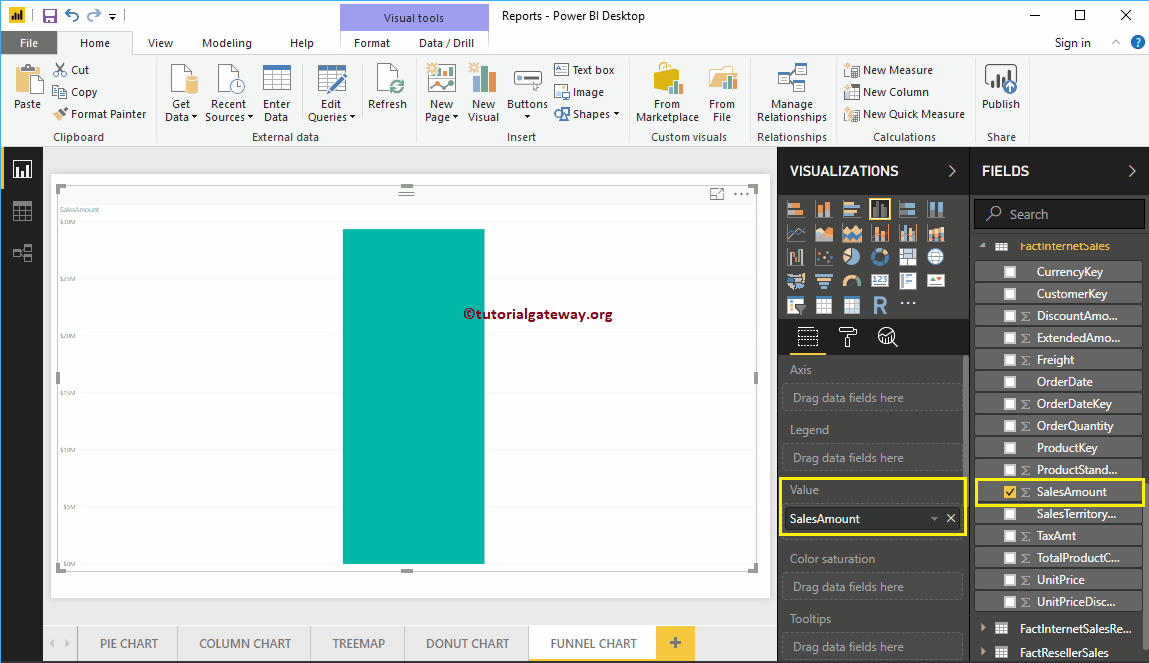
Create a funnel chart in Power BI approach 2
First, drag and drop the sales amount from the Fields section onto the canvas. Automatically create a column chart, as shown in the screenshot below.
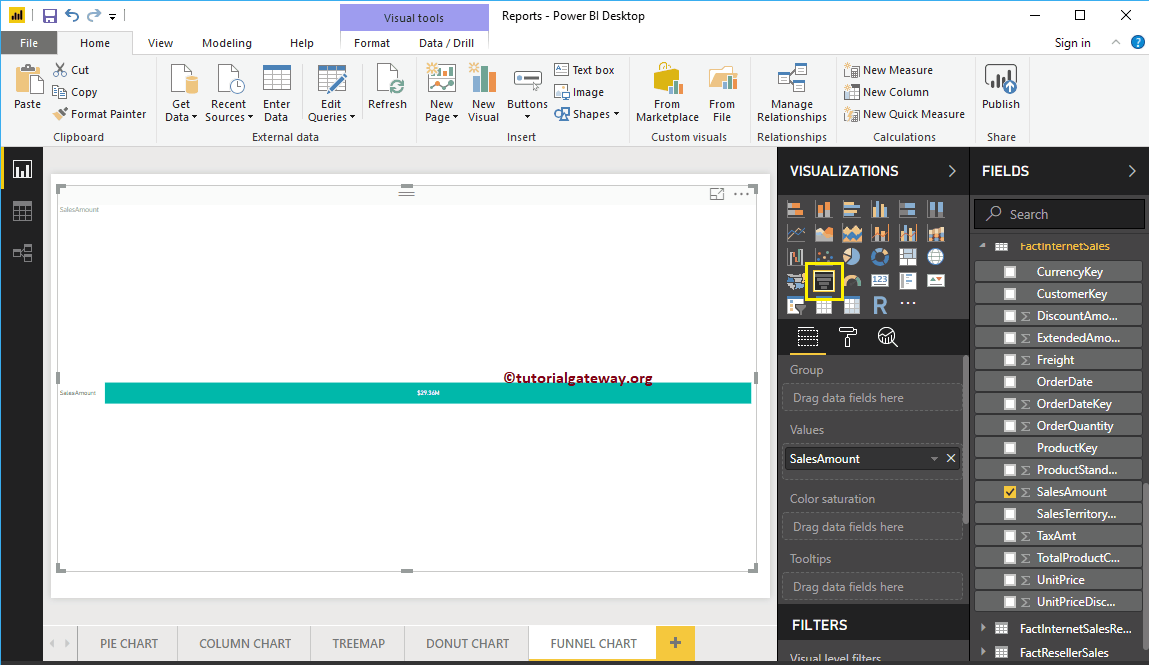
By clicking on the funnel chart below the Display section automatically converts column chart to funnel chart
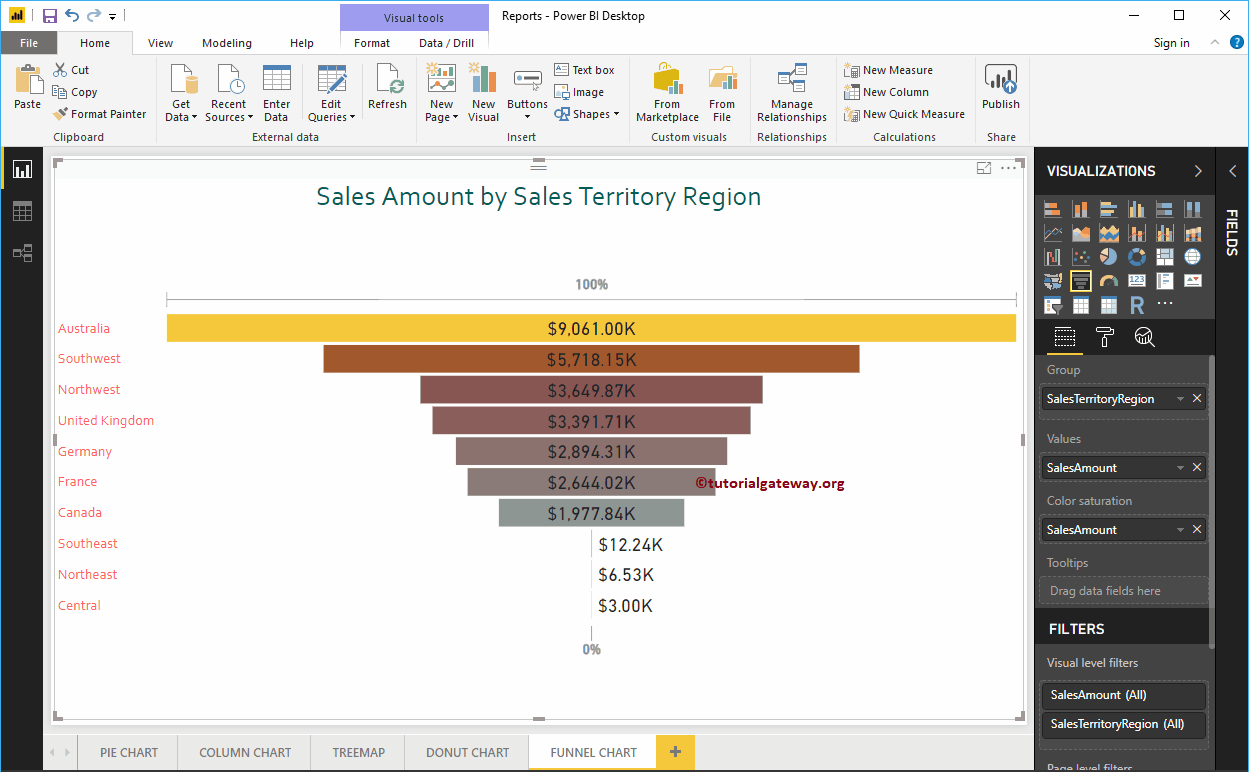
Next, let me add the DimSalesTerritory sales territory region to the group section. It means that each box represents a region
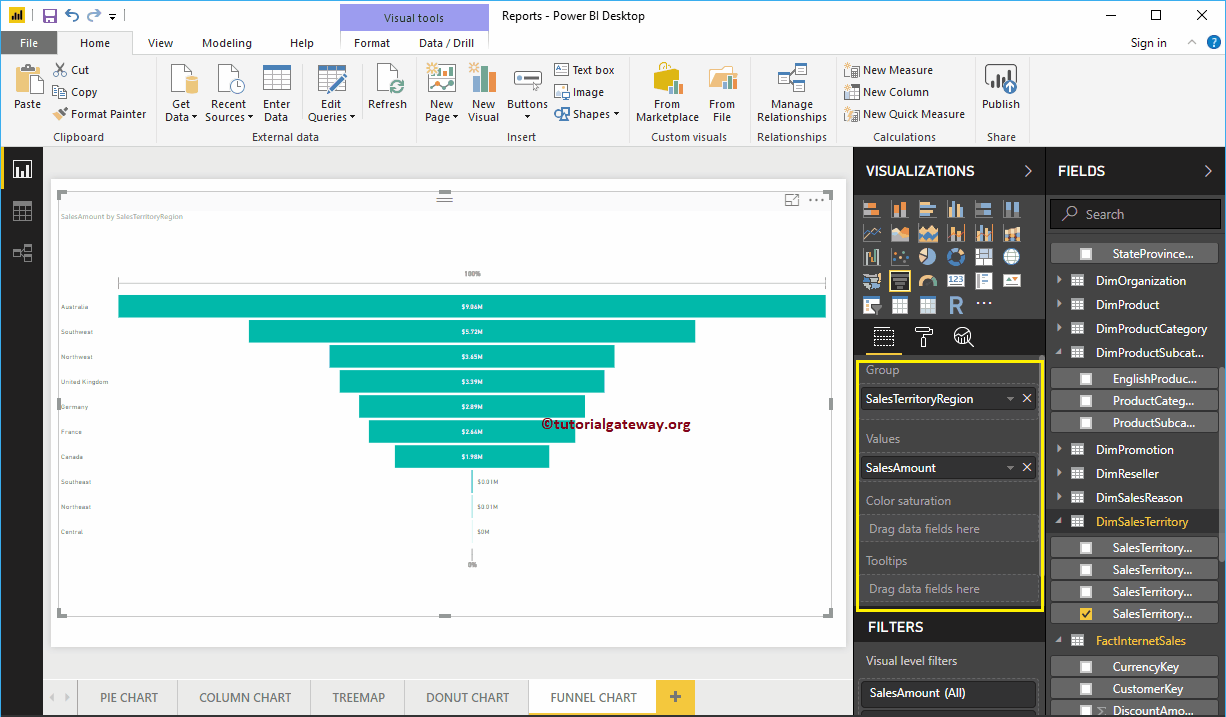
Let me apply a quick format to the funnel chart
NOTE: I suggest that you refer to the article Formatting Funnel Chart to understand the steps required to format the title font, title alignment, box colors, data labels, and colors.