In this article, we show you the step-by-step approach to pin your report to the Power BI dashboard with a practical example. Before you start pinning your reports to the Power BI dashboard, let me show you the page I'm using in this example.
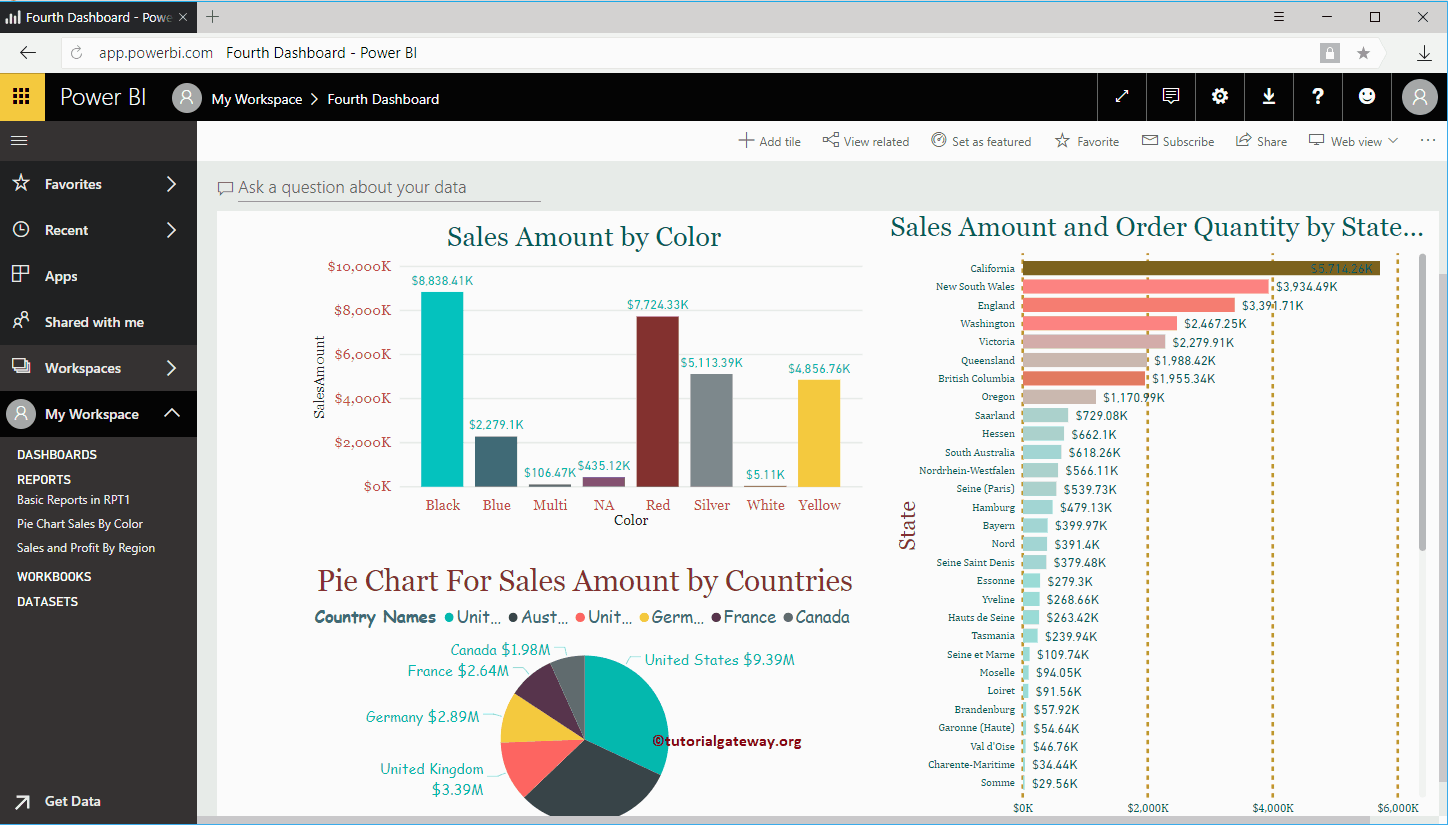
As you can see in the screenshot below, this is the report we published from Desktop. To demonstrate this Pin Report to Dashboard example, we used the Filters page at the page level.
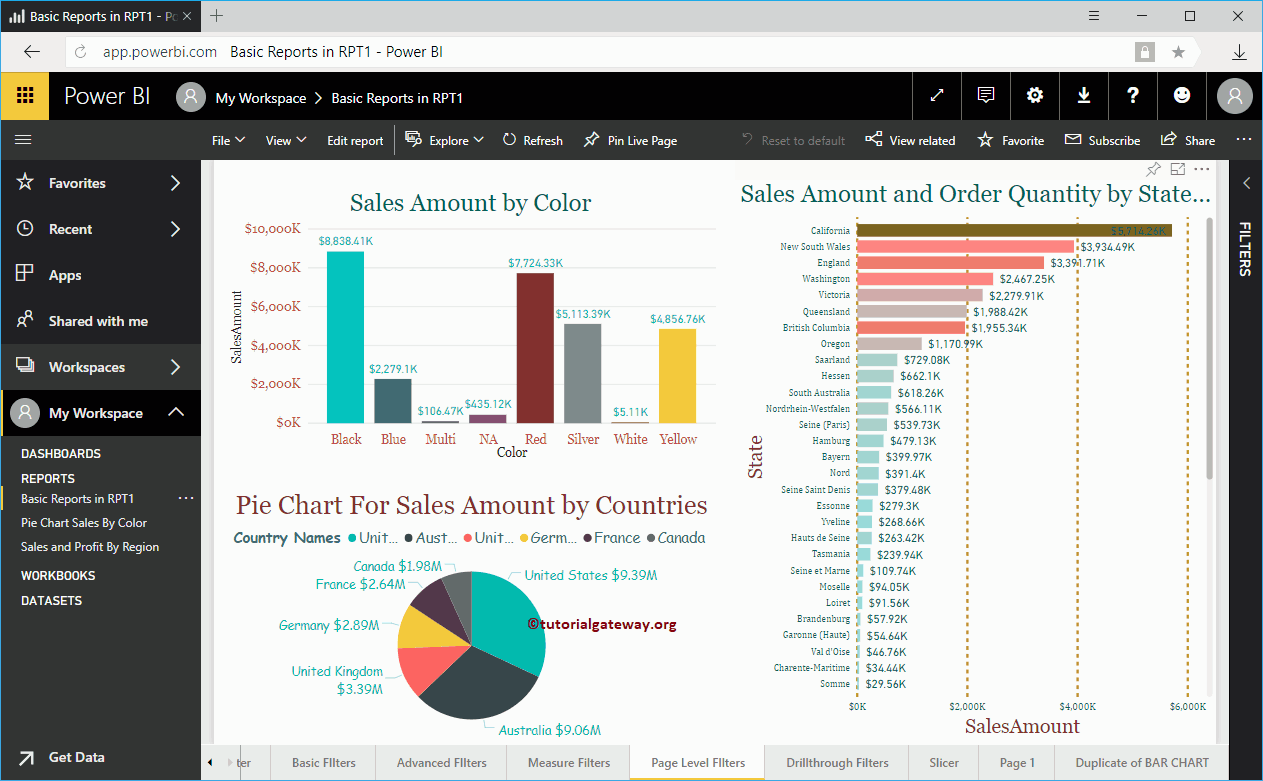
Pin report to Power BI dashboard focus 1
This approach fixes all the images that are available on this page. I mean column chart, pie chart, and bar chart.
To pin the entire page to the Power BI dashboard, click the Set Live Page button that we show in the following screenshot
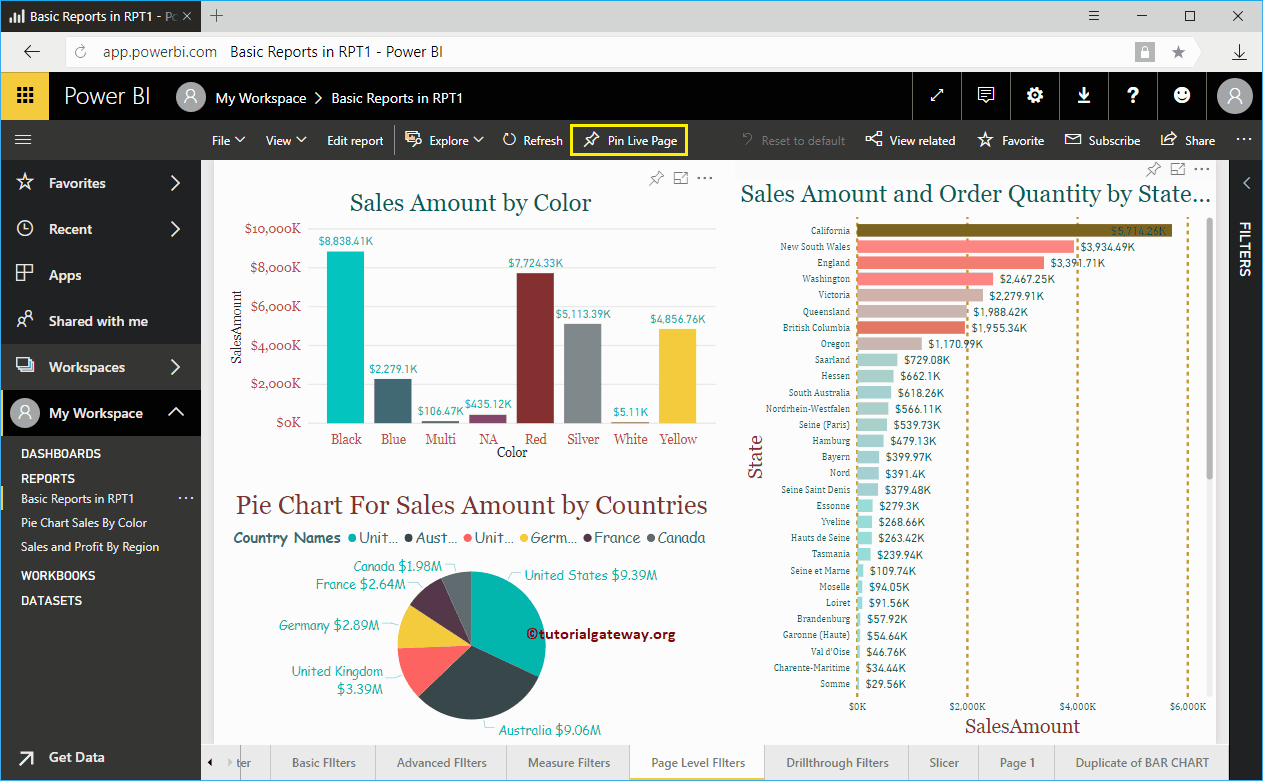
Clicking the Pin Live Page button opens the following window.
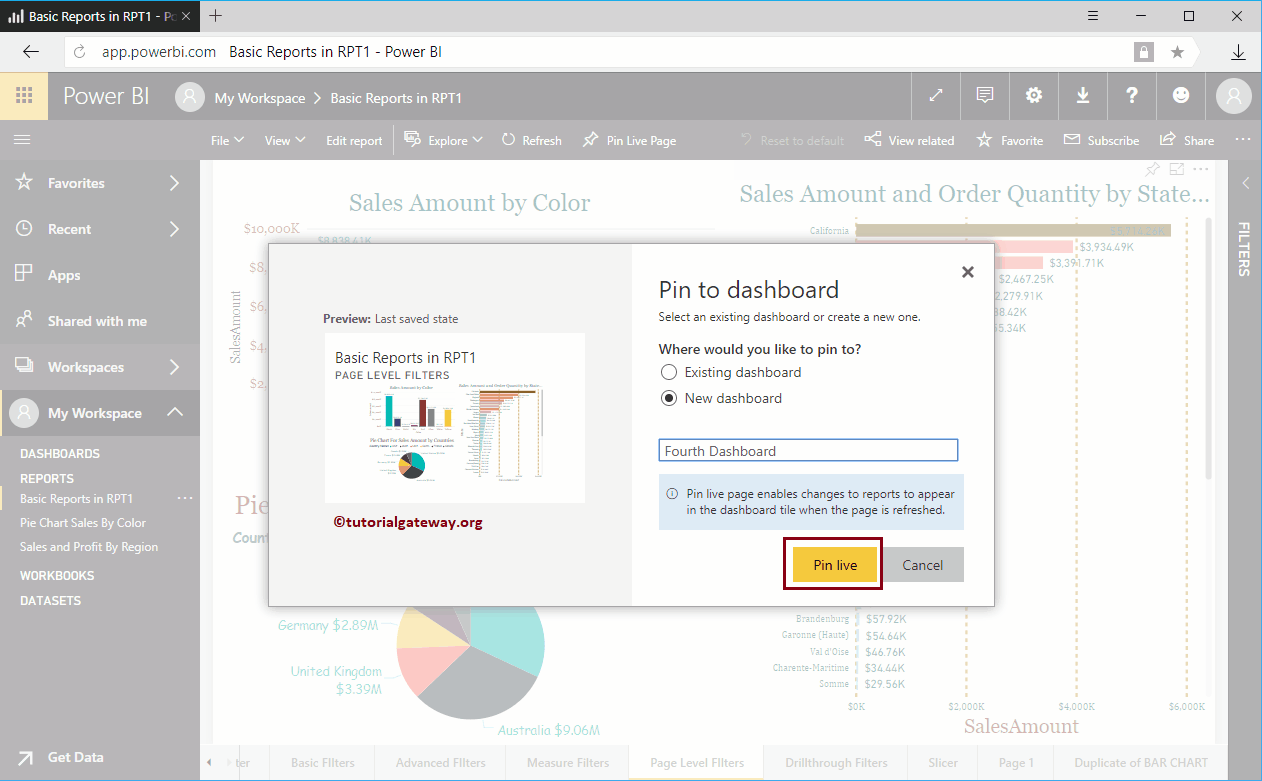
- Existing control panel: Select this option to add this report to an existing dashboard.
- New dashboard: Select this option to create a new dashboard for this report.
Let me select the New Panel option and then we name the panel as Fourth Panel.
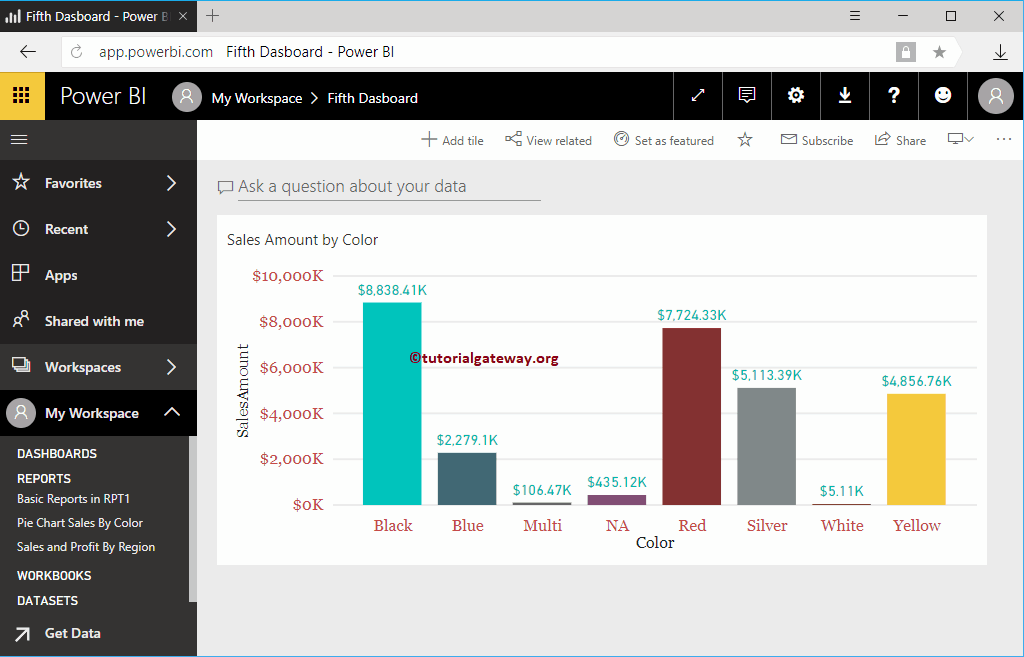
Inside the Fourth panel, you can see the full page within our panel.
Pin report to Power BI dashboard focus 2
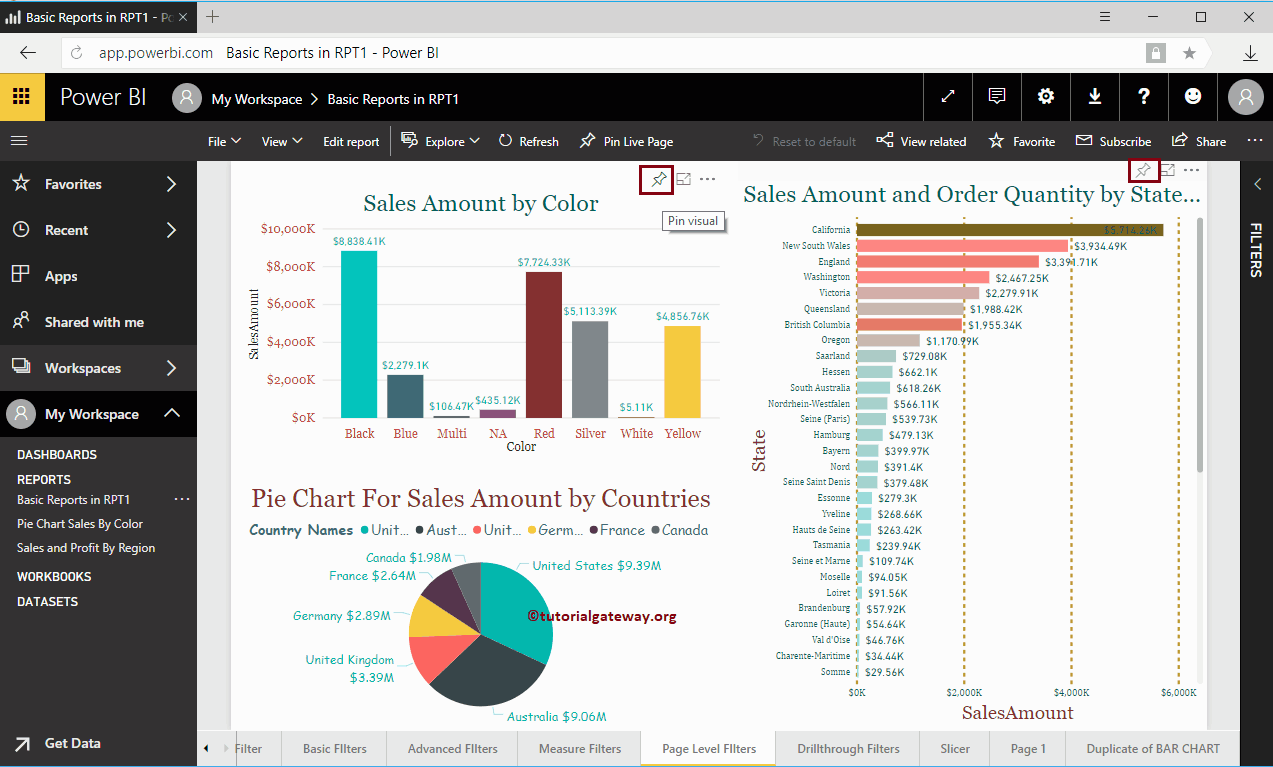
This approach will fix individual images that are available on this page.
To pin any individual graph, hover over that graph that shows you the Visual Pin button we show in the screenshot below.
Click on that button to open the following window. This time we also select New panel and give it a name like Fifth panel.
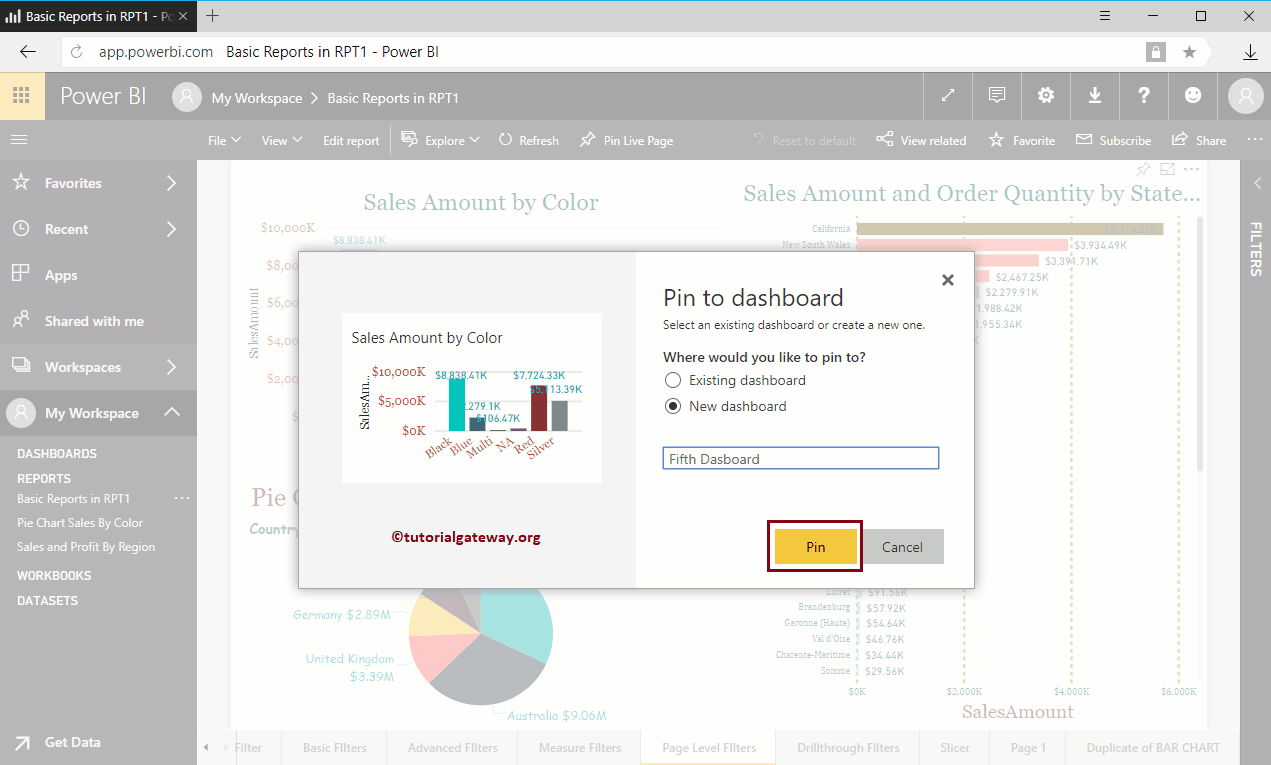
Inside the fifth panel, you can see the column chart that you pinned earlier.