In this session, we show you how to get quick insights into Power BI with a practical example. Generally, there are two types of information in Power BI. One running on the entire dataset and the other is running information about a particular report (quick info). Later one also allows you to dig deeper into the knowledge.
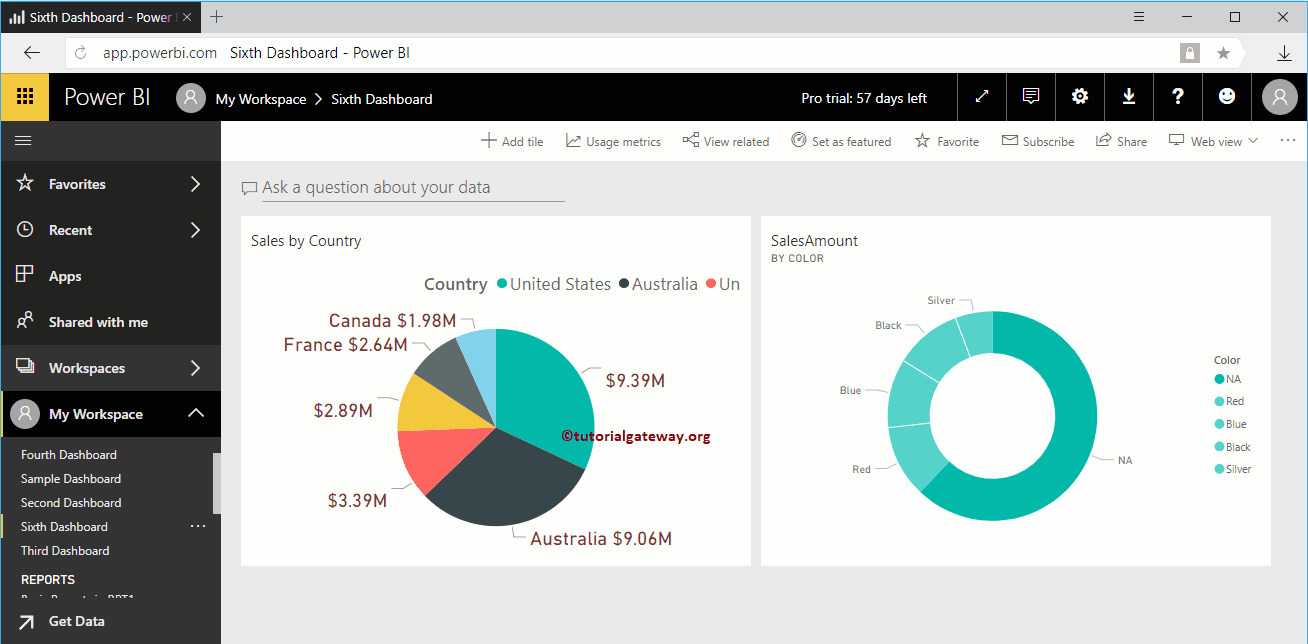
For this Power BI Quick Insights demo, we will use the sixth panel. To see this, click on My Workspace and then go to the Dashboard to select the sixth dashboard.
TIP: I suggest you check out the Get Insights article to understand the process of running Power BI algorithms on your dataset (your first).
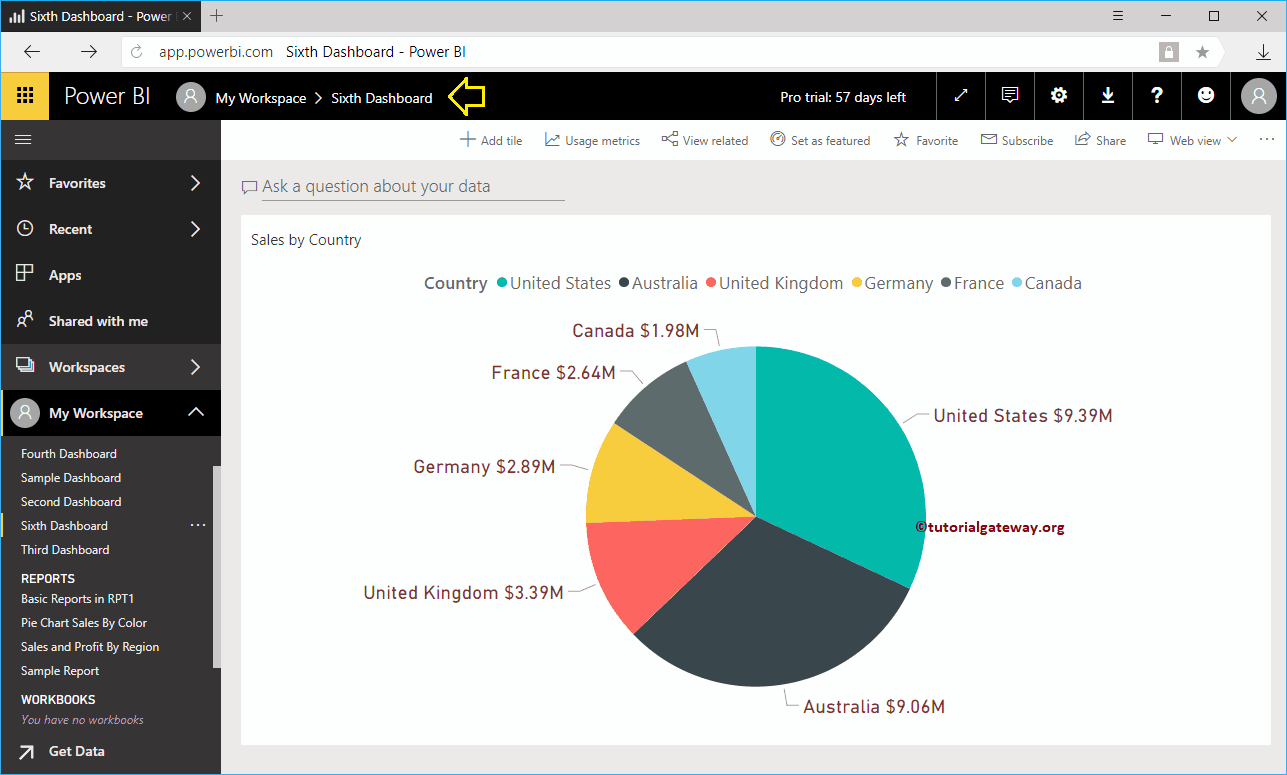
As you can see in the screenshot below, you only have one pie chart.
Quick info in Power BI
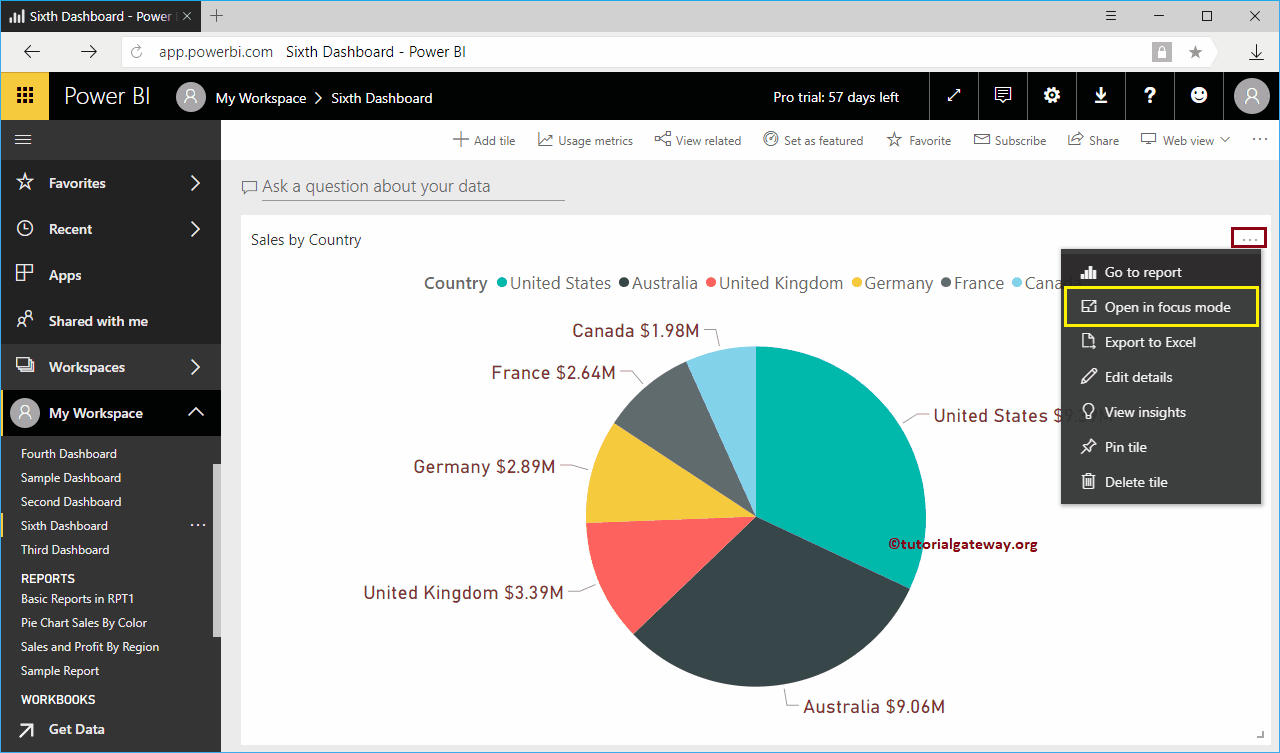
To get the quick Power BI insights from a report, you need to click … in the upper right corner and select Open in focus mode. Remember, in some versions of My Workspace, there is a button next to it… to enter focus mode.
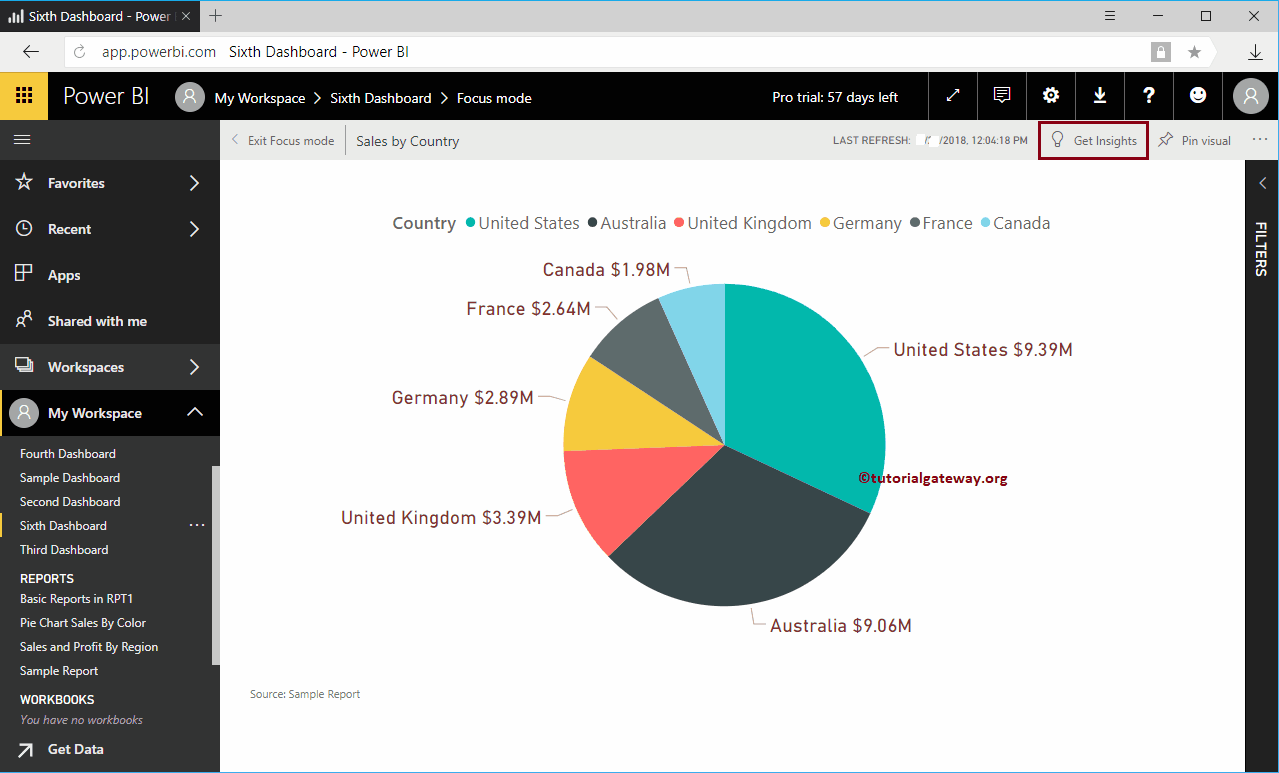
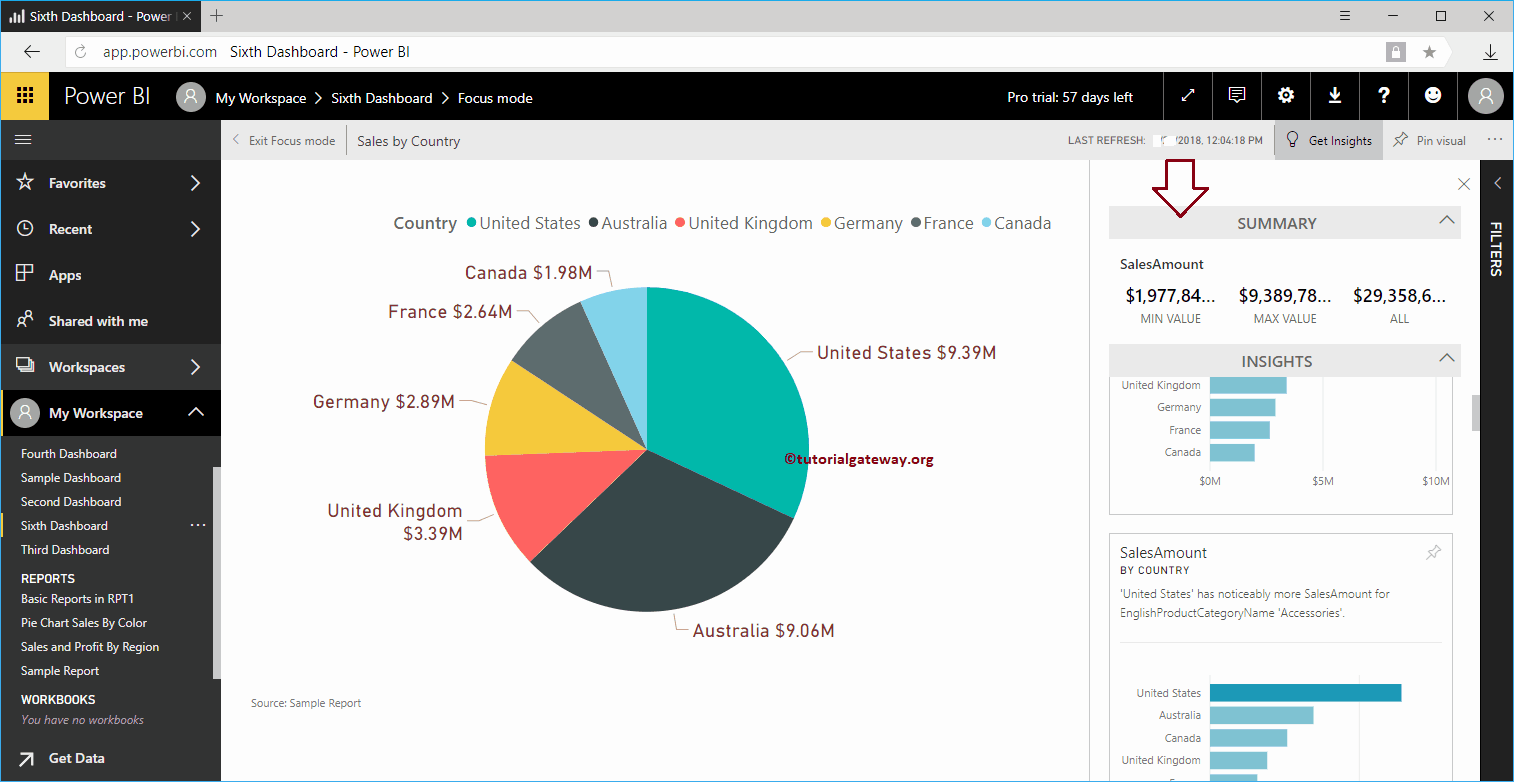
Once your report is in Focus mode, you will be able to view the Get information option in the upper right. Click that button to display the information based on this report.
Now you can see the Power BI quick insights based on this report
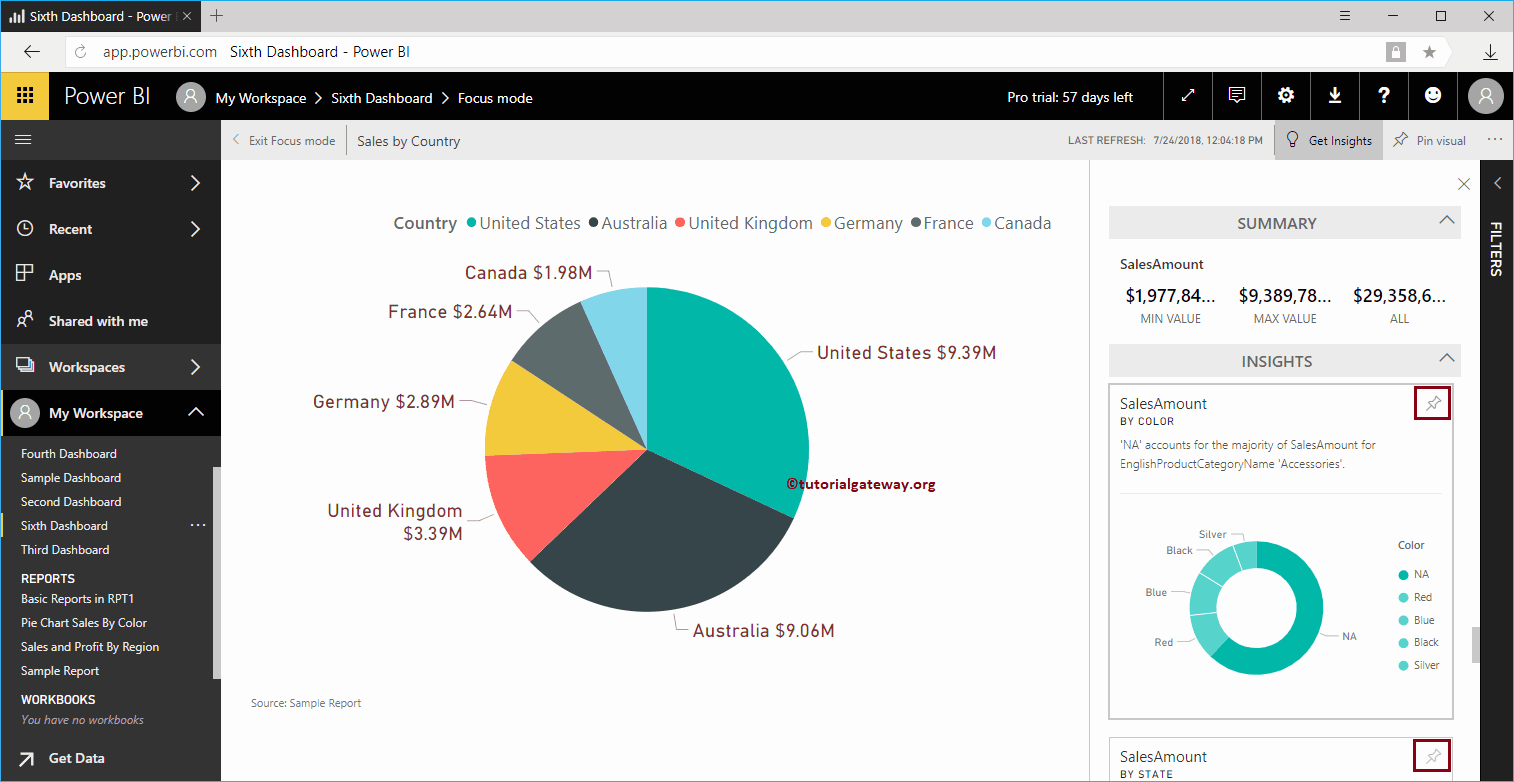
Like any other report, Power BI allows you to pin these visuals to your dashboard. To pin any individual visual, hover over that visual that shows you the Visual Pin button
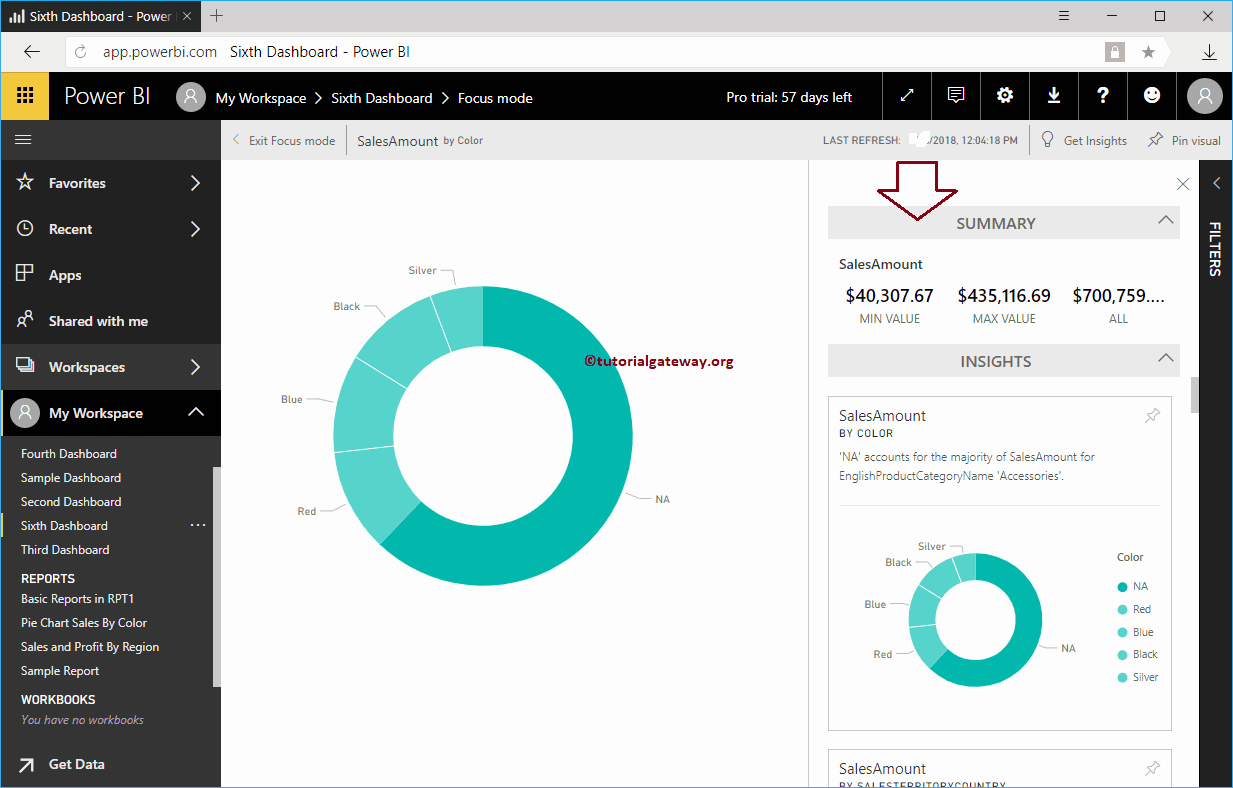
Or, if you want to dig deeper into the report, select any report. For the purpose of quick information demonstration, we selected the donut chart.
Once you've selected, Power BI begins displaying quick information based on this report.
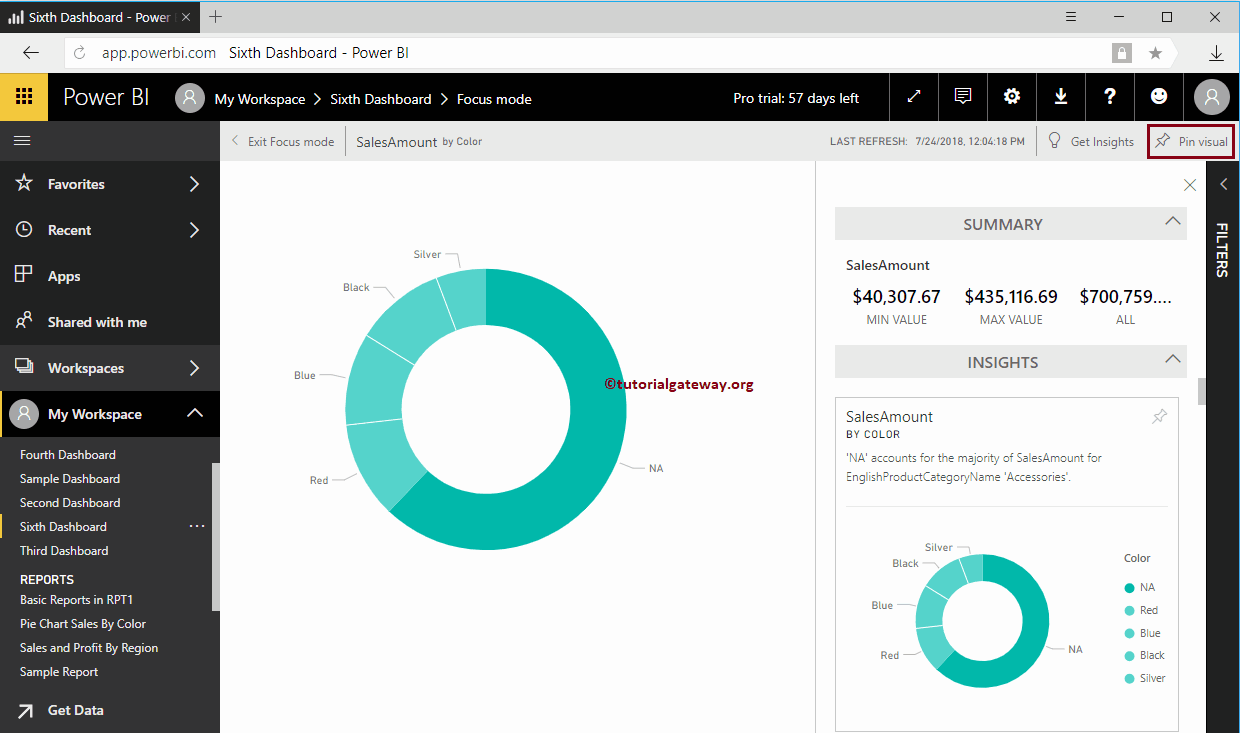
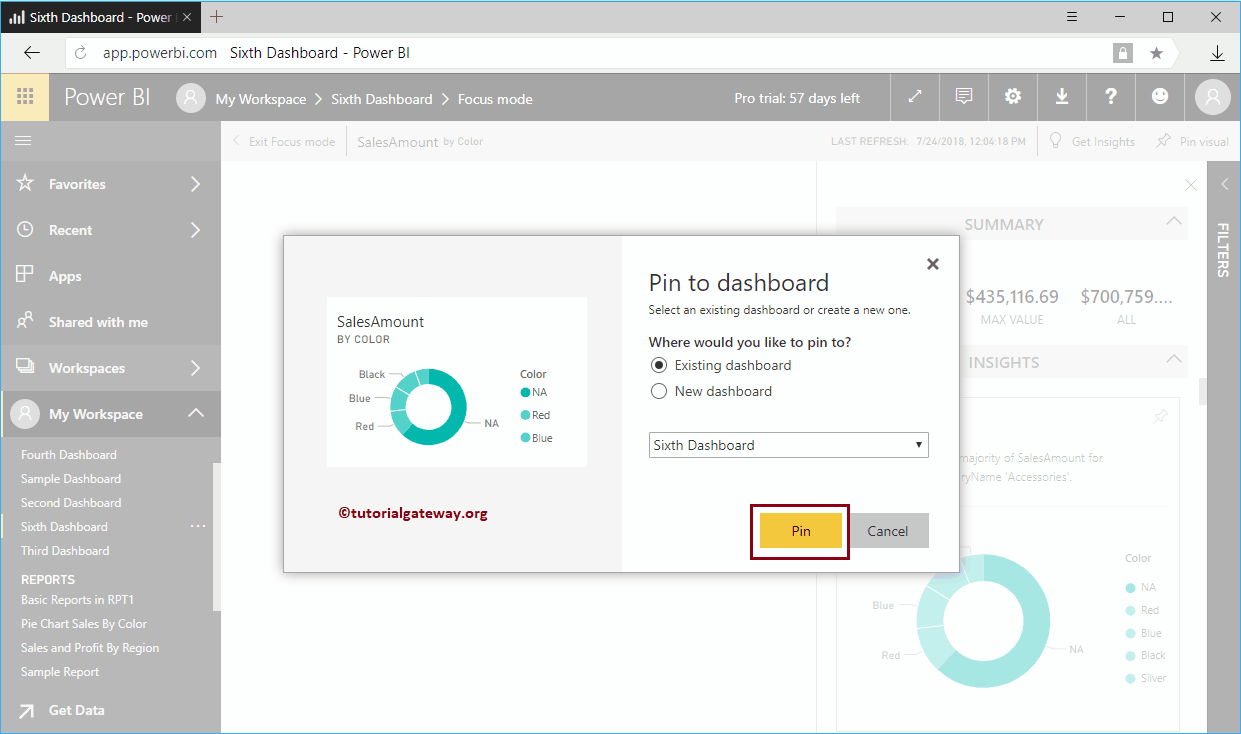
If you want to pin this report to the dashboard, click the Visual Pin in the upper right corner.
Clicking Visual Pin The button opens the following window. Let me select the existing panel, that is, the sixth panel. I suggest you check out Add report to dashboard or Pin report to dashboard articles to understand these settings.
Inside the fifth panel, you can see the donut chart that we set earlier.