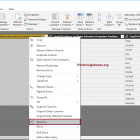
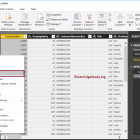
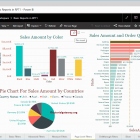
Power BI filters on measures

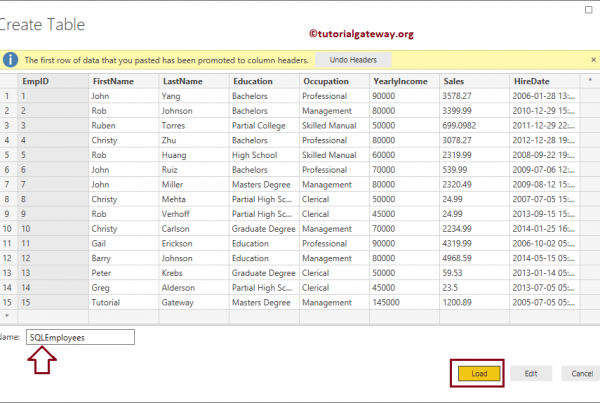
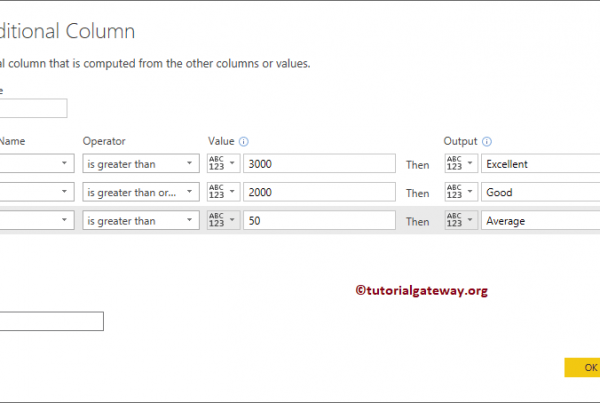
How to create Power BI filters on measures with an example? You use Power BI measure filters to filter measures (metric values). For example, we can ...
R Digital Marketing04/07/2022