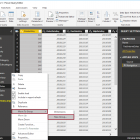
Add reports to the Power BI dashboard

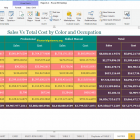
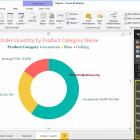
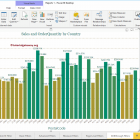
How to add reports to Power BI dashboard with a practical example? Before moving on to the actual example of Adding reports to the Power BI dashboard, let me show you the dashboards ...
R Digital Marketing30/07/2022