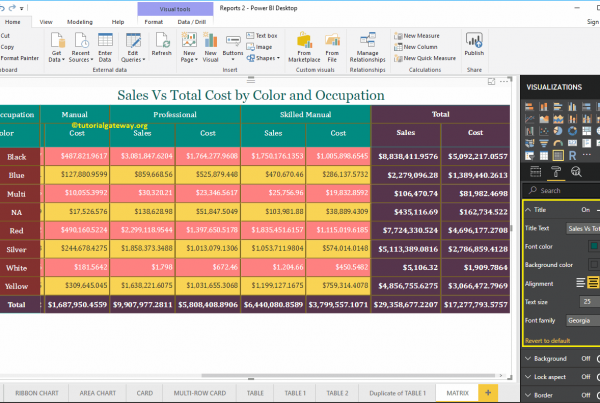
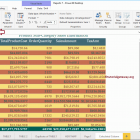
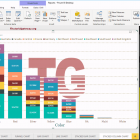
Create a table in Power BI

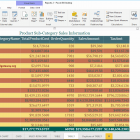
Let me show you how to create a table in Power BI with example. For this Power BI table report demo, we'll be using the SQL data source we created in ...
R Digital Marketing07/08/2022