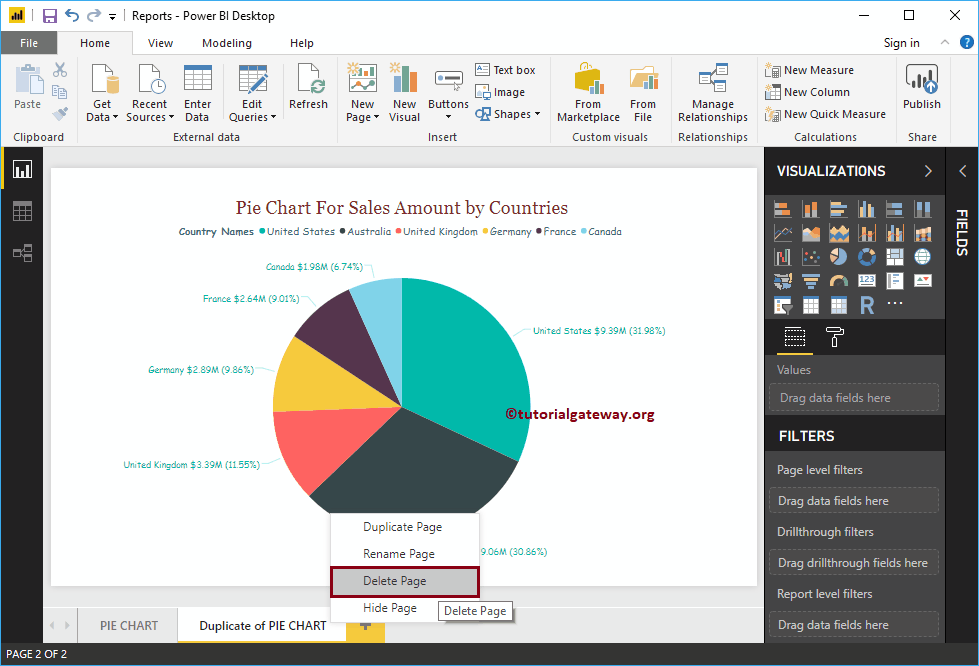
In this article, we show how to add new pages, rename pages, hide pages, duplicate pages, and delete pages in Power BI with an example. For the purpose…
In this article, we show how to add new pages, rename pages, hide pages, duplicate pages, and delete pages in Power BI with an example. For the purpose…
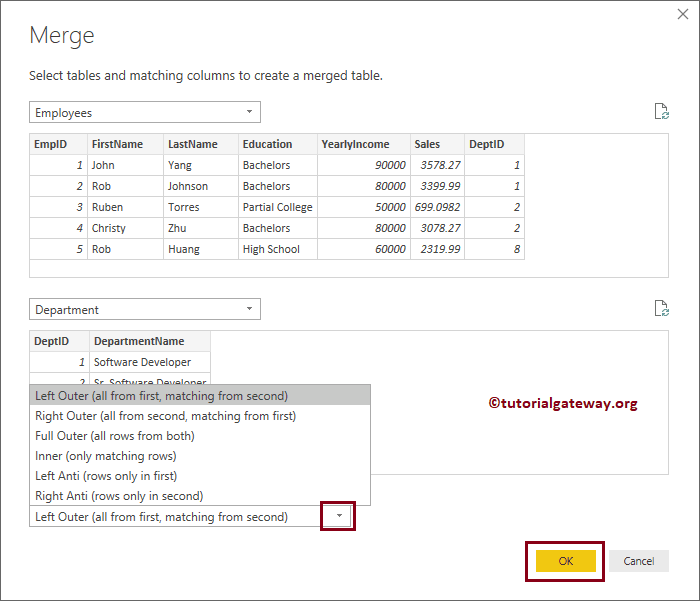
Power BI supports all major joins that are available in SQL. Let me show you how to use joins in Power BI to join multiple tables with an example. The following types…
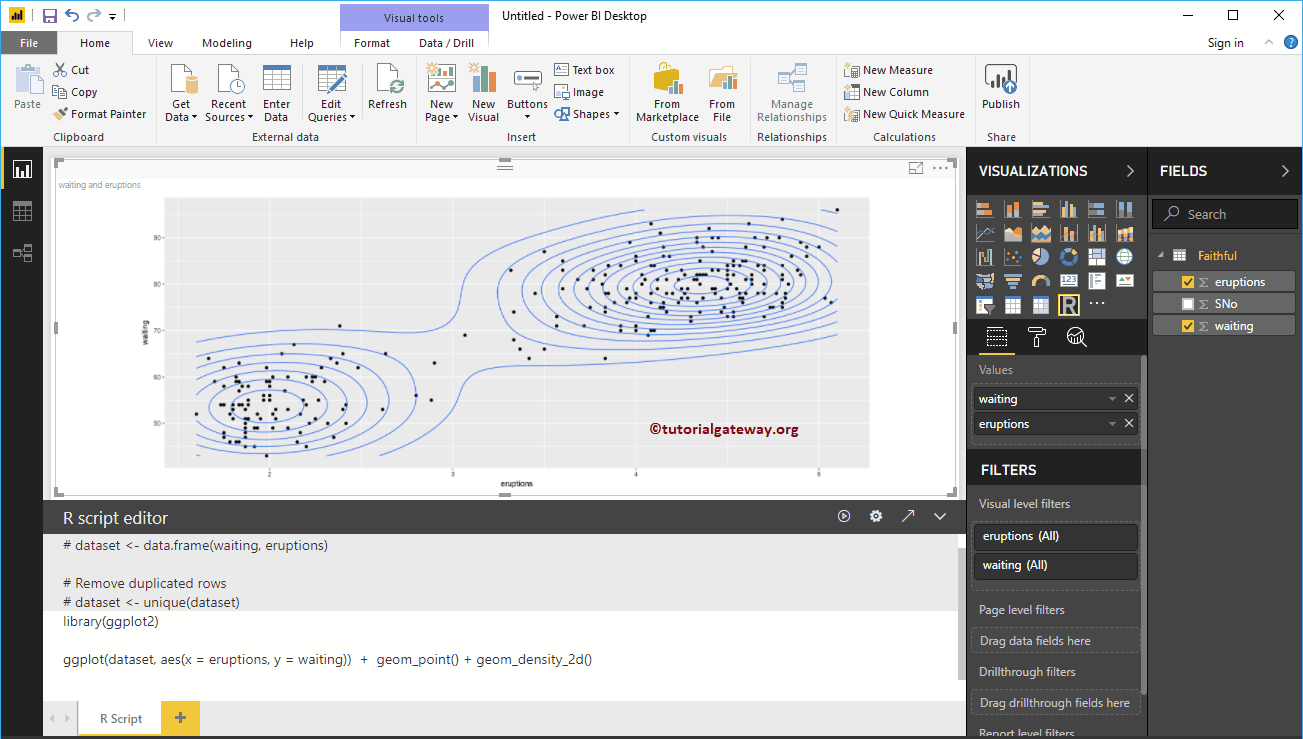
Power BI R Script allows you to use R visuals or R charts within your Power BI dashboard. Using an R script within Power BI is…
How to add an image to Power BI dashboard with practical example? For this Add Image to Power BI Dashboard demo, we will use the sixth dashboard. How to add…
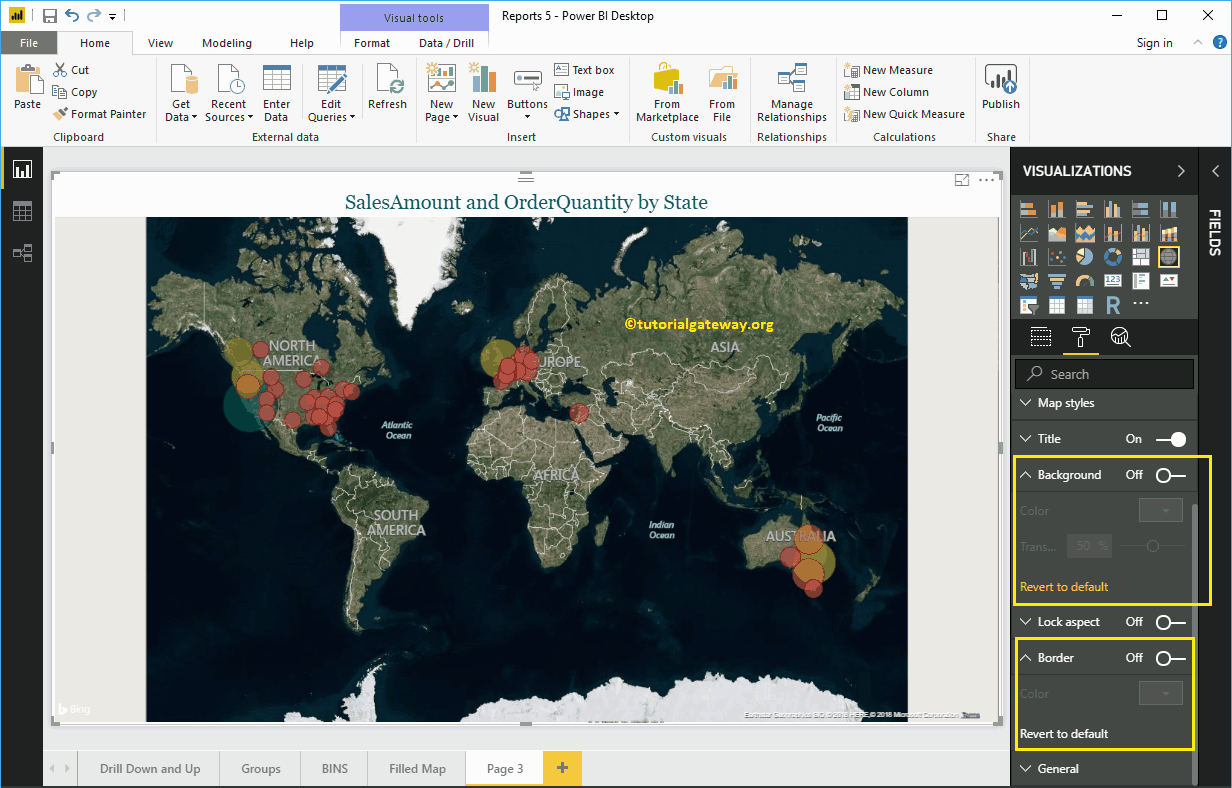
How to format Power BI map with example? Formatting the Power BI map includes changing the bubble size, color, text of…
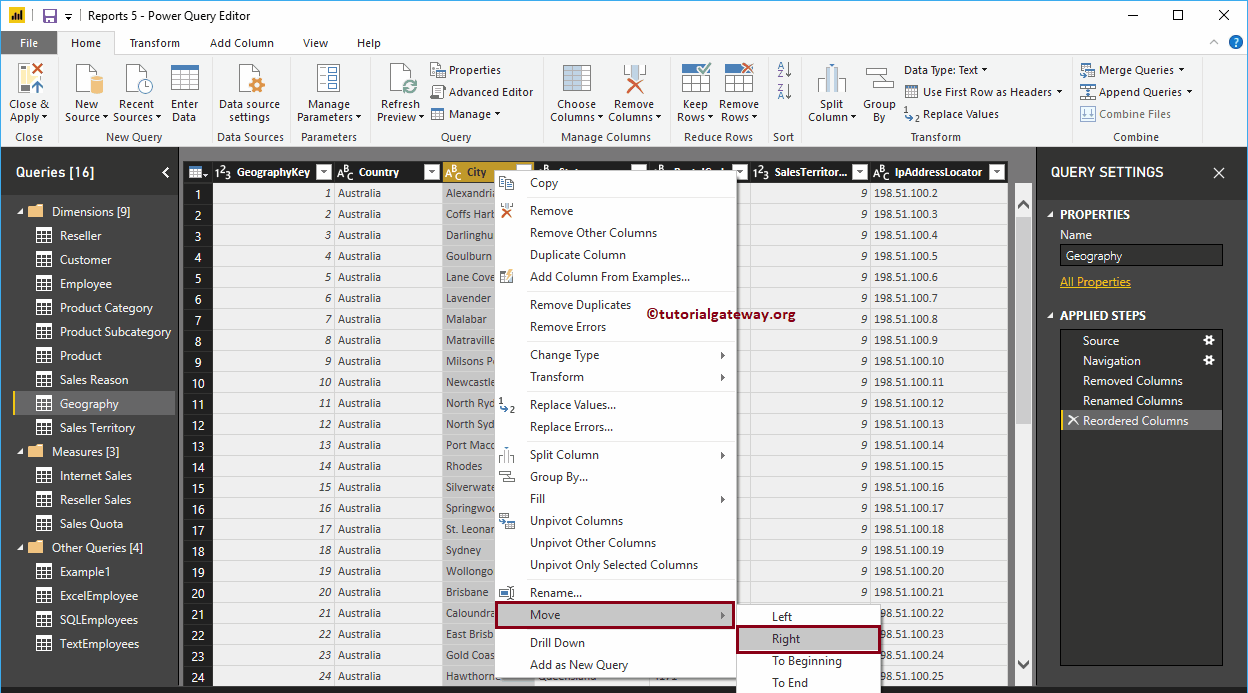
Generally, the data we get from the source may have few columns which may not be necessary for the analysis purpose. Let me show you the steps required to remove or…
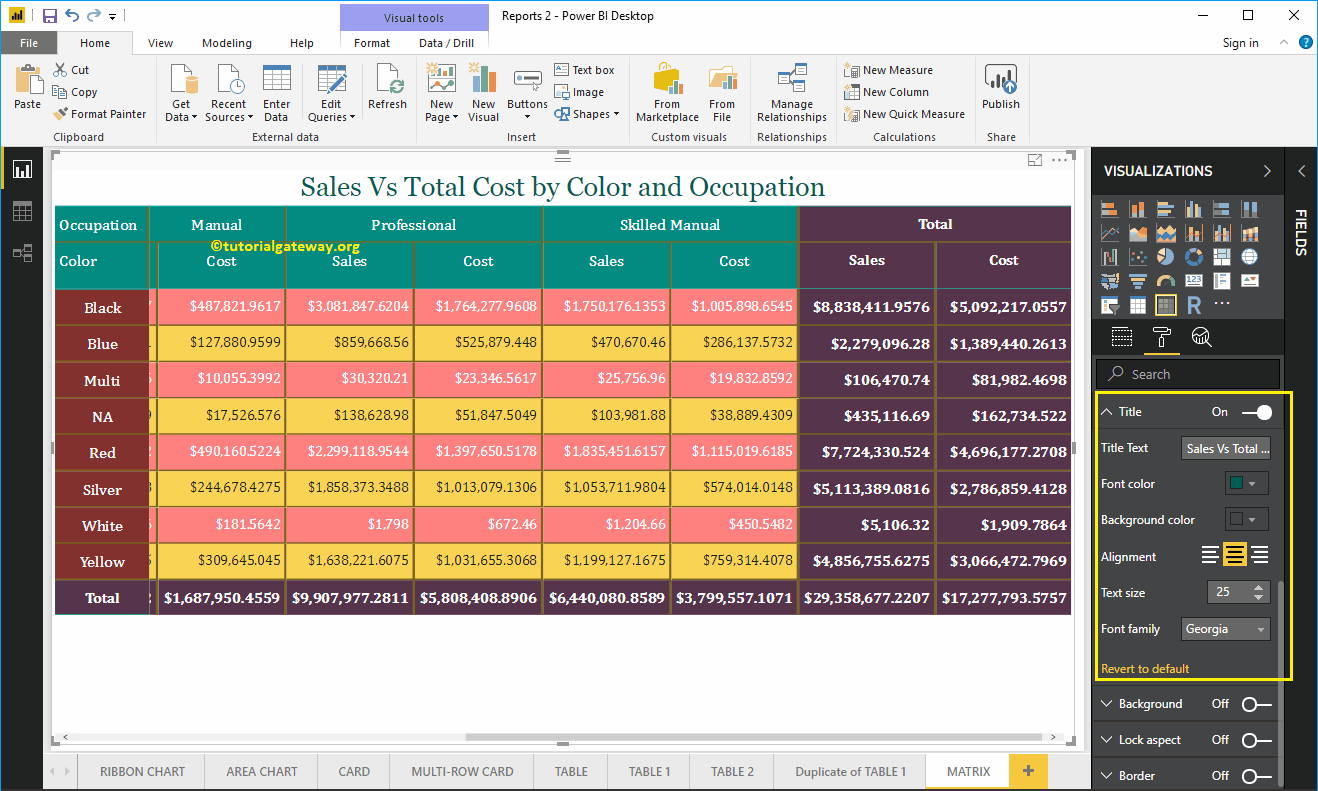
How to format Power BI Matrix report with example? The Power BI Format Matrix includes changing the colors of the matrix grid, the formatting…
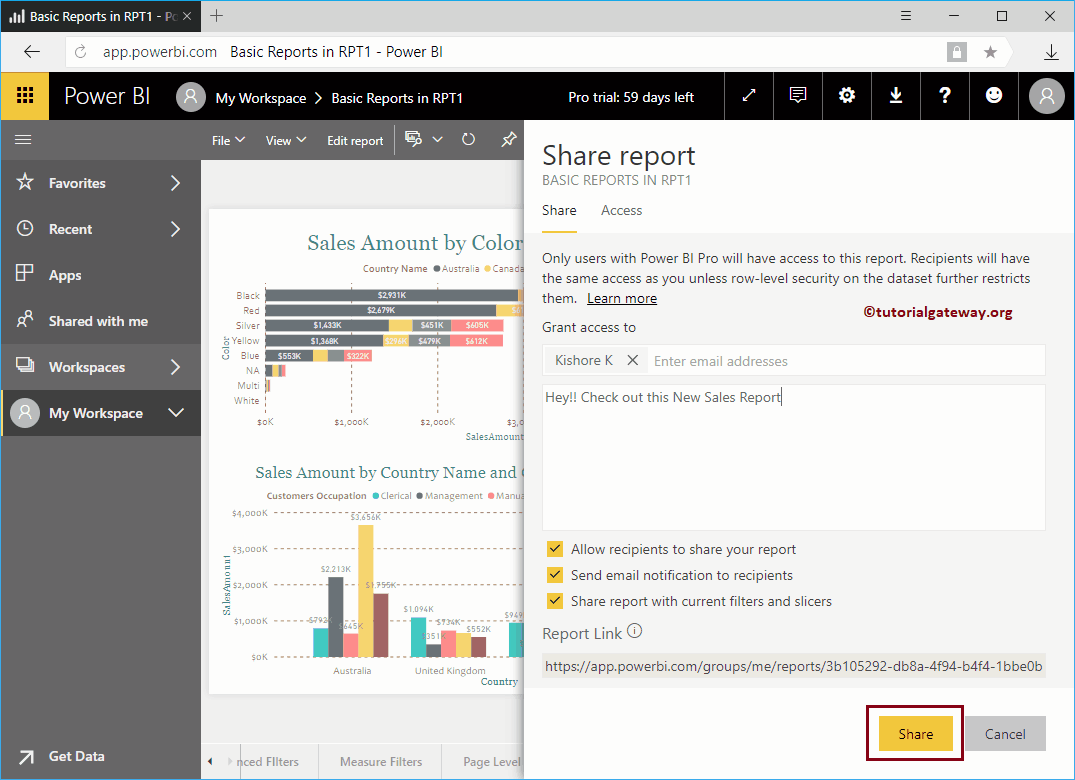
In this article, we show you the step-by-step approach to sharing a report in Power BI across your organization with a practical example. Before I start sharing...
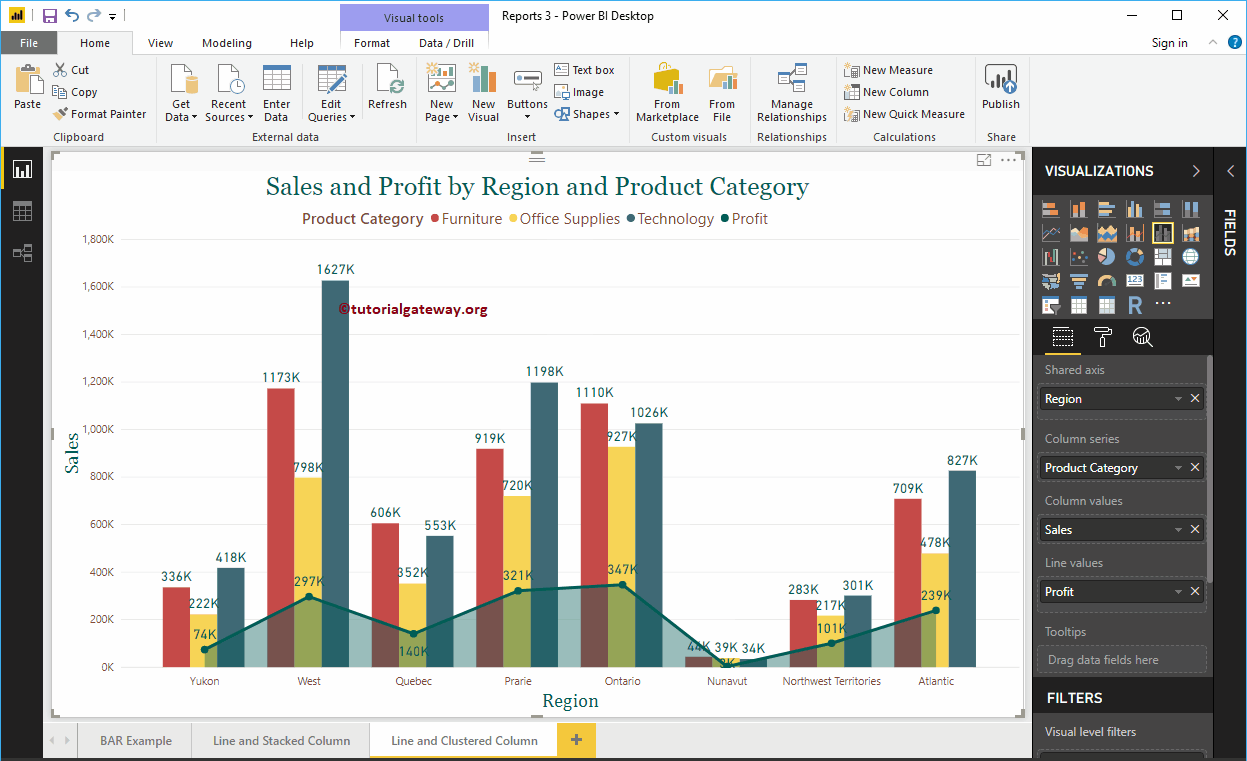
The Power BI Clustered Column and Line Chart is useful for visualizing various dimensions and measures. Let me show you how to create a clustered column chart and…
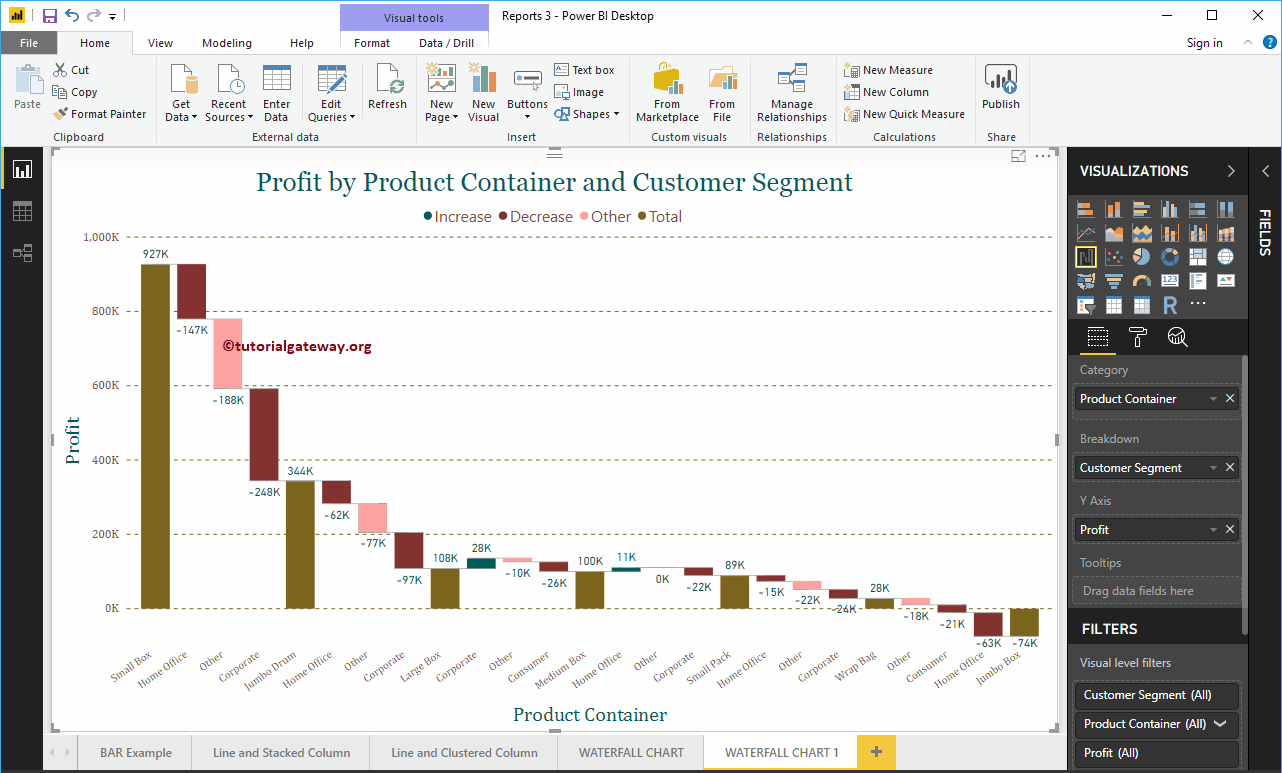
Power BI Waterfall Chart is very useful to visualize sales or profits over some time. Let me show you how to create a waterfall chart in Power BI with a…


© 2024 R Digital Marketing.