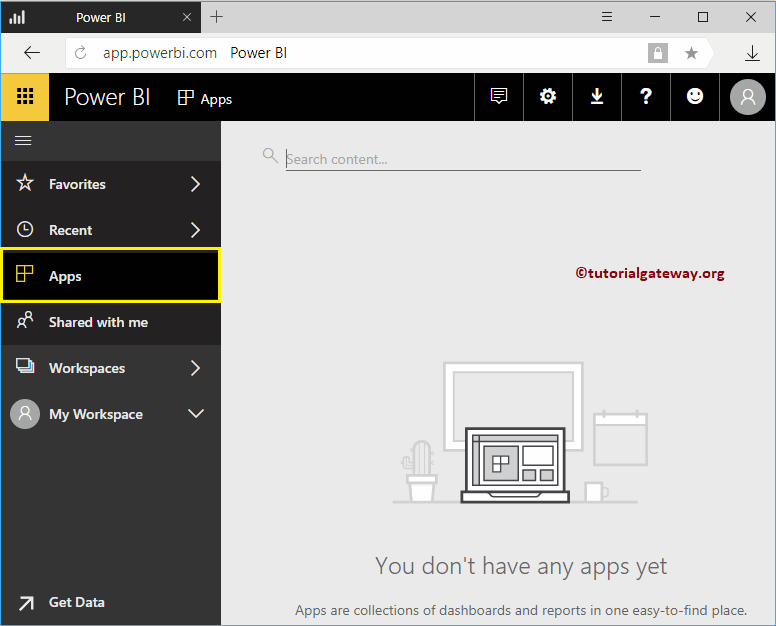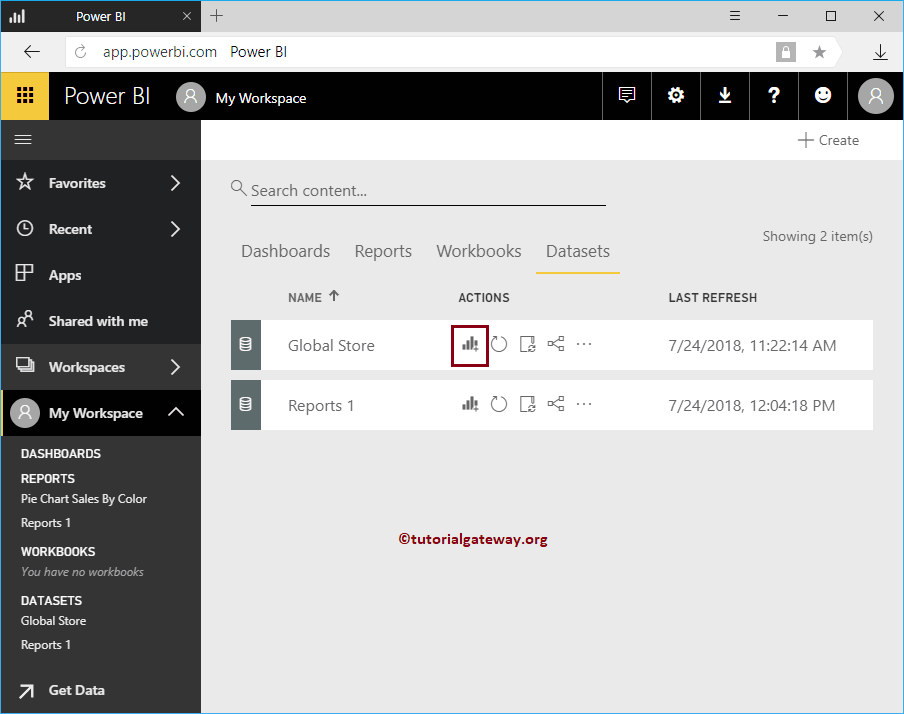
How to create a report using Excel data in Power BI Workspace with a practical example? It is the Excel workbook that we imported in our previous article. Before starting…
How to create a report using Excel data in Power BI Workspace with a practical example? It is the Excel workbook that we imported in our previous article. Before starting…
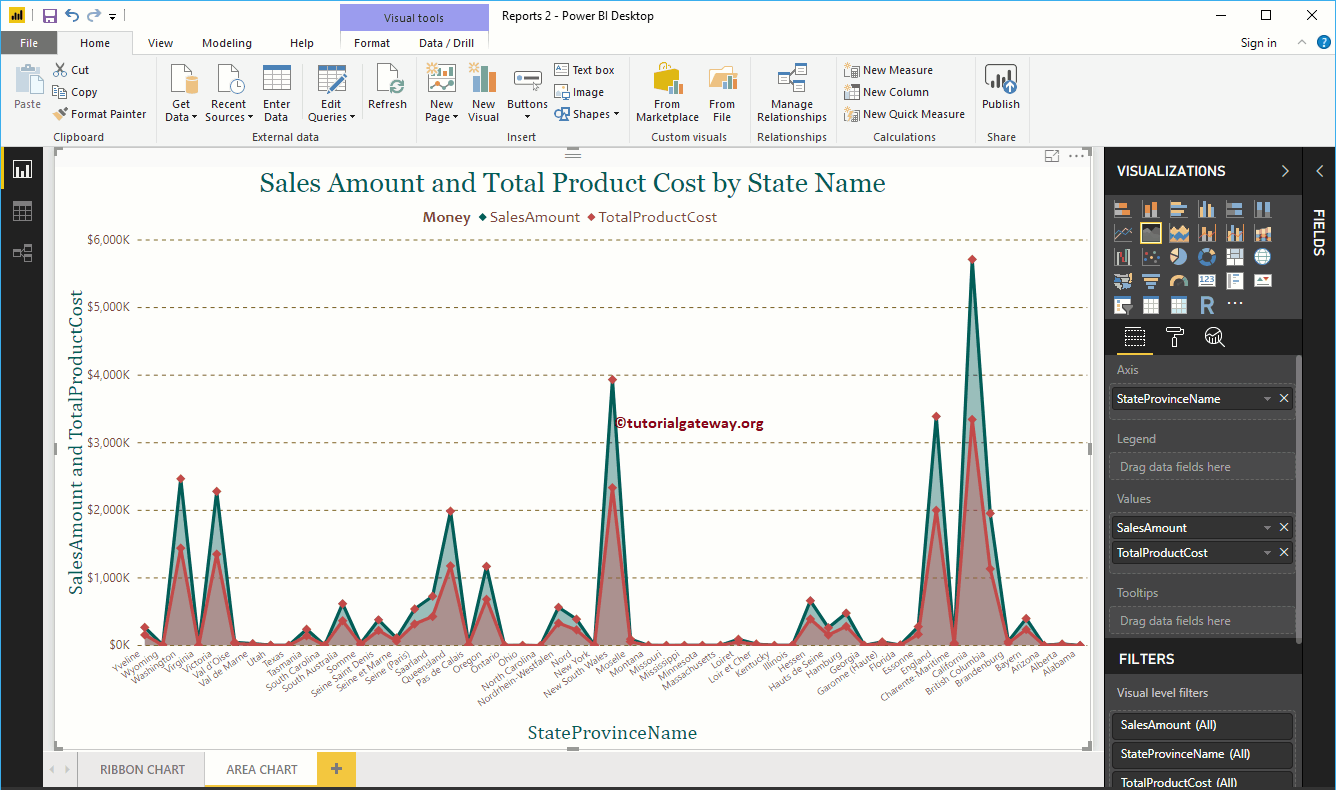
The Power BI area chart is the same as the line chart, where the area between the X axis and the lines is filled with a color….
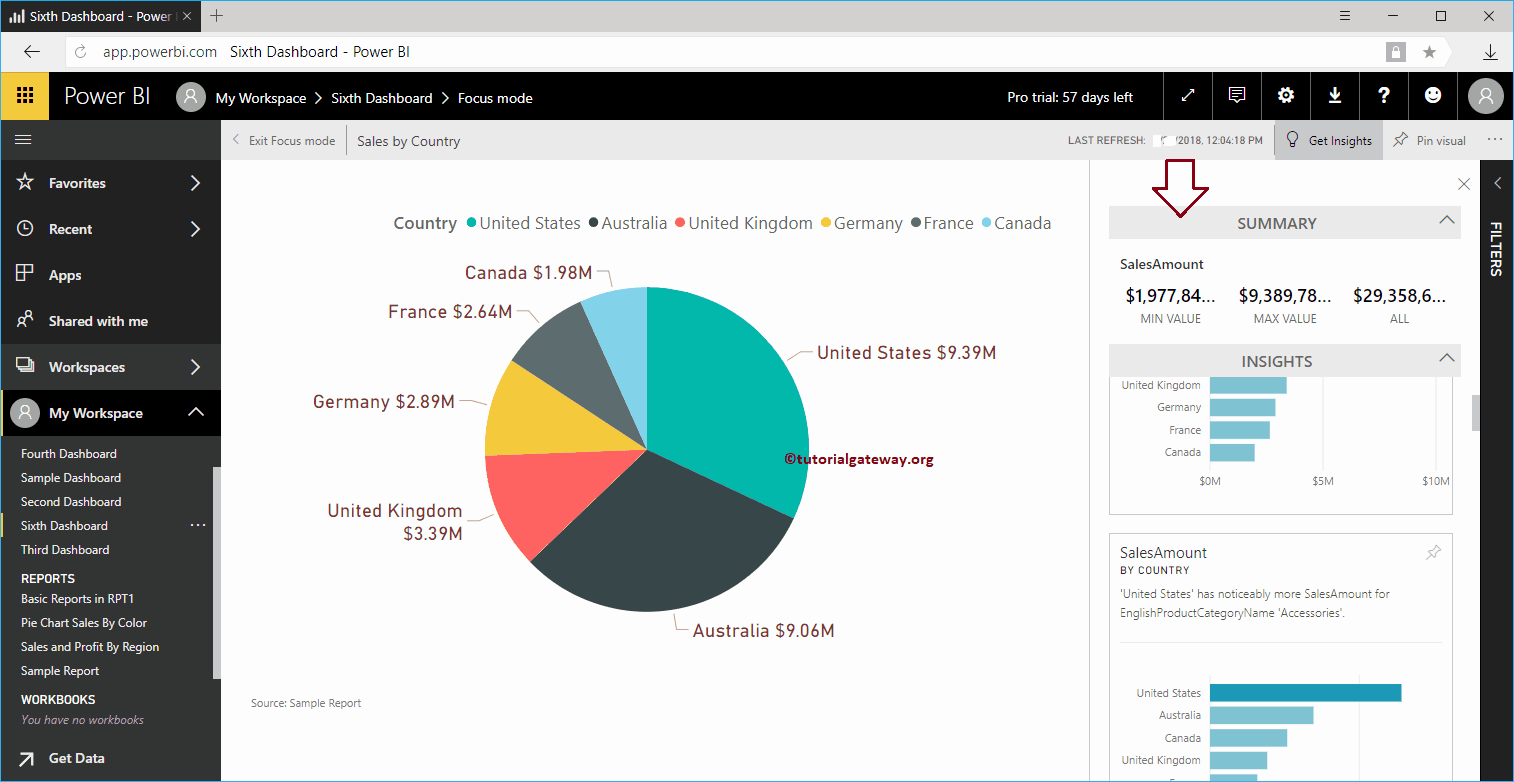
In this session, we show you how to get quick insights into Power BI with a practical example. Generally, there are two types of information in Power BI. One that runs on…
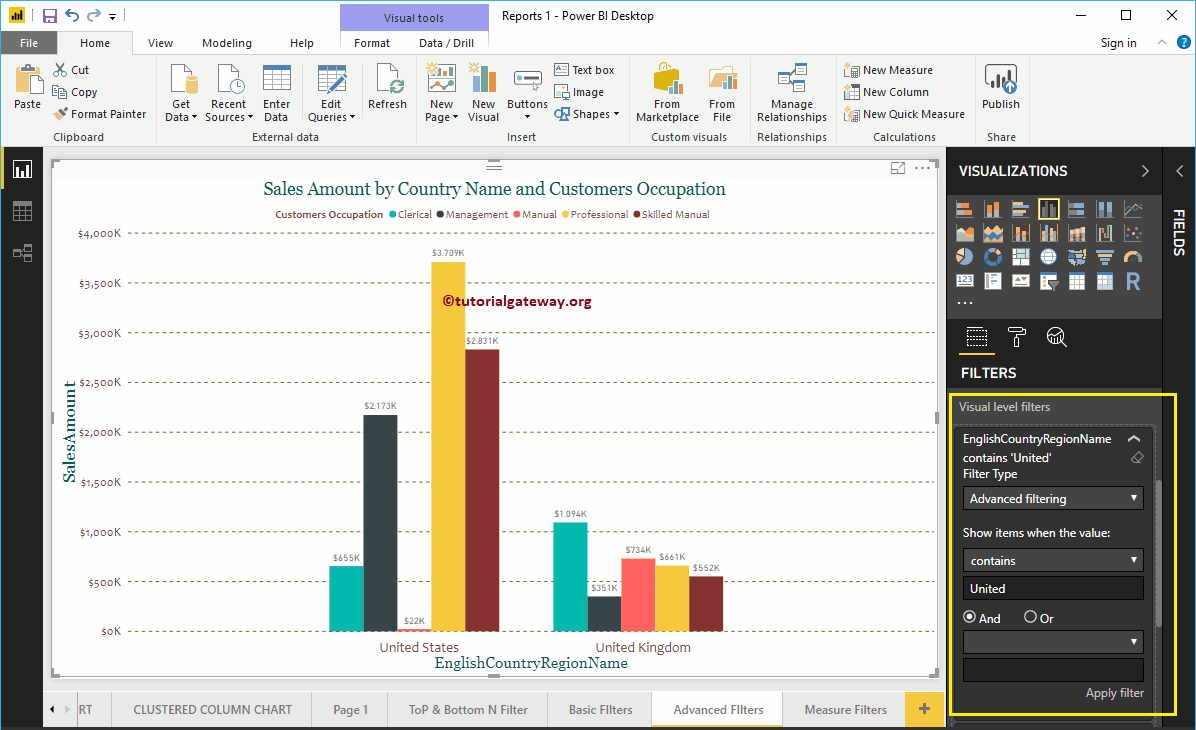
How to create advanced Power BI filters with an example?. Power BI advanced filters use wildcards to restrict report data based on requirements. For example,…
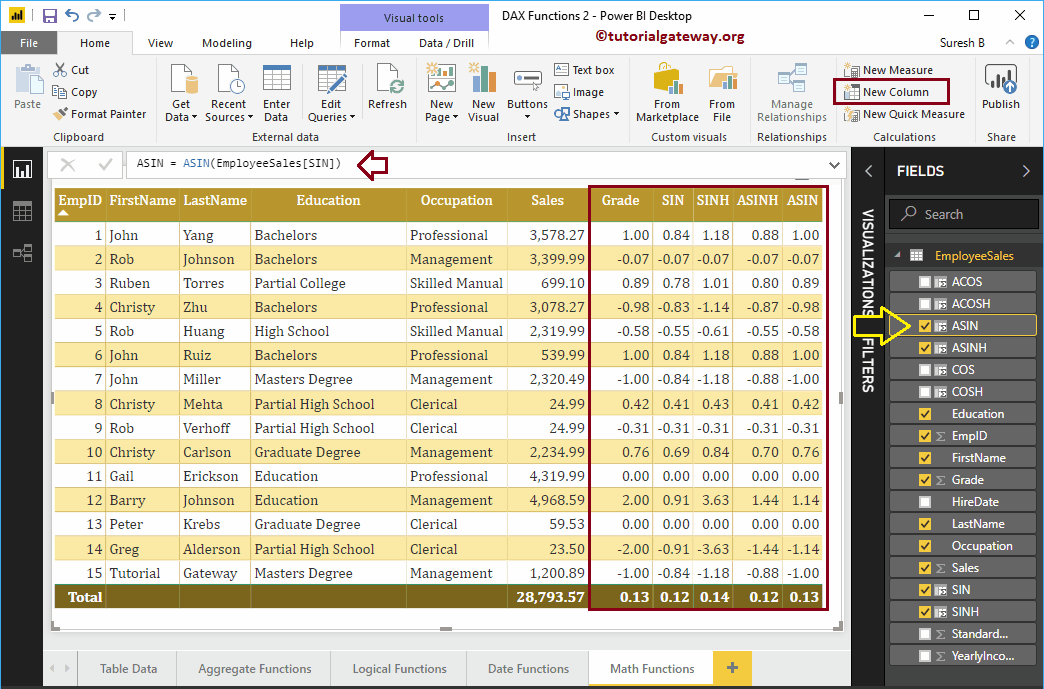
How to use Power BI DAX trigonometric functions with examples? Microsoft Power BI DAX provides several trigonometric functions such as EXP, COS, SIN, TAN, COSH, ACOS, ACOSH, ASIN, SINH, ASINH,…
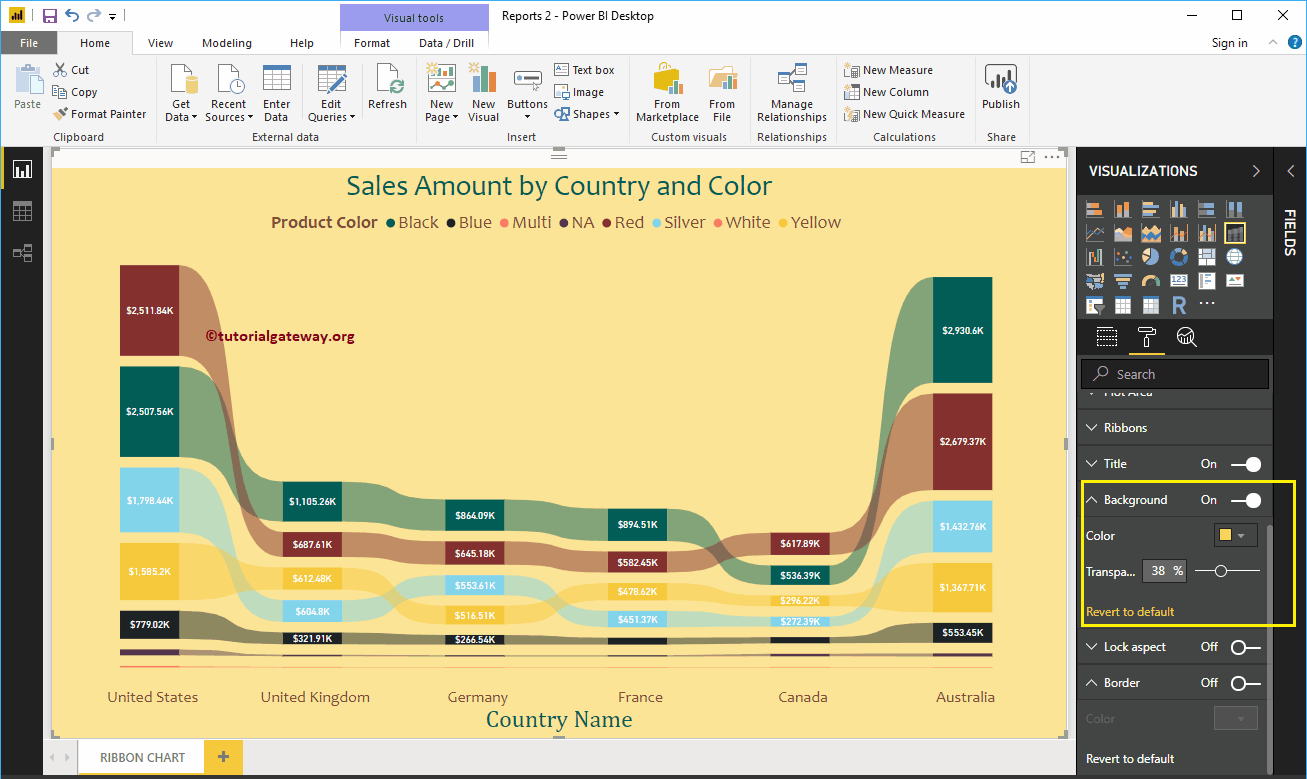
¿Cómo dar formato al gráfico de cinta de Power BI con un ejemplo? Dar formato al gráfico de cinta de Power BI incluye cambiar los colores de la cinta, el…
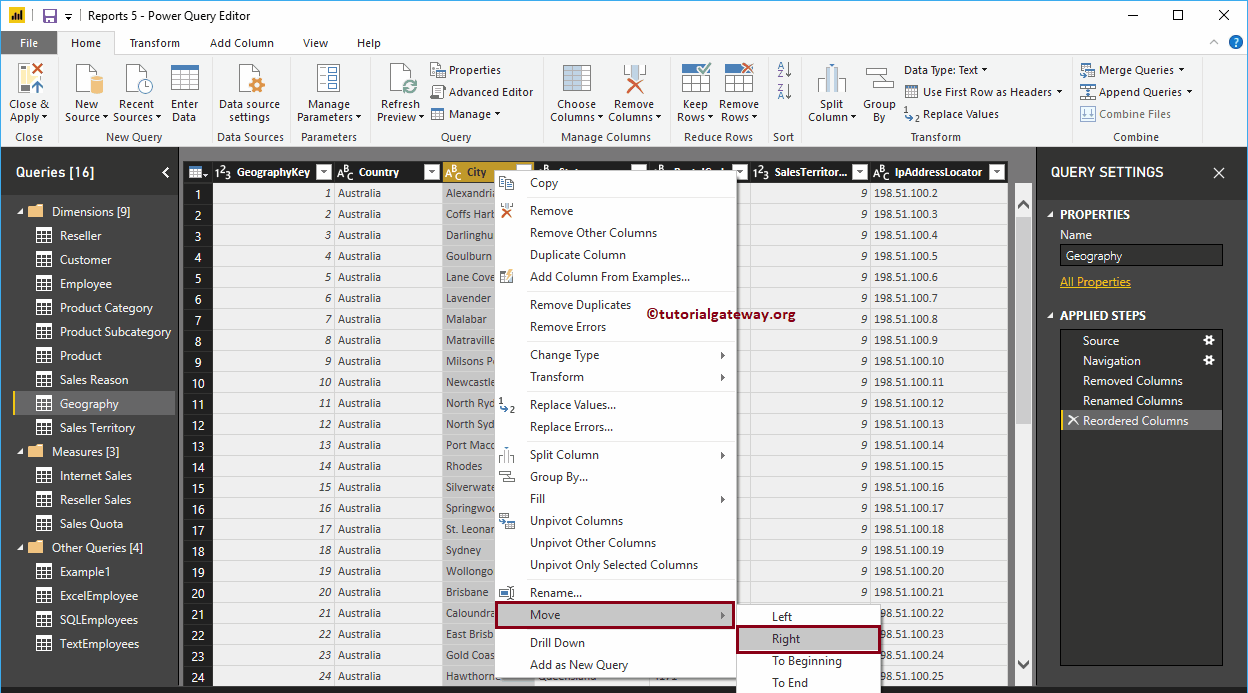
Generally, the data we get from the source may have few columns which may not be necessary for the analysis purpose. Let me show you the steps required to remove or…
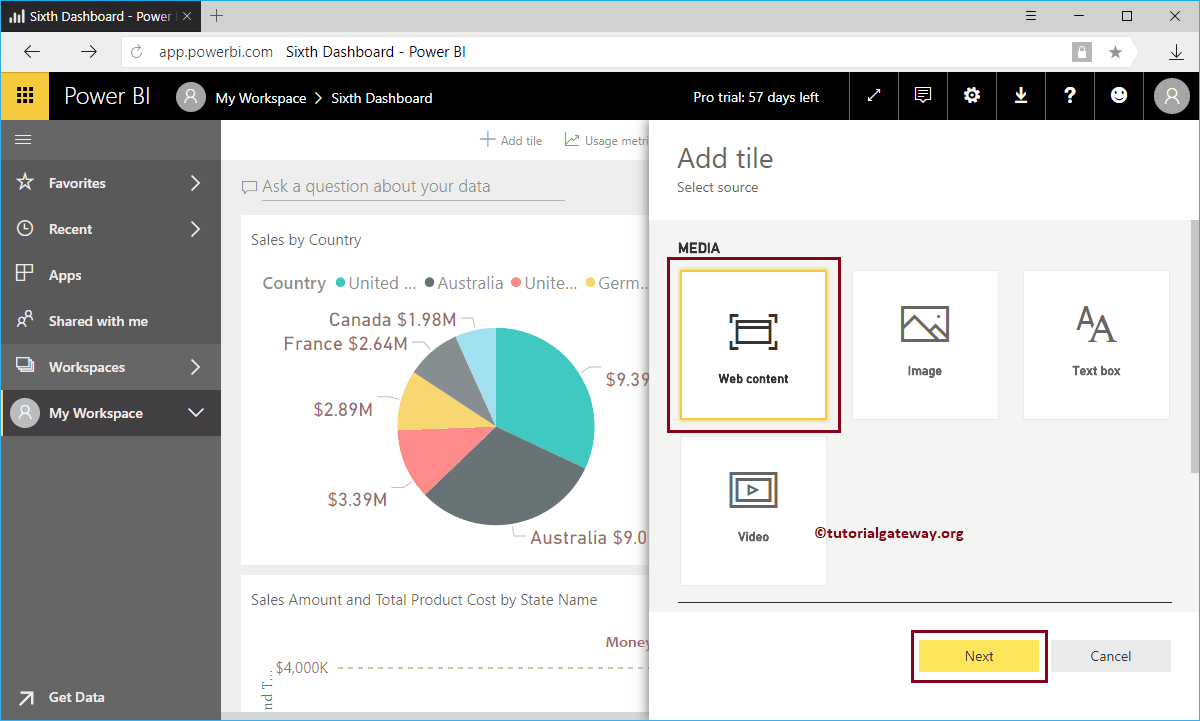
Permítame mostrarle cómo agregar contenido web al panel de Power BI con un ejemplo práctico. Para esta demostración de Agregar contenido web al panel de Power BI, vamos a insertar…
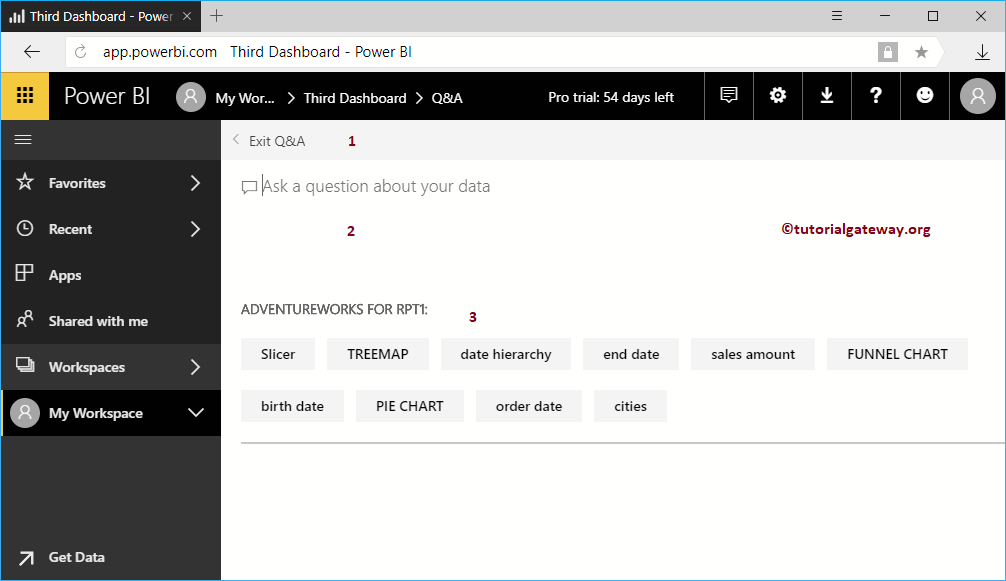
Power BI Q&A helps you ask business questions or perform data analysis with natural language. In this case, we show you the uses of Power BI Q&A with a…
Este artículo es una introducción al panel de Power BI. Cuando abre o inicia sesión en un servicio Power BI, puede ver el panel de Power BI predeterminado. Si es…


© 2024 R Digital Marketing.