Power BI grouping is the process of combining or merging two or more values for more detailed analysis. For example, when we view a report of products by category, we may find very few records (unnoticeable products). Sometimes it can be annoying to see all those underperforming products. In this situation, you can create a Power BI group by combining those records and displaying it as a product.
In this article, we show you how to create groups in Power BI reports with an example. For this Power BI groups demo, we will use the SQL data source that we created in our previous article.
See the article Connect to SQL Server to understand the Power BI data source.
Create groups in Power BI
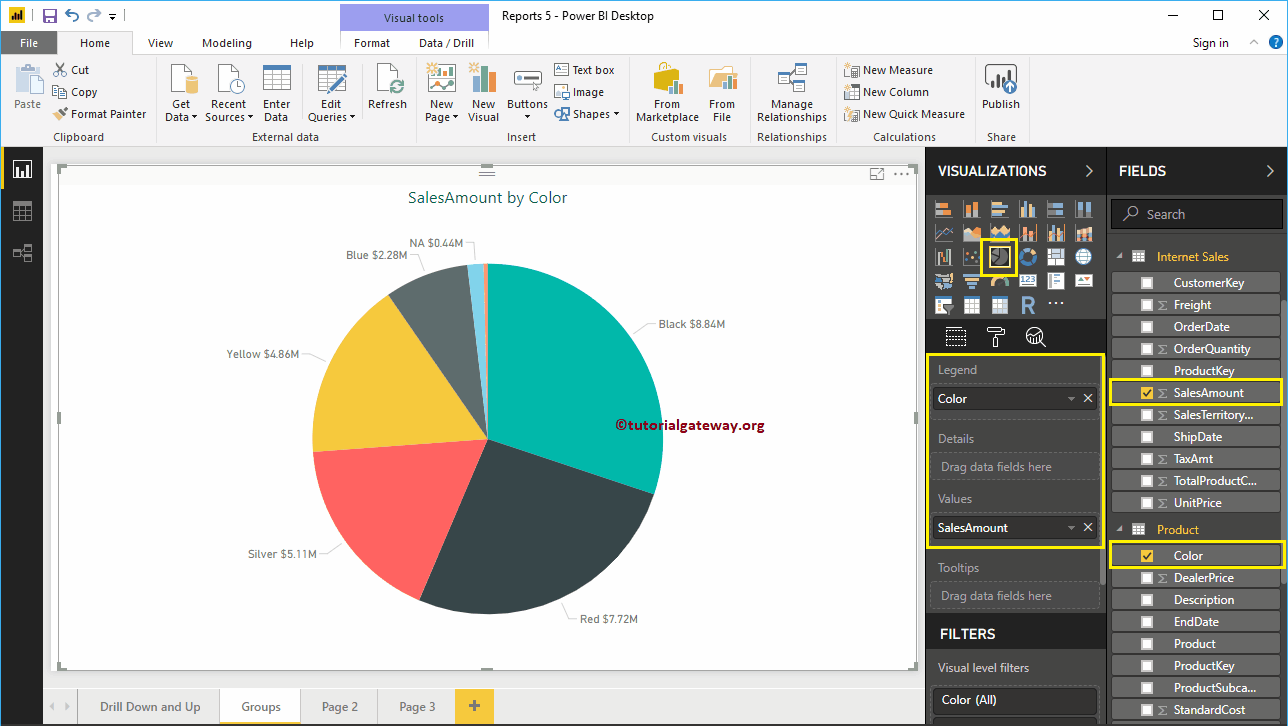
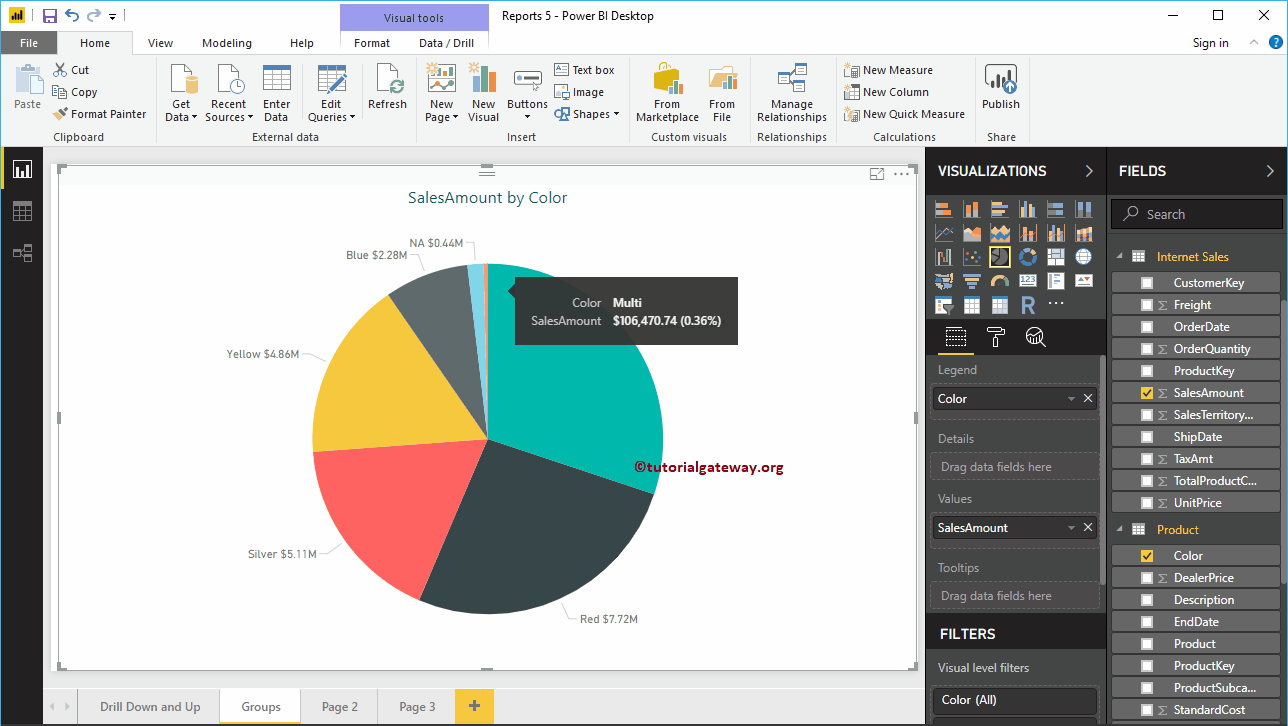
To visually demonstrate this Power BI grouping technique, we'll create a pie chart. As you can see in the following screenshot, we created a pie chart by dragging the Sales Amount column to the Values field and Color to the Legend region.
NOTE: I suggest that you refer to the article Create a Pie Chart and Format a Pie Chart to understand the steps required to create and format a pie chart.
If you look at the screenshot below, the data we highlighted, such as Multi, NA and Blue color products, do not perform well. So, let's group them
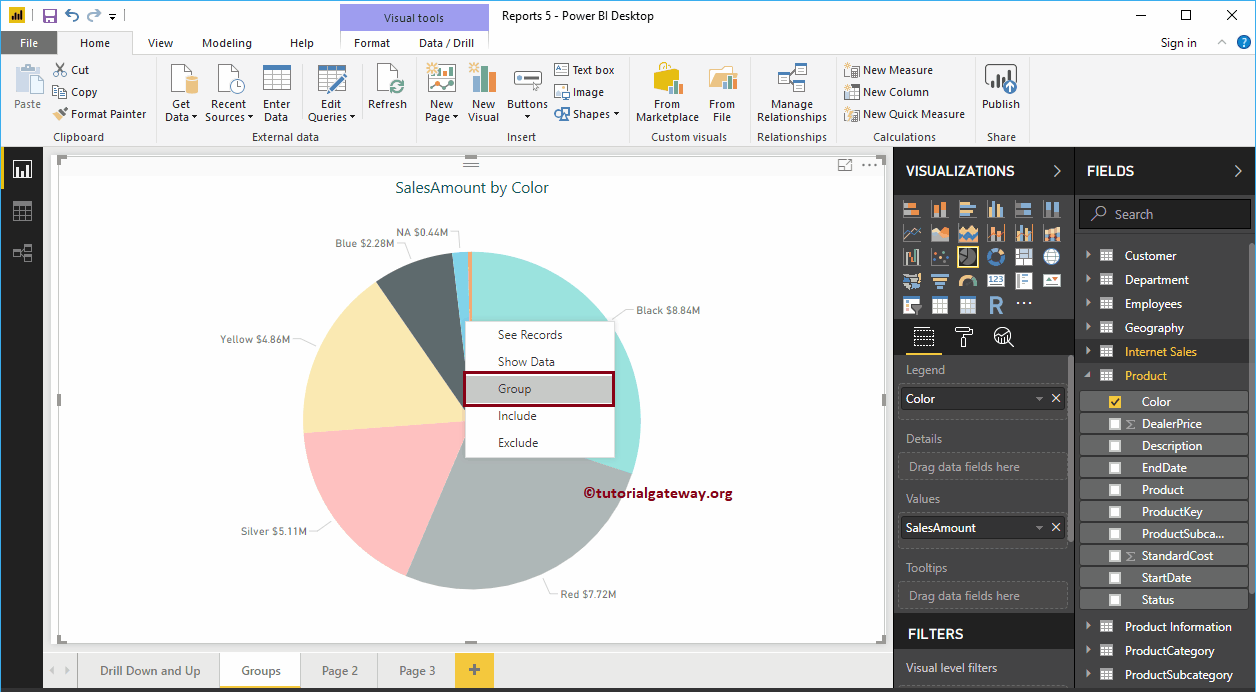
To group in Power BI, select the fields you want to group and right-click to open the context menu. Select the Group option from the menu.
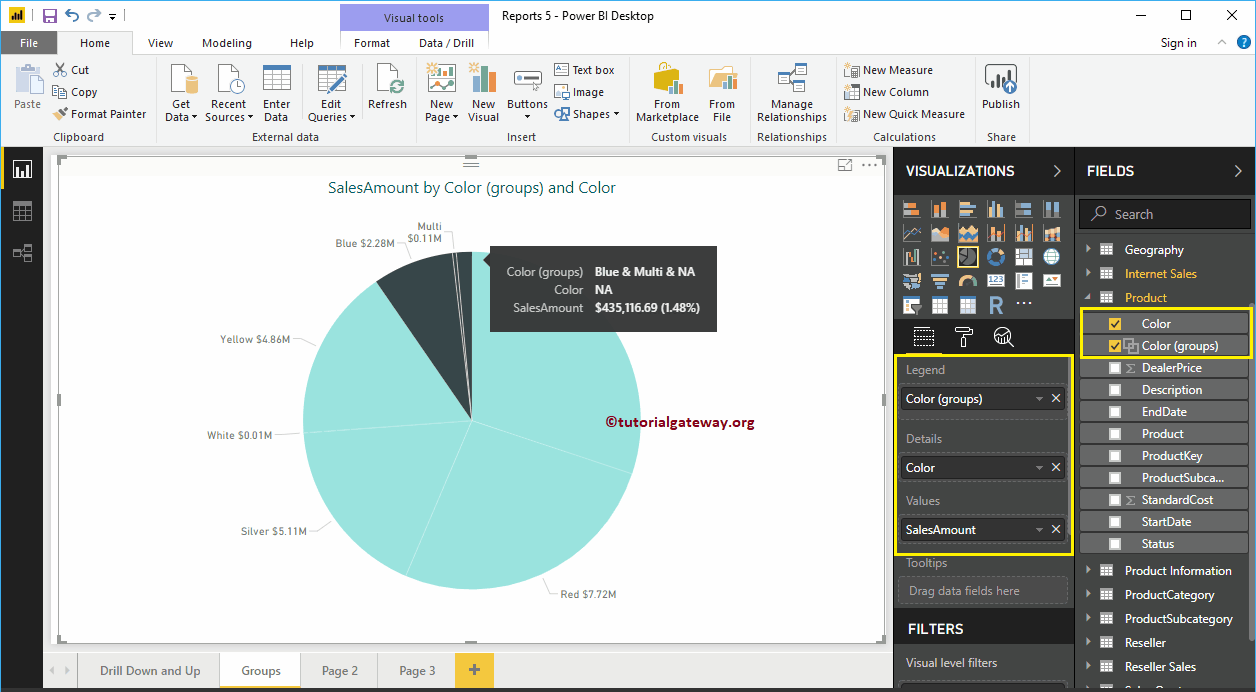
Once you click on the Group option, Power BI will automatically group those items as shown below. That's it, we did the grouping.
If you look closely, the Legend section is replaced by the Color group and the color is placed in the details section.
TIP: By default, the Power BI Group option will group the selected items as one group and the remaining options as another group.
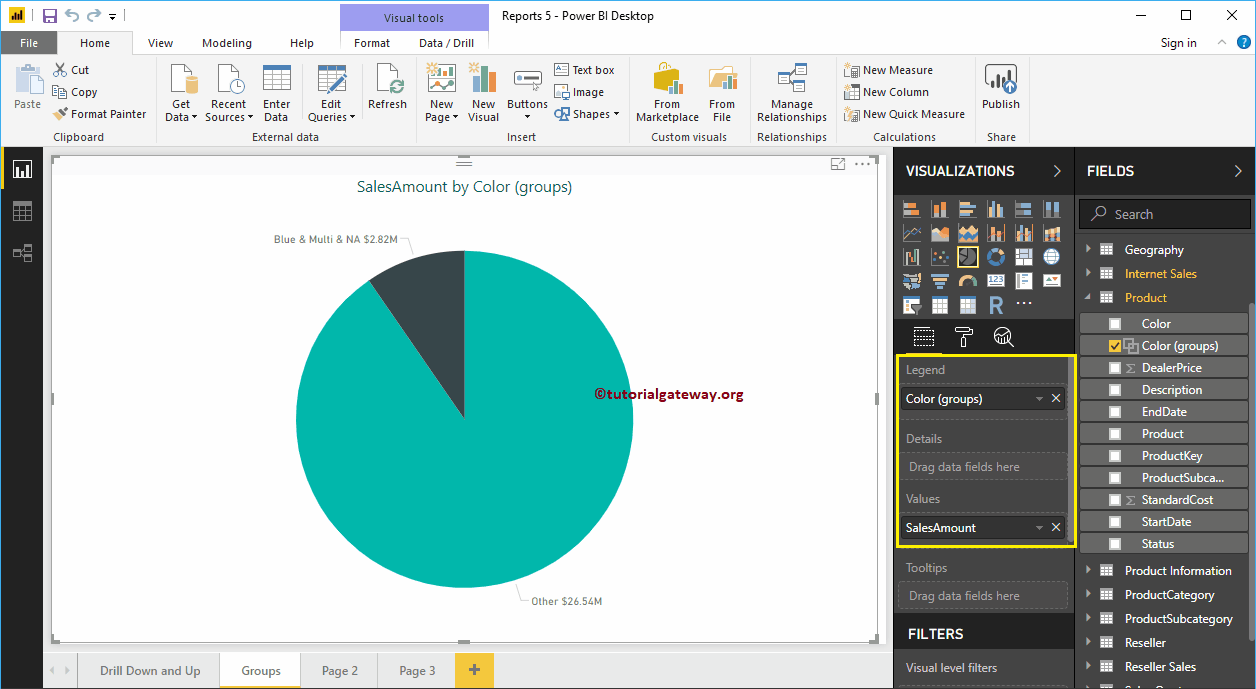
Let me remove the Color field from the Details section. Now you can see only two partitions in the pie chart: one contains the colors blue, white, and NA, and the second partition contains the remaining colors.
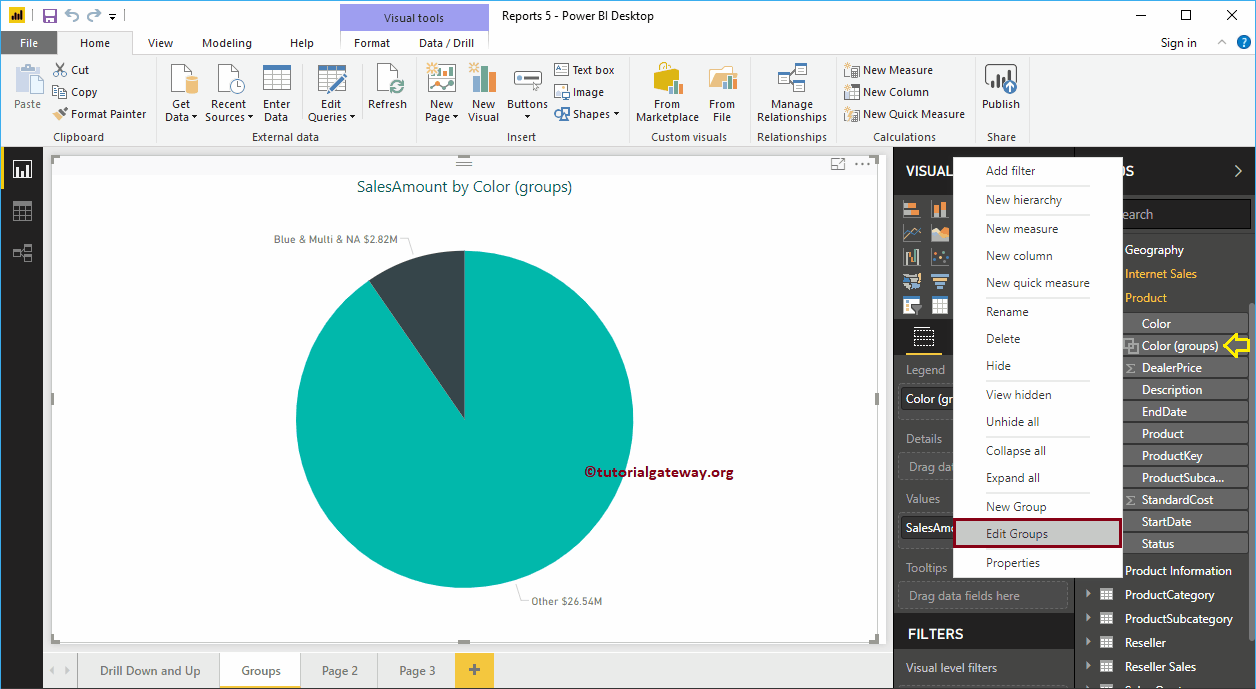
Edit Power BI group
Select the group you want to edit and right-click on it to open the context menu. Select the Edit groups option to do it
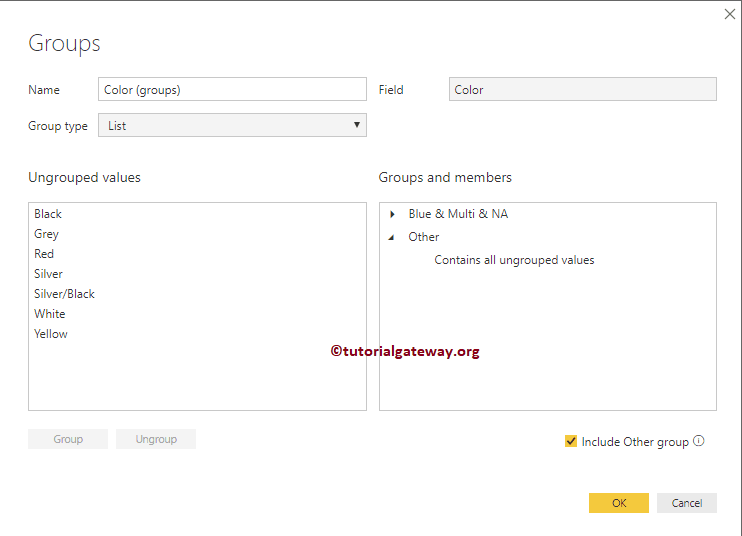
By clicking on the Edit groups The option will open the following window.
- Name: Specify the group name
- Countryside: Field or column you used to group
- Group type: List (group) or container.
- Ungrouped values: Fields that are not grouped but available in this column.
- Groups and members: List of groups and their members.
- Include another group: Do you want to put all the ungrouped members in the Other group? If so, check this option.
Let me uncheck the Include another group. This will remove the group of others
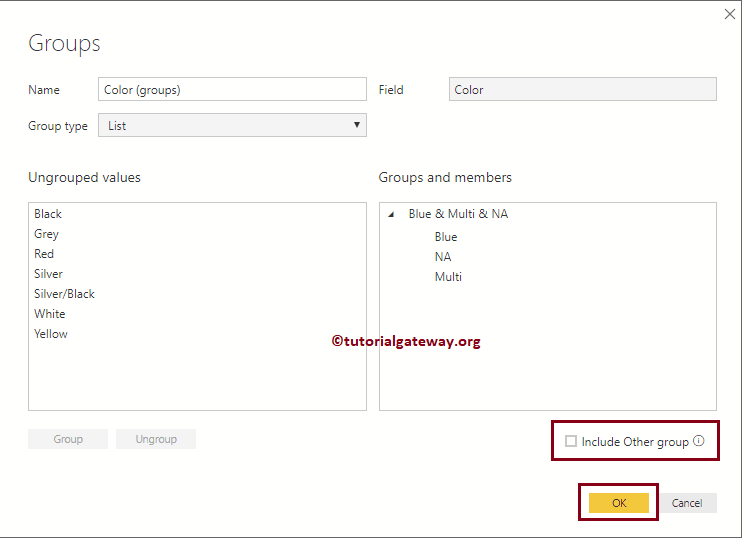
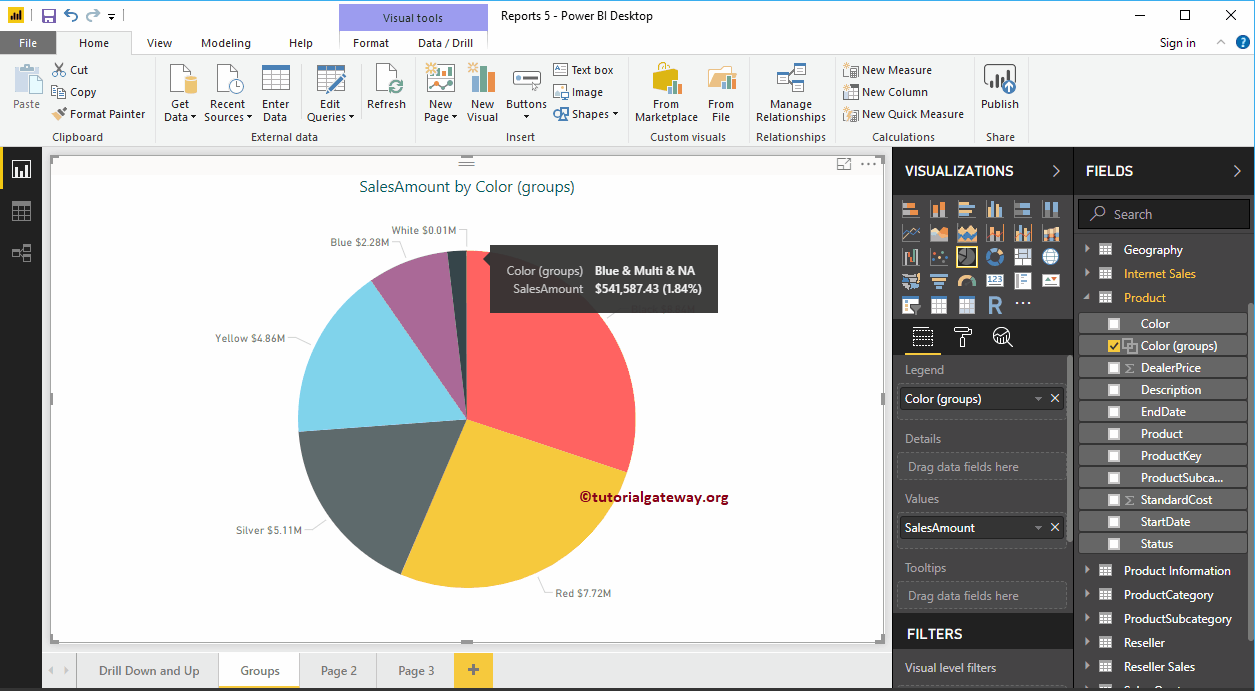
You can now see the pie chart showing all the colors and a group containing the colors Blue, Multi, and NA.
Remove group members from Power BI
To remove members from the Power Bi group, select the group member you want to remove and click the ungroup button. For demonstration purposes, we will remove the color blue.
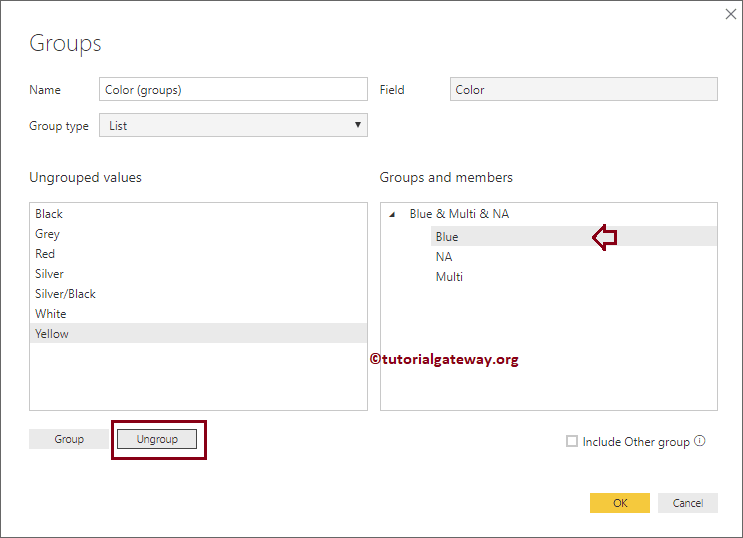
Now you can see the blue color is removed and added below the ungrouped values
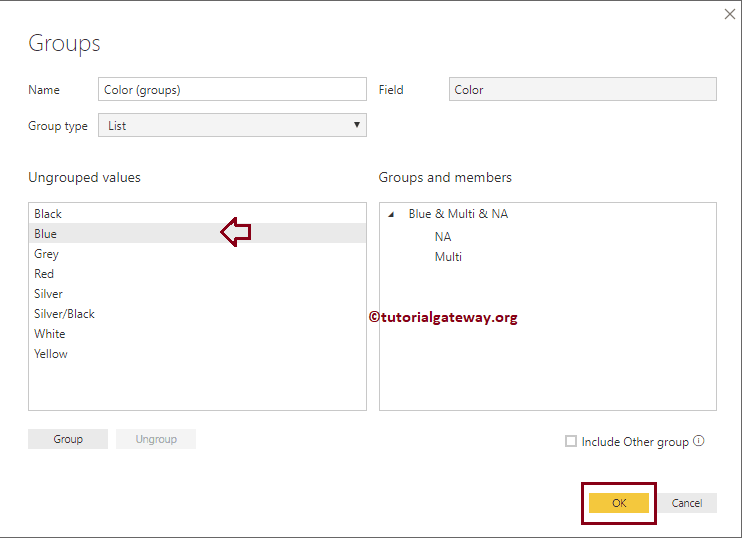
And our pie chart shows all the colors and a group containing Multi and NA colors.
Rename a group in Power BI
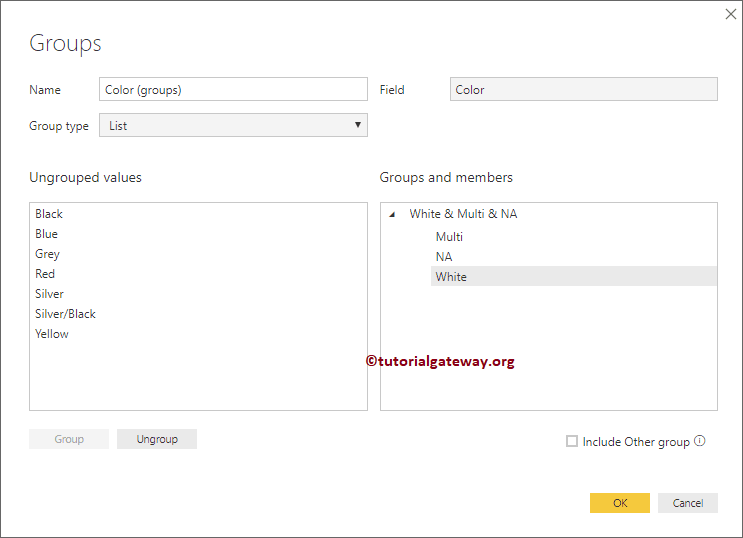
Double-click the group you want to rename and provide a valid name. Let me change the name to White & Multi & NA
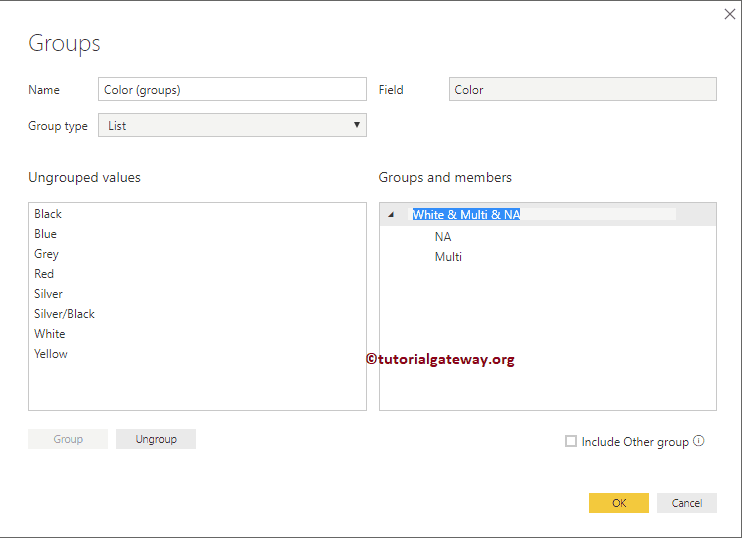
In the below screenshot, you can see the group name is changed.
Add a member to groups in Power BI
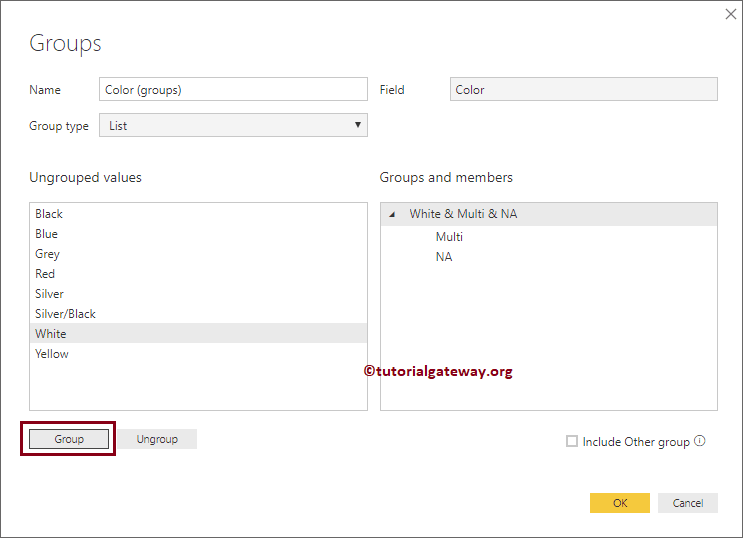
Select the group member you want to add and select the group as well. Then click the Group button.
For the purpose of demonstration, we are adding white to an existing group.

Now you can see the white color under the group.
Create a new group in Power BI
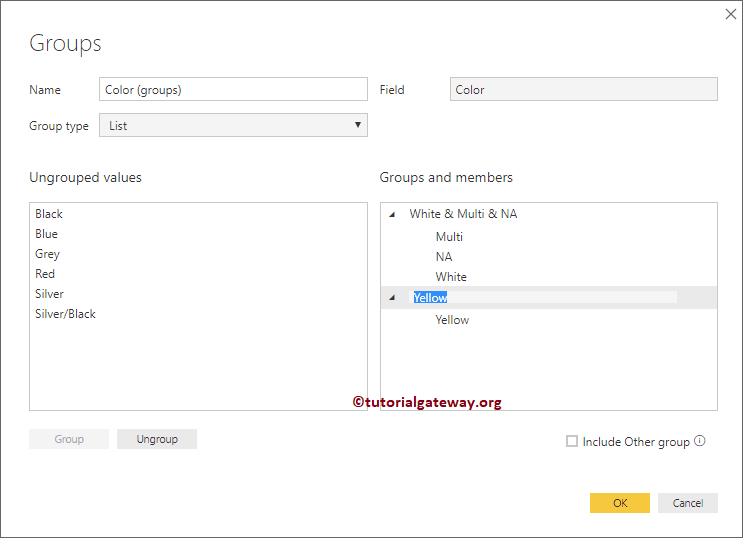
Select the field for which you want to create a group and click the group button. For the purpose of demonstration, we are selecting the color yellow.
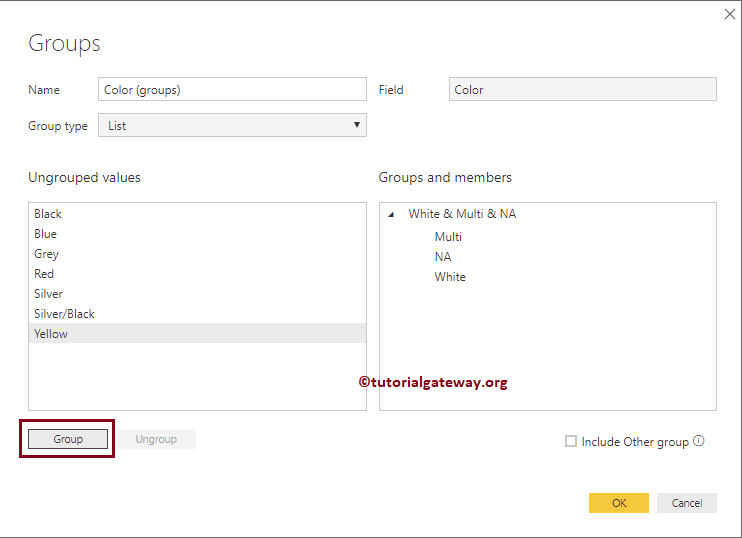
Now you can see the new group.

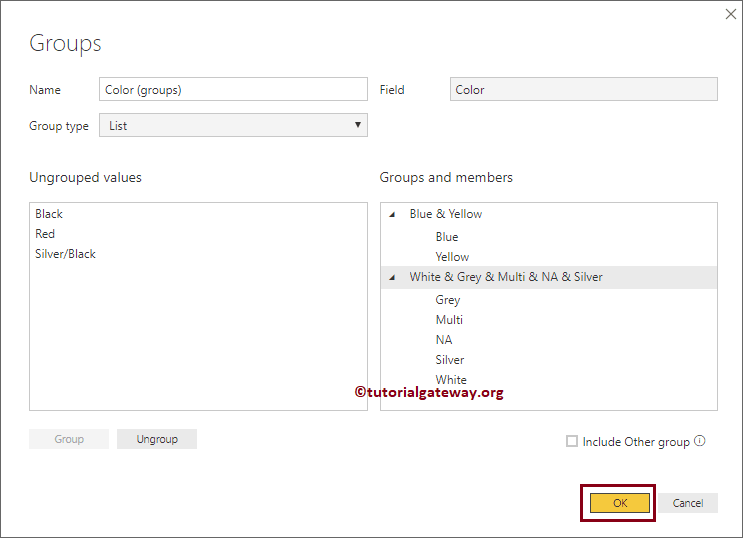
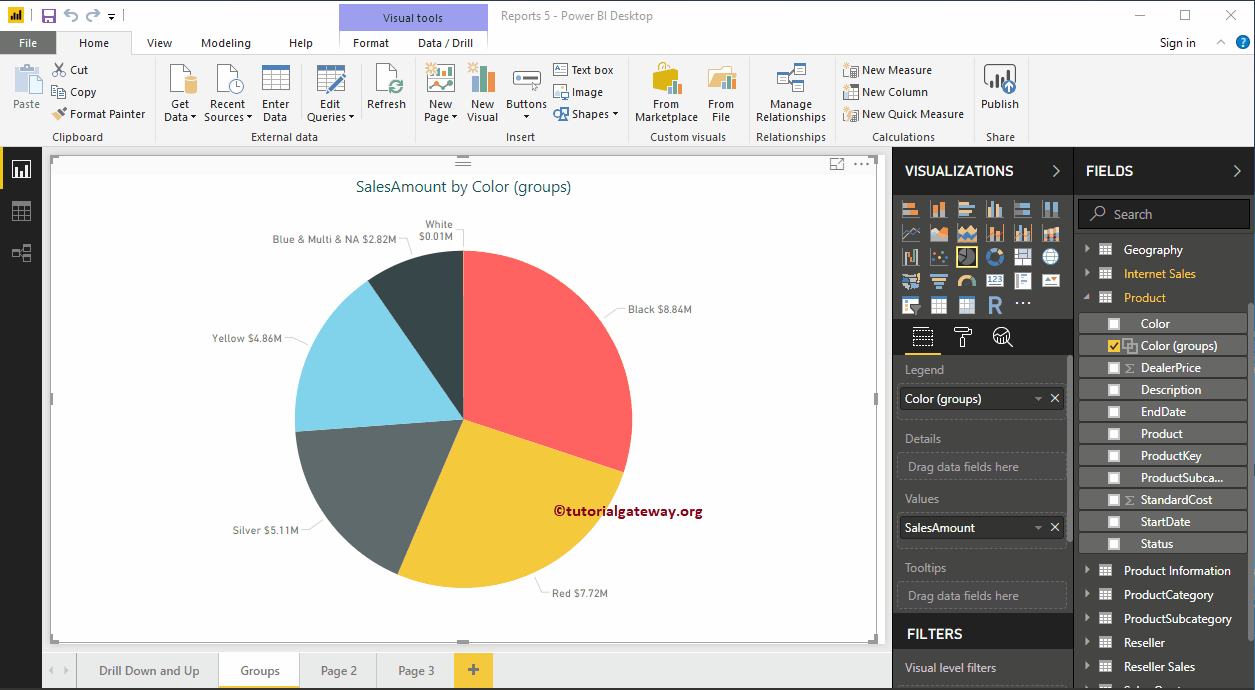
Let me add a few more fields

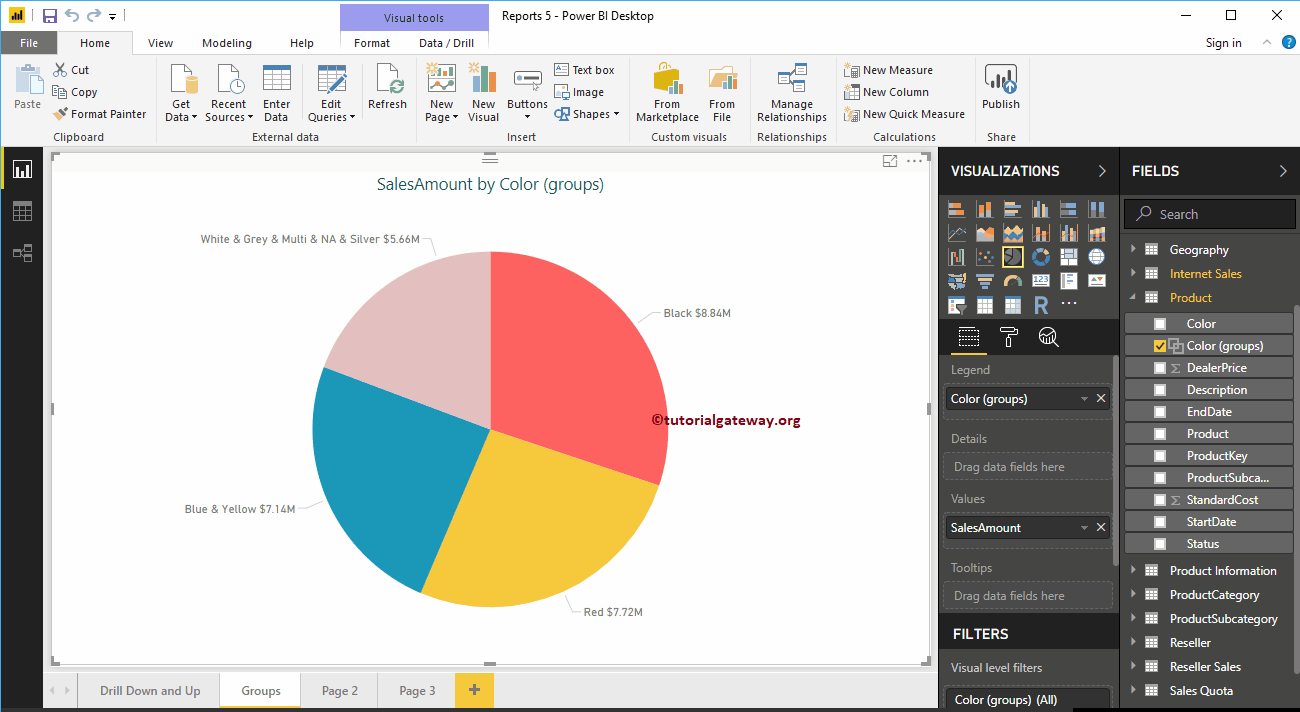
Now you can see, our pie chart has four colors, and they are: black, red, and two groups

Once you've created a group in Power BI, it will act like any other column or field. So you can use it on N numbers of charts.
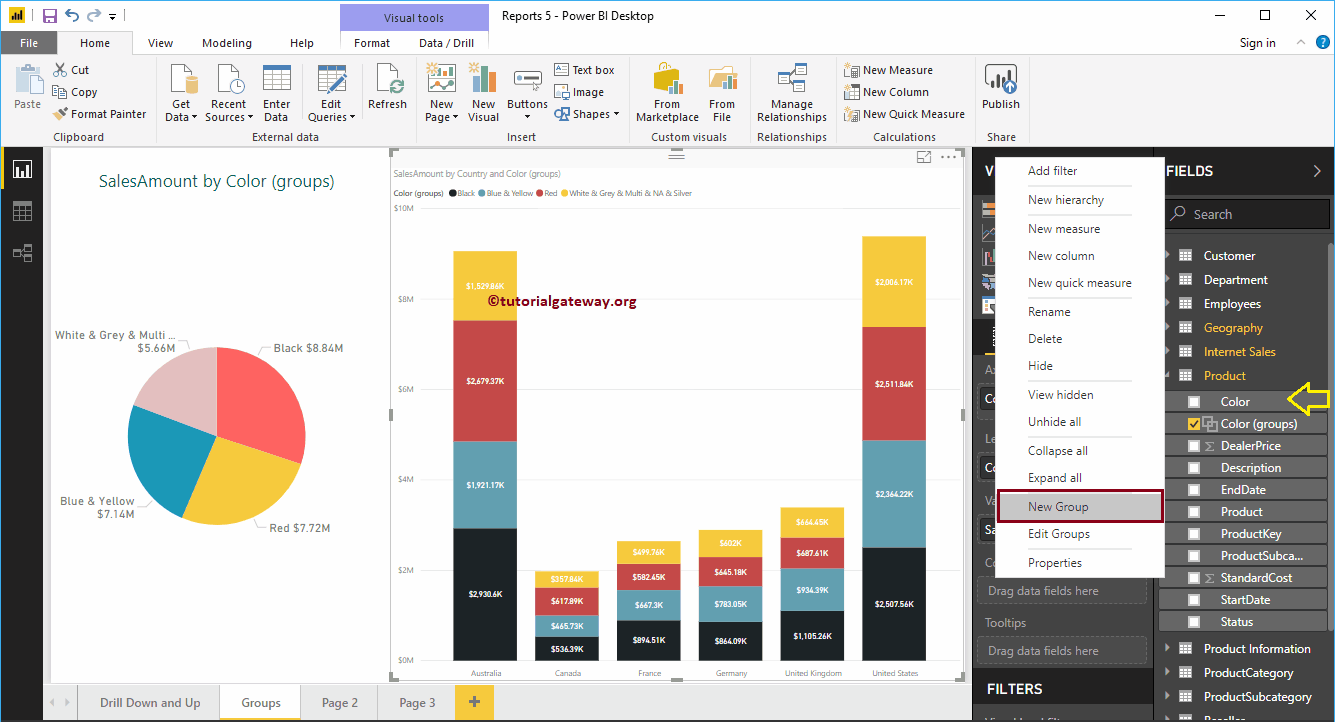
To demonstrate the same, we created a column chart showing sales by country.
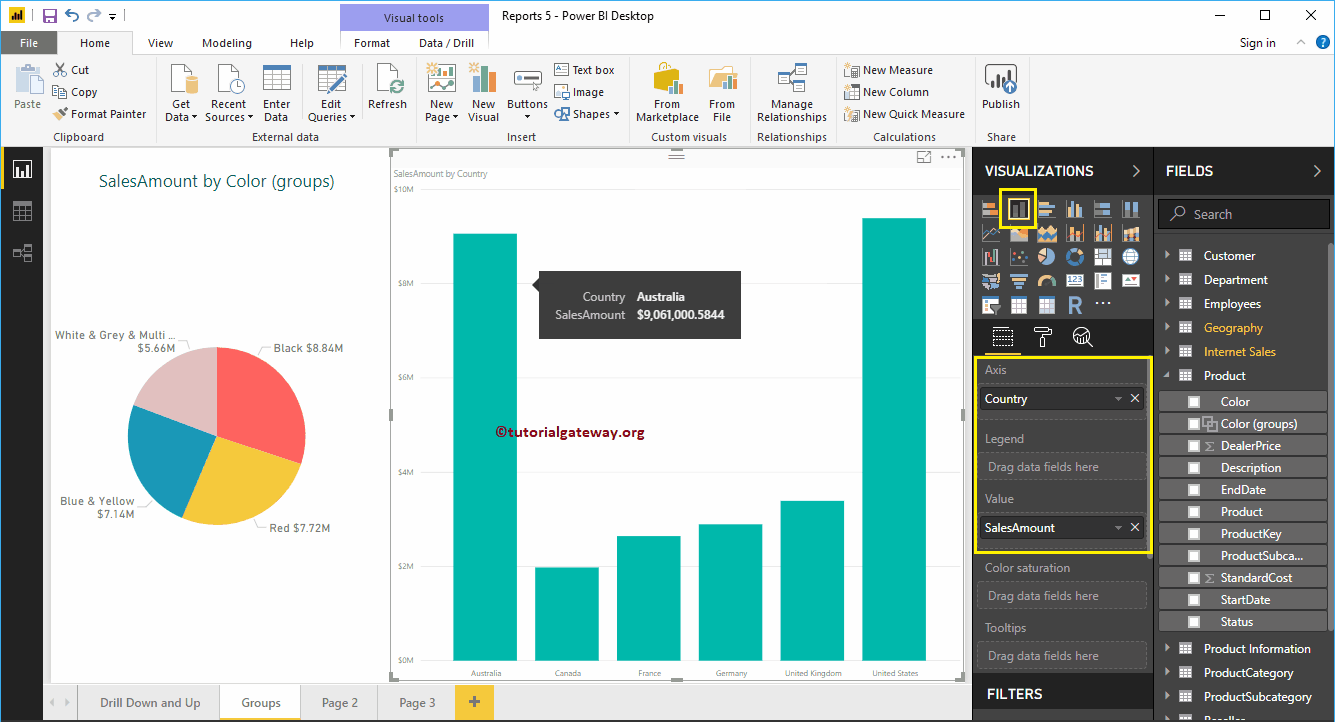
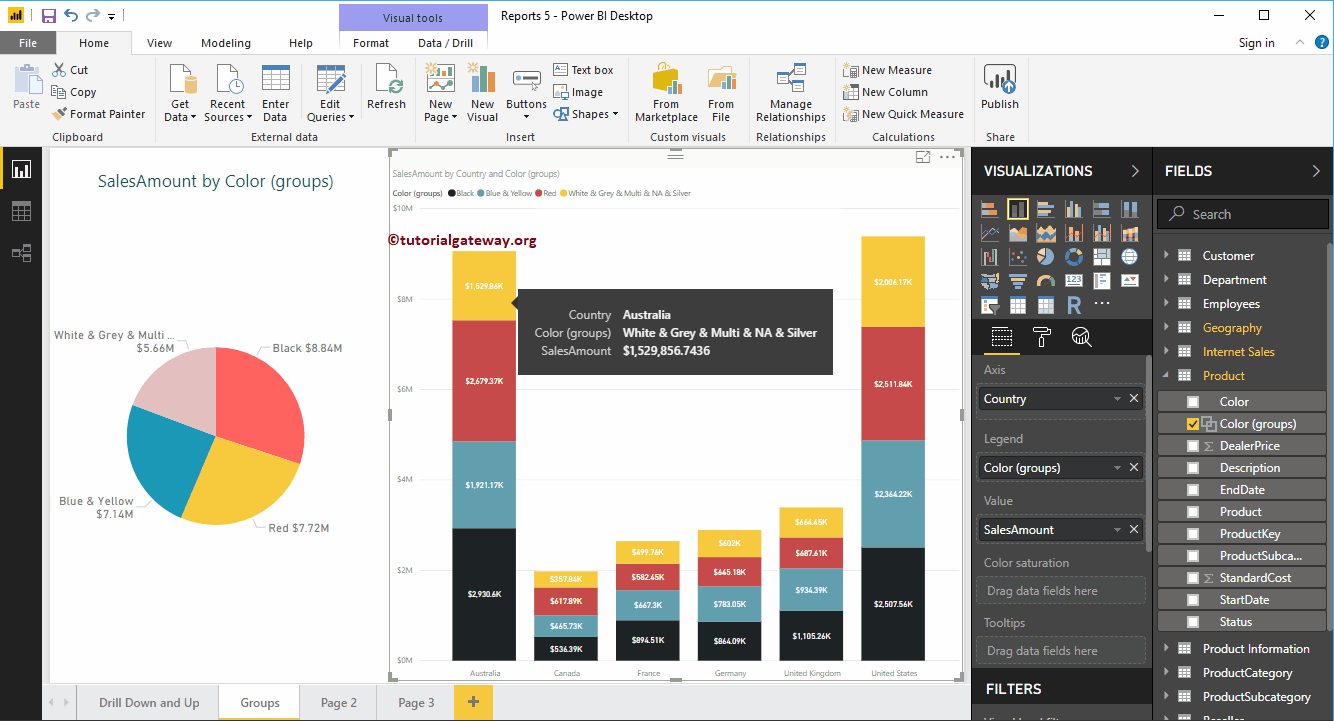
Next, we add the Color group in the legend section.
The second approach to creating groups in Power BI
Select the file you want to use as a group and right-click on it to open the context menu. Select the New Group option from the context menu.

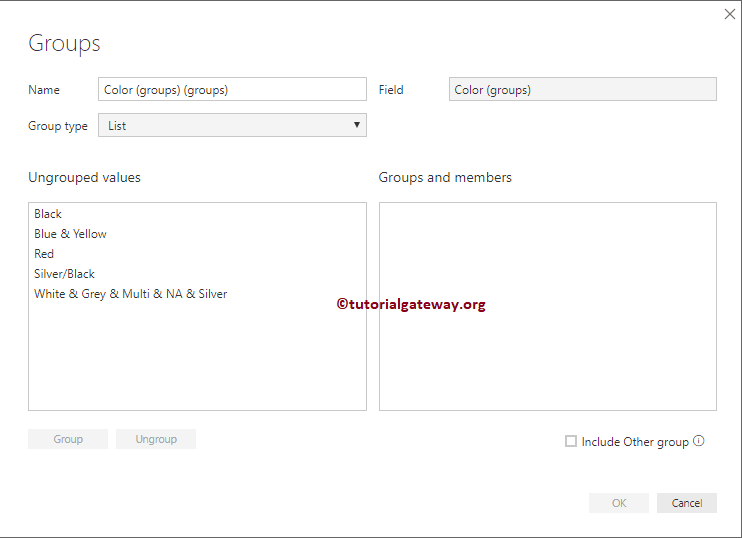
This will open the following window

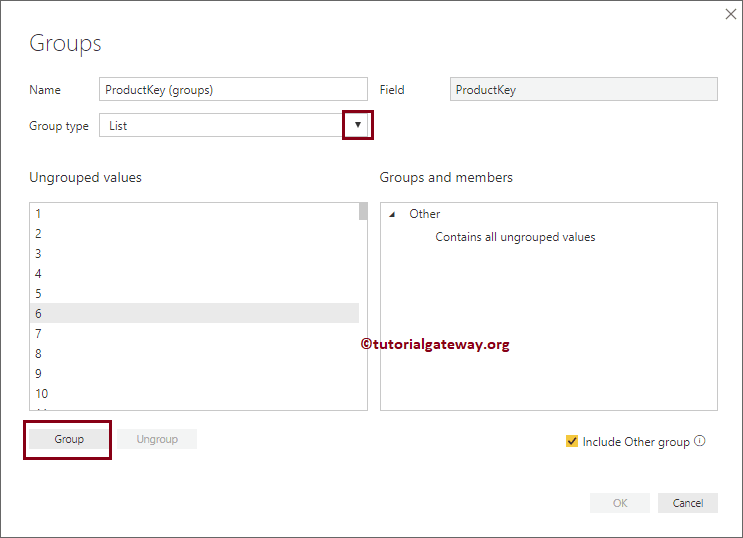
Sometimes Power Bi will open the same window with the different option, as shown in the following screenshot. But don't worry, you can change the group type from Bin to List
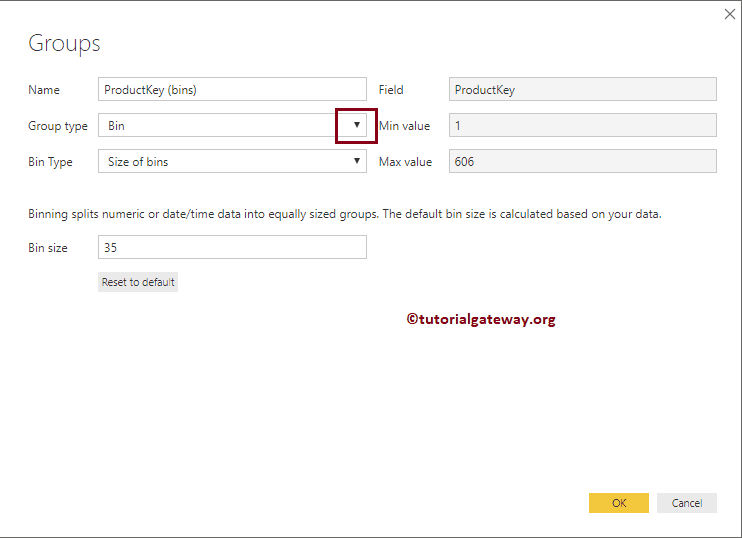
Once you have changed that property, you are good to go