Publish Power BI Desktop reports

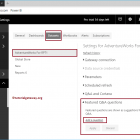
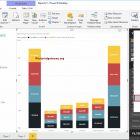
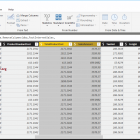
In this article, we show you the step-by-step approach to publishing Power BI desktop reports to the Power BI service with a practical example. Before starting…
R Digital Marketing22/09/2022