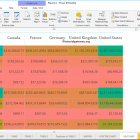
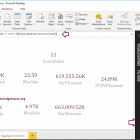
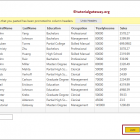
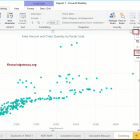
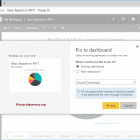
Guides and tutorials

Power BI

Articles so you can learn to master Power BI. We have more than 300 guides and tutorials on the most important business management tool of the moment. In this blog we are going to focus on the most productive facet of the application with dashboards that are for professional, personal and educational use.

pie-chart-in-power-bi-9-9052914-3081282-png
Power BI

Pie chart in Power BI

Pie charts in Power BI are very useful for visualizing high-level data. For example, Sales by continent or region, Orders by country, Customers by region or ...
security-options-5671969-9894678-png
Power BI

Power BI Risk Assessment: External Tools, Connectors, and Community Visuals

Time to read: 4 minutes A large number of quality plugins, created by partners or created by the community is often the sign of a healthy software platform.…
unpivot-table-in-power-bi-3-8488367-4091926-png
Power BI

Override pivot table in Power BI

The Unpivot table option in Power BI converts selected columns to rows. Let's see how to create Unpivot table or how to convert pivot table to Unpivot table ...
heat-map-in-power-bi-12-1015074-4078269-png
Power BI
Heatmap in Power BI
power-bi-dax-aggregate-functions-14-1663614-2780439-png
Power BI
Power BI DAX aggregate functions
fonts-1755736-5060223-png
Power BI
What Power BI sources can help inform viewers with dyslexia?
format-power-bi-ribbon-chart-13-3712456-5905761-png
Power BI
Format the Power BI ribbon chart
register-to-power-bi-service-3-6660190-8242375-png
Power BI
Sign up for the Power BI service
how-to-enter-data-into-power-bi-16-3563197-6680349-png
Power BI
How to enter data in Power BI
power-bi-clusters-2-6935987-2034546-png
Power BI
Power BI clusters
create-a-report-using-excel-data-in-power-bi-workspace-2-4363401-9997405-png
Power BI
Create a report using Excel data in the Power BI workspace
image-2-2897610-4202303-png
Power BI
New financial sample dataset included with Power BI Desktop
create-a-multi-row-card-in-power-bi-8-9174356-7051012-png
Power BI
Create a multi-row card in Power BI
clustered-column-chart-in-power-bi-8-4227633-5241239-png
Power BI
Clustered column chart in Power BI
add-reports-to-power-bi-dashboard-6-8126992-5303898-png
Power BI
Add reports to the Power BI dashboard

What is Power BI?

Power BI is the collective name for a variety of cloud applications and services that help organizations collect, manage, and analyze data from a variety of sources, through an easy-to-use interface. Power BI gathers and processes data into intelligible information, often using visually appealing and easy-to-process charts and tables.

This allows users to generate and share clear and useful snapshots of what is happening in their business. Power BI connects to a variety of data sources, from basic Excel spreadsheets to databases and applications both in the cloud and on our company's servers.

Power BI is a general term and can refer to a Windows desktop application called Power BI Desktop, a software-as-a-service (SaaS) online service called Power BI service, or Power BI mobile apps available on phones and tablets. Windows, as well as for iOS and Android devices.

Power BI is built on Microsoft Excel, and as such the learning curve from Excel to Power BI is not that steep; Anyone who can use Excel can use Power BI, but Power BI is much more powerful than the spreadsheet.

+ Productivity

Best Free Power BI Articles

Surely you are looking to optimize the delivery of information and reporting in your company or enterprise.How many hours have we spent creating spreadsheets and formulas What do we use in our home or office?

With a good dashboard in Power BI you can save hundreds of hours of work. We want to share with you our selection of tutorials and guides for Power BI.