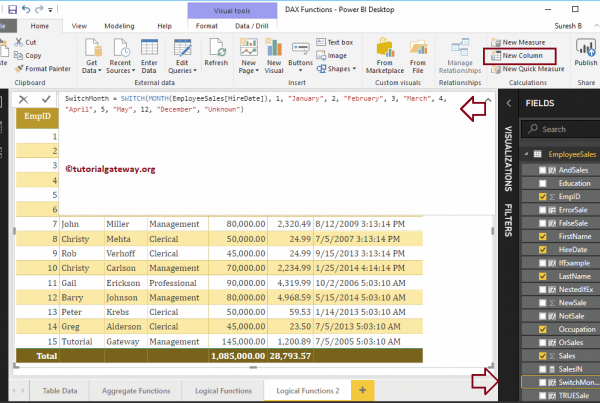
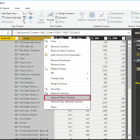
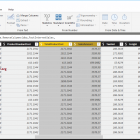
Create calculated columns in Power BI

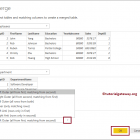
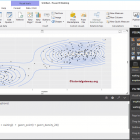
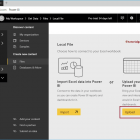
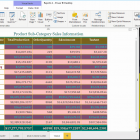
Microsoft Power BI allows you to create custom columns (or calculated columns) from existing columns. In this section, we show you how to create calculated columns in Power BI with example.…
R Digital Marketing11/07/2022