Guides and tutorials

Power BI

Articles so you can learn to master Power BI. We have more than 300 guides and tutorials on the most important business management tool of the moment. In this blog we are going to focus on the most productive facet of the application with dashboards that are for professional, personal and educational use.

add-power-bi-favorites-12-5728693-1326062-png
Power BI

Power BI favorites

Power BI bookmarks are the same as your browser bookmarks. If you find something (report or dashboard) interesting, you can bookmark it in Power BI. With…
format-power-bi-matrix-22-8343714-4714707-png
Power BI

Format Power BI Matrix

How to format the Power BI Matrix report with an example? The Power BI Format Matrix includes changing the colors of the matrix grid, the format ...
joins-in-power-bi-8-4564752-7919670-png
Power BI

Join in Power BI

Power BI supports all the main joins that are available in SQL. Let me show you how to use joins in Power BI to join multiple tables with an example. The following types ...
unpivot-table-in-power-bi-3-8488367-4091926-png
Power BI
Override pivot table in Power BI
register-to-power-bi-service-3-6660190-8242375-png
Power BI
Sign up for the Power BI service
add-web-content-to-power-bi-dashboard-3-7023423-8002113-png
Power BI
How to add web content to the Power BI dashboard
power-bi-dashboard-introduction-4-8958902-5433827-png
Power BI
Get started with the Power BI dashboard
create-calculated-measures-in-power-bi-3-8168034-7945860-png
Power BI
How to calculate measures in Power BI
create-a-custom-column-in-power-bi-3-8188169-7101847-png
Power BI
Create a custom column in Power BI
connect-power-bi-desktop-with-power-bi-service-1-6202448-4622373-png
Power BI
Connect Power BI Desktop to the Power BI service
power-bi-advanced-filters-8-9668999-1403250-png
Power BI
Advanced Power BI filters
pivot-table-in-power-bi-5-9839396-2720701-png
Power BI
Power BI pivot table
power-bi-dax-logical-functions-20-3353902-5445268-png
Power BI
Logical functions of Power BI DAX
create-100-stacked-column-chart-in-power-bi-10-3791898-9210577-png
Power BI
Create stacked 100% column chart in Power BI
format-power-bi-ribbon-chart-13-3712456-5905761-png
Power BI
Format the Power BI ribbon chart

What is Power BI?

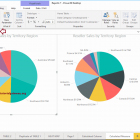
Power BI is the collective name for a variety of cloud applications and services that help organizations collect, manage, and analyze data from a variety of sources, through an easy-to-use interface. Power BI gathers and processes data into intelligible information, often using visually appealing and easy-to-process charts and tables.

This allows users to generate and share clear and useful snapshots of what is happening in their business. Power BI connects to a variety of data sources, from basic Excel spreadsheets to databases and applications both in the cloud and on our company's servers.

Power BI is a general term and can refer to a Windows desktop application called Power BI Desktop, a software-as-a-service (SaaS) online service called Power BI service, or Power BI mobile apps available on phones and tablets. Windows, as well as for iOS and Android devices.

Power BI is built on Microsoft Excel, and as such the learning curve from Excel to Power BI is not that steep; Anyone who can use Excel can use Power BI, but Power BI is much more powerful than the spreadsheet.

+ Productivity

Best Free Power BI Articles

Surely you are looking to optimize the delivery of information and reporting in your company or enterprise.How many hours have we spent creating spreadsheets and formulas What do we use in our home or office?

With a good dashboard in Power BI you can save hundreds of hours of work. We want to share with you our selection of tutorials and guides for Power BI.