
Time to read: 5 minutes
The July 2020 release of Power BI Desktop includes a new preview feature that allows you to «external tools”To more easily connect to Power BI models. Before July, external tools could connect to an open tabular model. With the new External Tools tab on the ribbon, as well as Power BI passing the connection information as an argument to the tool, it's a much more convenient experience.
There are three prominent community tools to get you started: DAX Studio, ALM Toolkit, and Tabular Editor. However, one of the great things about this new feature is that you can define your own external tools in JSON and pass the currently open Power BI model connection to your tool with a simple click.
Why python?
¿Por qué utilizar python como una «herramienta» externa? Aunque python no es una «herramienta» en el mismo sentido que las «3 grandes» herramientas de la comunidad enfocadas este mes, quiero mostrar cuán versátil es la función de herramientas externas. También quiero alentar a las persons a usar la imaginación y también explorar cómo Power BI no es realmente tan cerrado como algunas personas piensan, al menos el modelo de datos …
Some of these ideas are not unique to python, but there is enough variety in the Power BI and data science communities for people to find out if any of this could be useful within the context of their own environments, skills, and organizations.
Sample idea: code your own Power BI model documentation
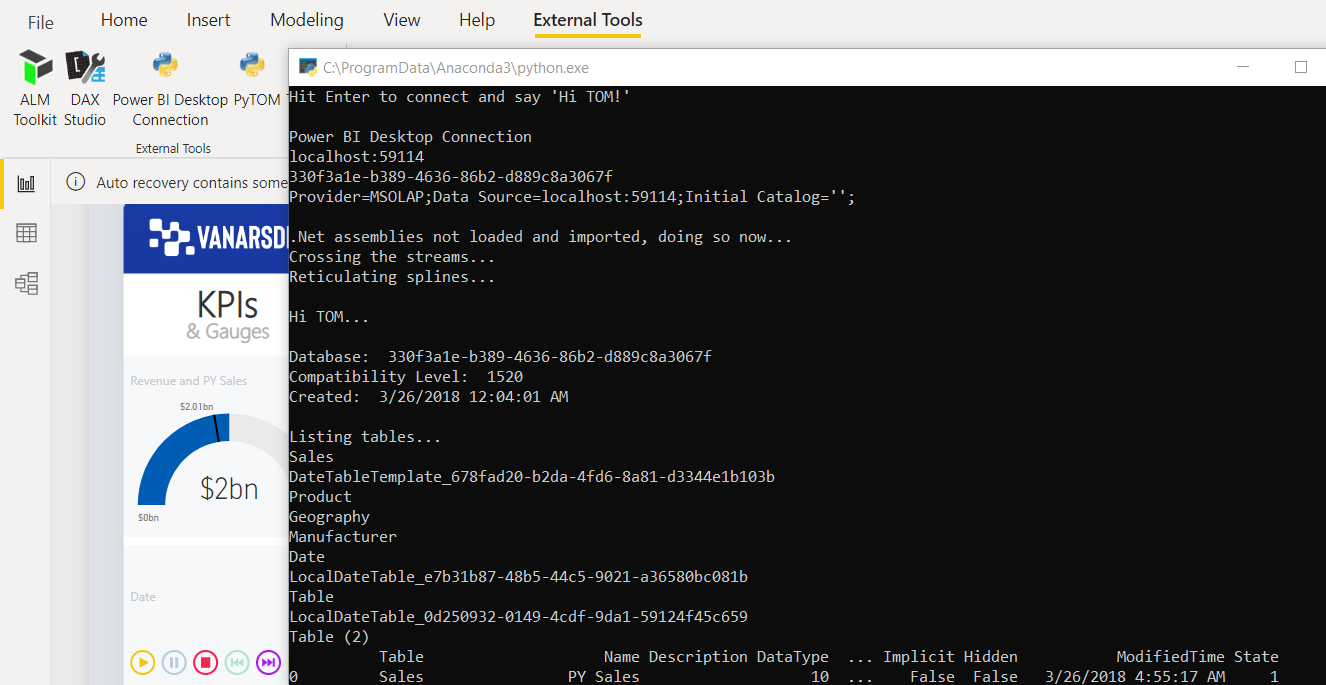
What if there was a way to connect to a Power BI model from python and use a python container for it Tabular object model (TOM) .NET library? Maybe to import the model information to pandas DataFrames to help you create your own one-click model documentation? (There are already many ways to document a model; add your own python code to the list)
 <>
<>
Sample idea: export as much data as your local memory allows
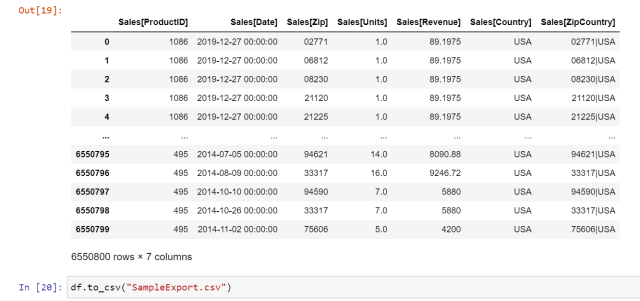
Power BI Desktop allows you to export 30,000 records to CSV from a visual. You can get more if you copy the table manually from data view, but it is quite limited. If you want more, you would have previously had to use DAX Studio or Power BI Report Builder. Add python to that list.
Tenga en cuenta que exportar desde DAX Studio es más rápido si simplemente desea exportar. En situaciones en las que es posible que no siempre tenga acceso a DAX Studio o python be su herramienta de elección y prefiera obtener datos directamente de un modelo en un DataFrame de pandas y evitar los pasos de importación y exportación manuales intermedios, es una opción. ¿Sin embargo, 6 millones de registros? Juego de niños … Sin embargo, por motivos de rendimiento y para no afectar los recursos de su organización en el servicio Power BI, evite exportar esta cantidad de datos con el punto final XMLA en Power BI Premium: siga este escenario utilizando Power BI Desktop en su estación de trabajo local.
Por cierto, el otro día me burlé de un tweet sobre las capacidades de exportación desde Desktop y me sorprendió la variedad de respuestas. Muchas de las respuestas no se centraron directamente en la pregunta explícita sobre Desk (Focused on the limitations of the service and not the desktop, promoted external tools, etc.), but thanks to all who responded.

Sample idea: Visualize Power BI data with interactive python libraries
Una de las principales limitaciones del uso de objetos visuales de python en un informe de Power BI es que el objeto visual debe mostrar una imagen estática. Eso es lo suficientemente bueno para algunos escenarios, pero he respondido muchas preguntas sobre la extensión de python + Power BI (e incluso organicé un seminario Web de BlueGranite sobre el tema incluido a continuación). En general, suele ser ideal para escenarios individuales o de equipo. La imagen estática, el rendimiento y la incapacidad de controlar las bibliotecas instaladas por Microsoft una vez implementadas en el servicio Power BI a menudo limitan su uso a escala.
Aquí está el seminario web original de Power BI + python que muestra las capacidades actuales para usar elementos visuales de python en informes de Power BI (+ suscríbase al channel from Youtube de BlueGranite colocando el cursor sobre el Logo en la parte superior izquierda y presionando el botón rojo Suscribirse):
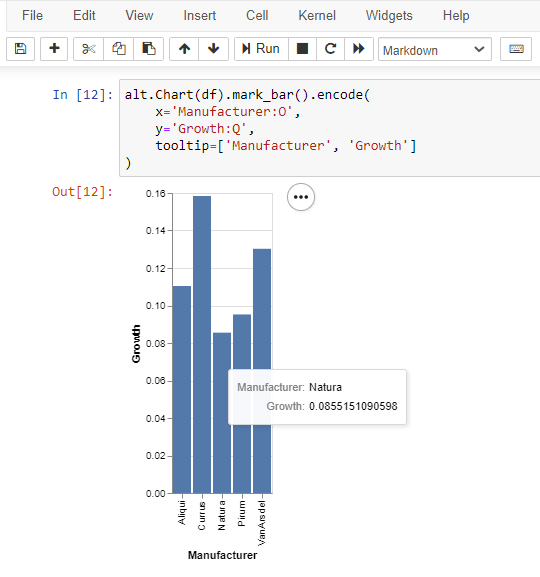
By connecting to the Power BI model and running a DAX query to load a pandas DataFrame, you can also use interactive python display libraries like Plotly or Altair in your IDE of choice. You're not limited to exporting your visual as a still image and embedding it in a Power BI report (although you obviously still can and should when the circumstances are right).
For example, here is a full code solution that displays Power BI data visualized with Altair (note the hover tooltip that you wouldn't get in a Power BI report). You can avoid having to manually export your Power BI data first before entering it into the DataFrame.
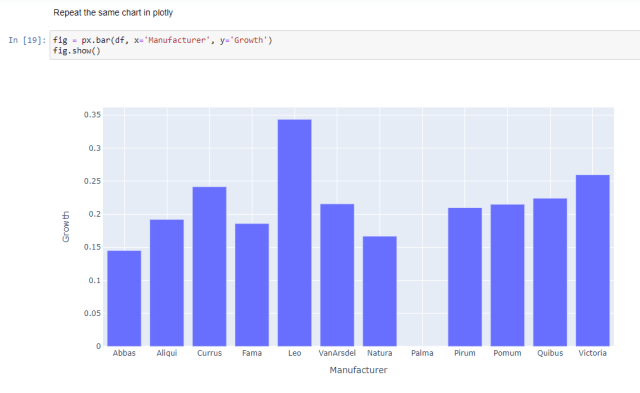
The same advantage is valid with Plotly or any other visualization library. Perhaps you display Power BI data in a Dash app and code your data integration instead of relying on a manual export.
Sample idea: combine data from Power BI model with another data source in python
Aunque Power BI tiene Power Query para combinar datos de diferentes orígenes, ¿qué pasa si Power BI * es * uno de los orígenes de datos? Por ejemplo, hay escenarios en los que Power Query no se ocupará de todo. Quizás desee fusionar datos de Power BI con otro DataFrame en python que contenga datos geográficos y exportar los resultados como un archivo geojson (para usar en el nuevo Power BI Azure Maps visual, Of course!). Power BI couldn't build that geojson, but python could. NOTE: I don't have a screenshot for this scenario yet because it's still just an idea.
Coming soon in Part 2: Create an external python tool for the Power BI ribbon
Throughout a series of upcoming posts, I'll show you how to get started with scenarios like this using python with Power BI models. In Part 2, I explain how to create an external tool pbitool.json to pass arguments to python and run a sample python script. Future posts after Part 2 will focus on more of the advanced scenarios described above, such as accessing TOM and executing DAX queries from a python script or Jupyter notebook.


