

In a previous post, I introduced some possible uses of python as an external tool for Power BI Desktop and went through the main configuration. This post expands on the basic setup of the external tool found in Part 2.
There are two goals for this post:
1) Show how to run a python script within a virtual environment
2) Connect to a .NET library called Tabular Object Model (TOM) to get data on a currently open Power BI Desktop data model
Modify [tool] .pbitool.json to run in a python environment
Part 2 showed how to run python.exe and run a .py script, but it didn't run in an environment. This limitation allows basic scripts, but more complex scripts use code from other modules and packages.
To extend the basic example found in Part 2, I created a sample [tool] File .pbitool.json (essence) which shows how to run a python script in a given environment.
Base environment (root)
I am using Anaconda, which has a base C environment location: ProgramData Anaconda3.
{
  "version": "1.0",
  "name": "PyTOM",
  "description": "Use python with Tabular Object Model",
  "path": "C:ProgramDataAnaconda3python.exe",
  "arguments": "C:/ProgramData/Anaconda3/cwp.py C:/ProgramData/Anaconda3 C:ProgramDataAnaconda3python.exe C:/[PATH TO PYTHON SCRIPT].py "%server%" "%database%"",
  "iconData": ""
}
Note that you don't need to change anything from the Part 2 example, except for adding some arguments before the main python script, server, and database values. This took me some time to work with a lot trial and error, so pay attention!
What changes?
- The nucleus way it's still your python.exe
- Instead of executing the desired script first, the arguments define cwp.py first, then the location of your surroundings, then other python.exe (I tried many variations but never got it to work properly without this structure).
- After that sequence, the arguments continue with your main script and external Power BI tools references for the server and the database.
Named virtual environment
For a virtual environment other than the base, you need to modify the arguments to use the correct environment. This ensures that the correct packages that are part of that environment are available to use with your Power BI script.
Here is an example of a conda environment called PowerBI. Note that the location of python.exe does not to have switch to the conda environment (although you could), but changing the environment part of the argument is critical.
{
  "version": "1.0",
  "name": "PyTOM",
  "description": "Use python with Tabular Object Model",
  "path": "C:ProgramDataAnaconda3python.exe",
  "arguments": "C:/ProgramData/Anaconda3/cwp.py  C:/Users/DavidEldersveld/.conda/envs/PowerBI C:ProgramDataAnaconda3python.exe C:/[PATH TO PYTHON SCRIPT].py "%server%" "%database%"",
  "iconData": ""
}
Connect to TOM
the Tabular object model The (TOM) Library for .NET opens the Power BI data model to external tools. Two pieces are required to allow python to interact with .NET:
1) Pythonnet package for .NET CLR (pip install pythonnet)
2) python-SSAS module (ssas_api.py located in the same folder as the main script you want to run)
the python-ssas (ssas_api.py) The python module that facilitates the TOM connection is all the work of Josh Dimarsky, originally for querying and processing Analysis Services. I just repurposed it for use with Power BI Desktop or the XMLA endpoint in Power BI Premium and extended it with some relevant examples. It's all based on Josh's python module, which has functions to connect to TOM, run DAX queries, etc.
This particular module is just one possible way to use .NET CLR with python. For example, you can try alternatives like .NetBridge to run the pyDotNet Package and code your own solution to access the TOM DLL. I have not made an inventory of the different methods available to know which is the best or the most efficient. However, the ssas_api.py module worked directly for what I needed, so I stuck with it.
As long as Power BI Desktop is installed, you shouldn't have to manually obtain the required DLLs. You could get them from Microsoft directly although if necessary.
Josh's code in ssas_api.py loads Microsoft.AnalysisServices.Tabular.dll and Microsoft.AnalysisServices.AdomdClient.dll from the GAC.
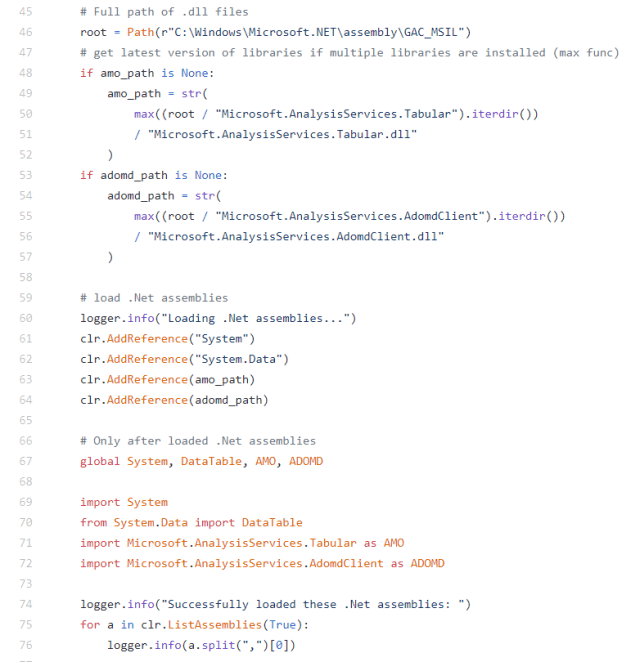
Get TOM Power BI model metadata
With the various prerequisites in place, you can code against TOM. The full code is at the end of this post and this essence, but the main elements in the first 32 lines:
1) import the ssas_api.py module
2) define a connection to the Power BI Desktop model using the server argument passed when clicking the icon in External Tools (conn = "Provider = MSOLAP; Data source =" + str (sys.argv [1]) + "; Initial catalog ="; ")
3) define a "dummy" DAX query to help load .NET (dax_string = 'EVALUATE ROW ("Loading .NET assemblies", 1)'
4) run the DAX query (df = powerbi.get_DAX (connection_string = conn, dax_string = dax_string)
5) complete TOM and AMOMD imports for python once they load and connect to TOM
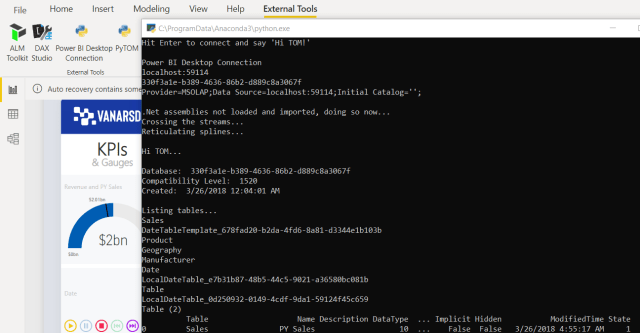
global System, DataTable, AMO, ADOMD import System from System.Data import DataTable import Microsoft.AnalysisServices.Tabular as TOM import Microsoft.AnalysisServices.AdomdClient as ADOMD TOMServer = TOM.Server () TOMServer.Connect (conn) Once connected to the model, the rest of my sample python script shows how to load various objects from the model metadata into pandas DataFrames. It is only intended to be a sample to illustrate what might be possible, but could be expanded to document all available metadata if desired.
Coming soon in part 4: using Jupyter and running DAX
In Part 4, you will see how to create a Jupyter notebook with the available Power BI connection information.
You may have also noticed get_DAX function previously used to help load required .NET assemblies. However, it is much more powerful than what is shown here. You can evaluate any DAX query that you want to manually type, copy and paste outside of Power BI Desktop Performance analyzeror copy and paste from DAX study.
As seen in Part 1, the benefits and imaginative scenarios of using python with Power BI start to increase with the ability to run DAX from python.
************************************************ **********************
FULL CODE for PowerBITOMSample.py
import sys import ssas_api as powerbi import pandas as pd print ("Hit Enter to connect and say 'Hi TOM!'") input () print ('Power BI Desktop Connection') print (str (sys.argv [1])) print (str (sys.argv [2])) conn = "Provider = MSOLAP; Data Source =" + str (sys.argv [1]) + "; Initial Catalog = '';" print (conn) print () dax_string = 'EVALUATE ROW ("Loading .NET assemblies", 1)' df = powerbi.get_DAX (connection_string = conn, dax_string = dax_string) print ("Crossing the streams ...") global System , DataTable, AMO, ADOMD import System from System.Data import DataTable import Microsoft.AnalysisServices.Tabular as TOM import Microsoft.AnalysisServices.AdomdClient as ADOMD print ("Reticulating splines ...") print () TOMServer = TOM.Server () TOMServer.Connect (conn) print ("Hi TOM ...") print () # Database info for item in TOMServer.Databases: print ("Database:", item.Name) print ("Compatibility Level:", item. CompatibilityLevel) print ("Created:", item.CreatedTimestamp) DatabaseId = str (sys.argv [2]) PowerBIDatabase = TOMServer.Databases [DatabaseId] print () # Define measure dataframe dfMeasures = pd.DataFrame (columns = ['Table ',' Name ',' Description ',' DataType ',' DataCategory ',' Expression ',' FormatString ',' DisplayFolder ',' Implicit ',' Hidden ',' ModifiedTime ',' State ']) # Define column data frame dfColumns = pd.DataFrame (columns = ['Table', 'Name']) # Tables print ("Listing tables ...") for table in PowerBIDatabase.Model.Tables: print (table.Name) # Assign current table by name CurrentTable = PowerBIDatabase.Model.Tables.Find (table.Name) # print (type (CurrentTable)) # print (type (CurrentTable.Measures)) # Measures for measure in CurrentTable.Measures: new_row = {'Table': table.Name, 'Name': measure.Name, 'Description': measure.Description, 'DataType': measure.DataType, 'DataCategory': measure.DataCategory, 'Expression': measure.Expression, 'FormatString': measure. FormatString, 'DisplayFolder': measure.DisplayFolder, 'Implicit': measure.IsSimpleMeasure, 'Hidden': measure.IsHidden, 'ModifiedTime': measure.ModifiedTime, 'State': measure.State} #print (new_row) dfMeasures = dfMeasures. append (new_row, ignore_index = True) # Columns for column in CurrentTable.Columns: new_row = {'Table': table.Name, 'Name': column.Name} #print (column.Name) dfColumns = dfColumns.append ( new_row, ignore_index = True) print (dfMeasures) print (dfColumns) input () Payment links
As an Amazon Associate, I earn on qualifying purchases.


