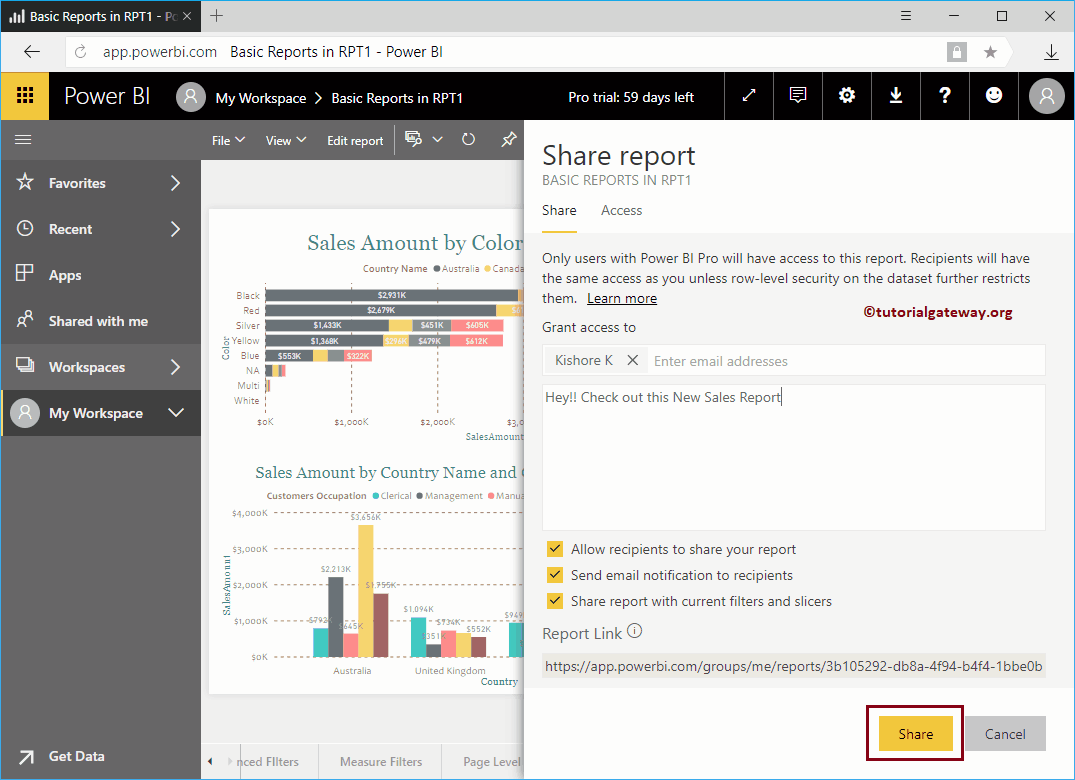
In this article, we show you the step-by-step approach to share a report in Power BI across your organization with a practical example. Before starting to share ...
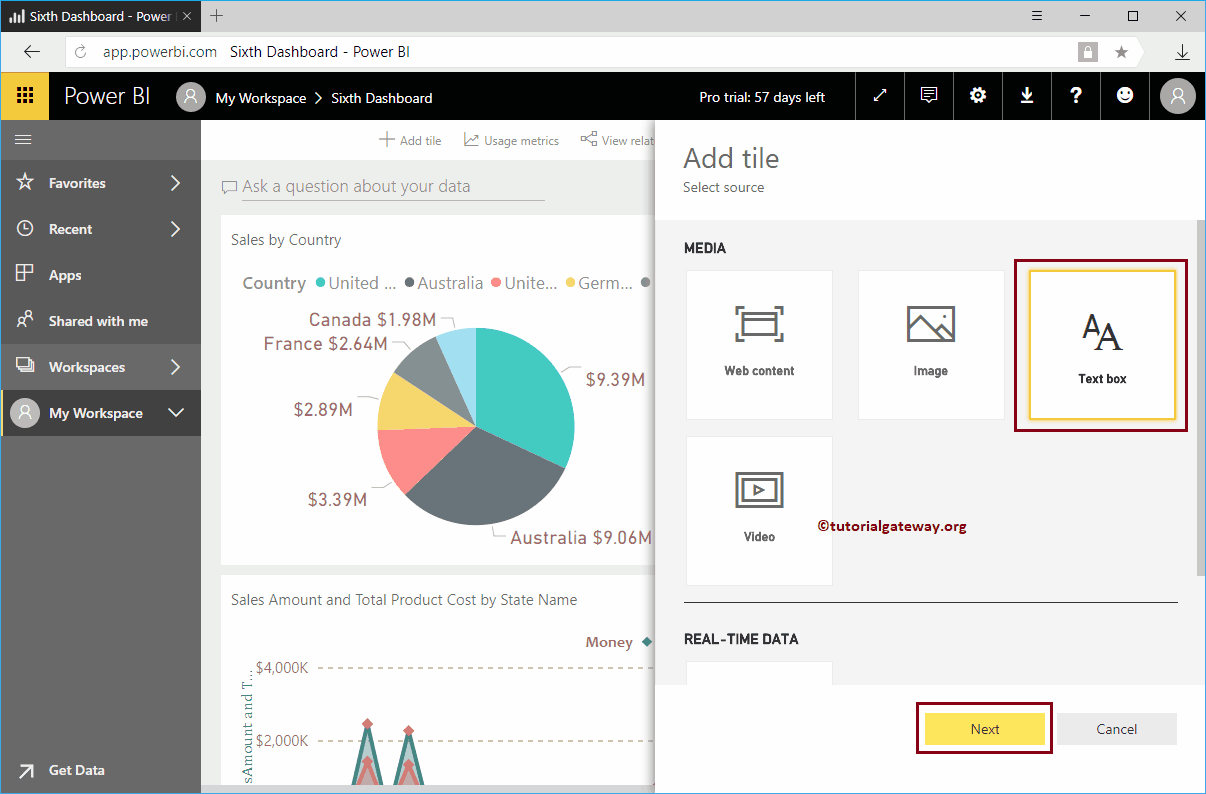
How to add a title to the Power BI dashboard with an example? For this demo of Add Title to Power BI Dashboard, we'll be using the sixth dashboard. How to add a ...
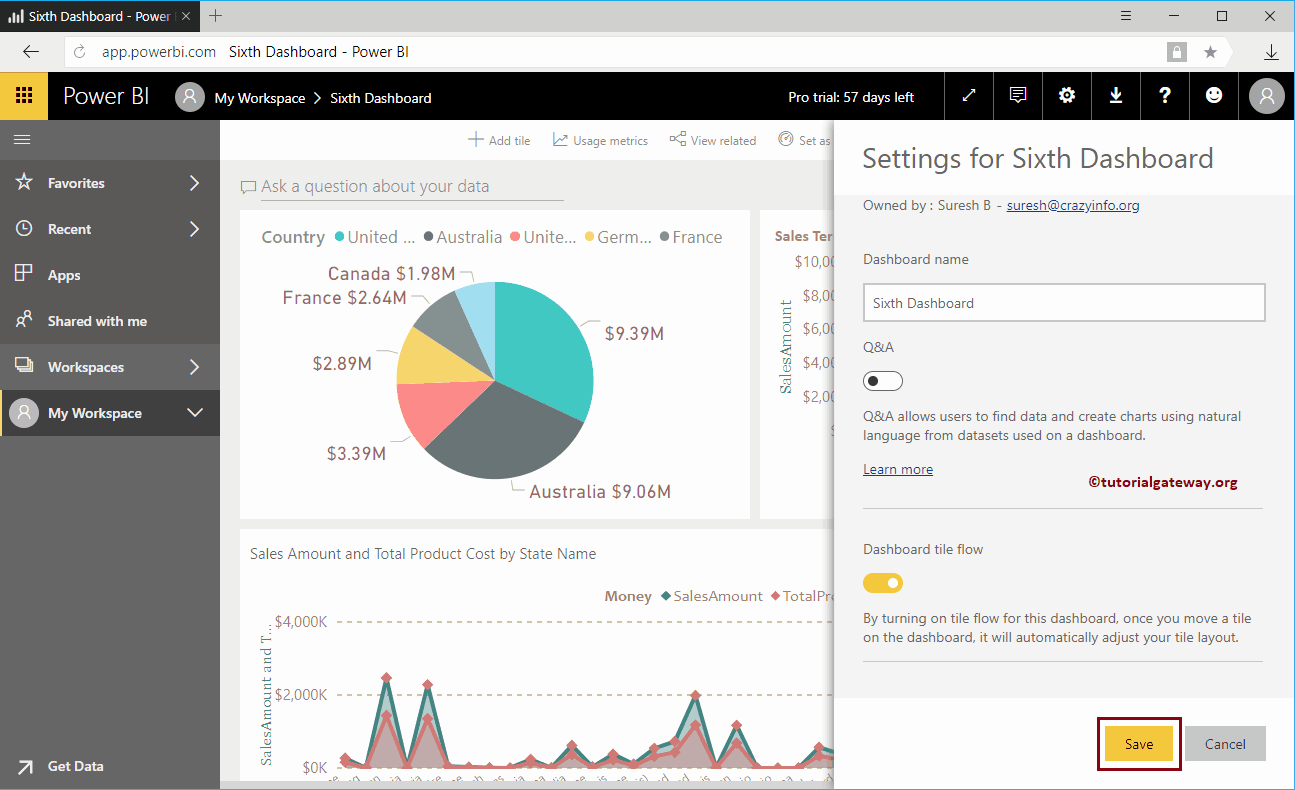
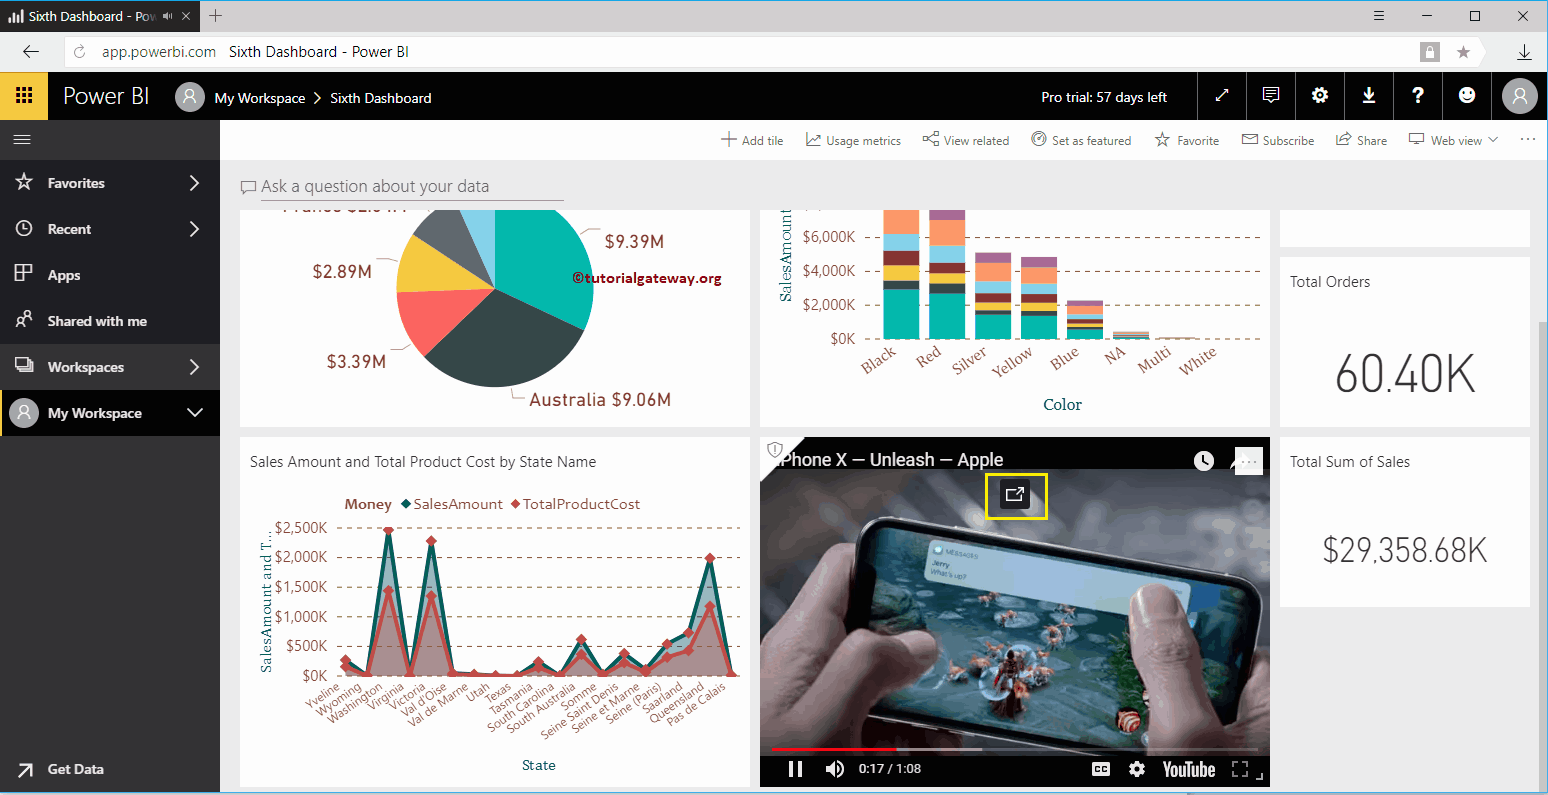
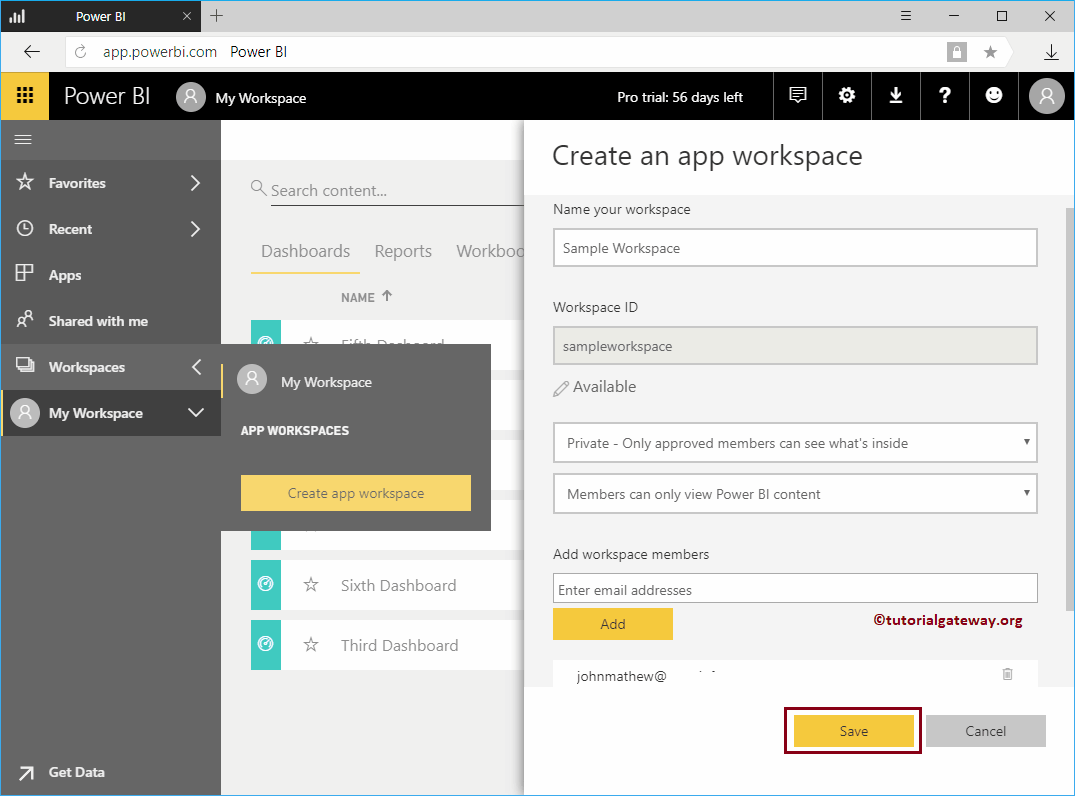
In this article, we show you the list of Power BI dashboard settings that are available to you. For this demonstration, we will use the Sixth Panel available in my area ...
How to add video to Power BI dashboard with a practical example? For this Add Video to Power BI Dashboard demo, we're going to embed a YouTube video ...
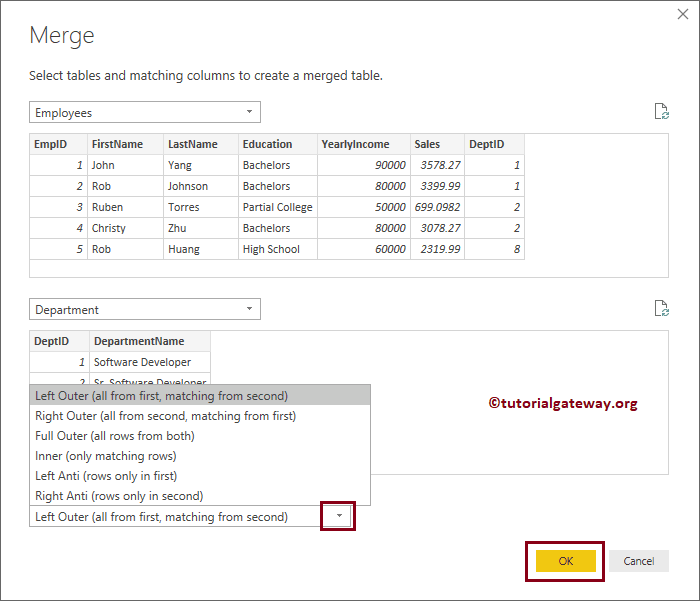
Power BI supports all the main joins that are available in SQL. Let me show you how to use joins in Power BI to join multiple tables with an example. The following types ...
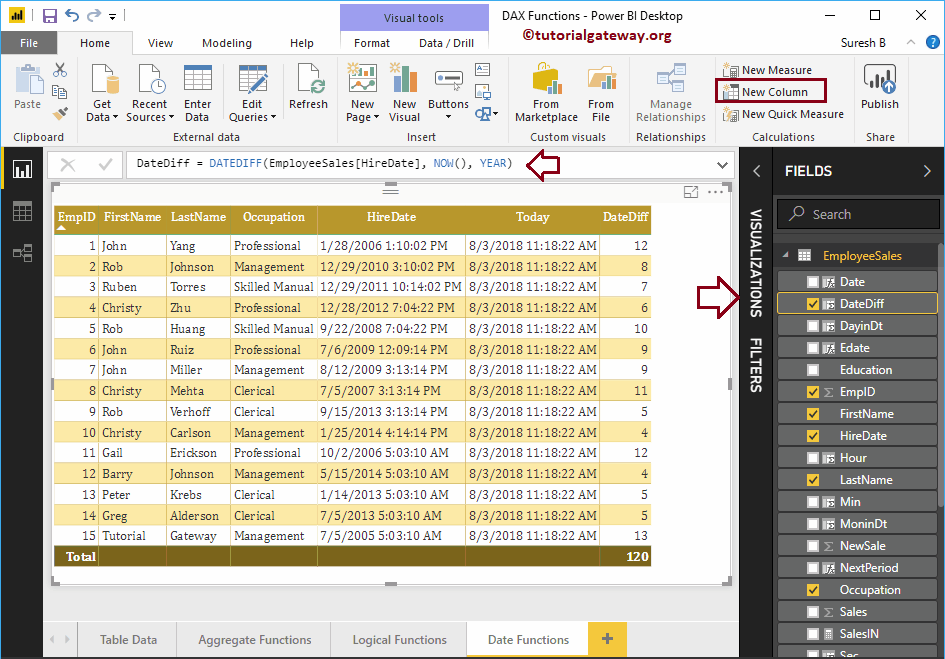
How to use Power BI DAX date functions with examples? Microsoft Power BI DAX provides various date functions, such as year, month, day, calendar, date, time, dateiff, now, ...
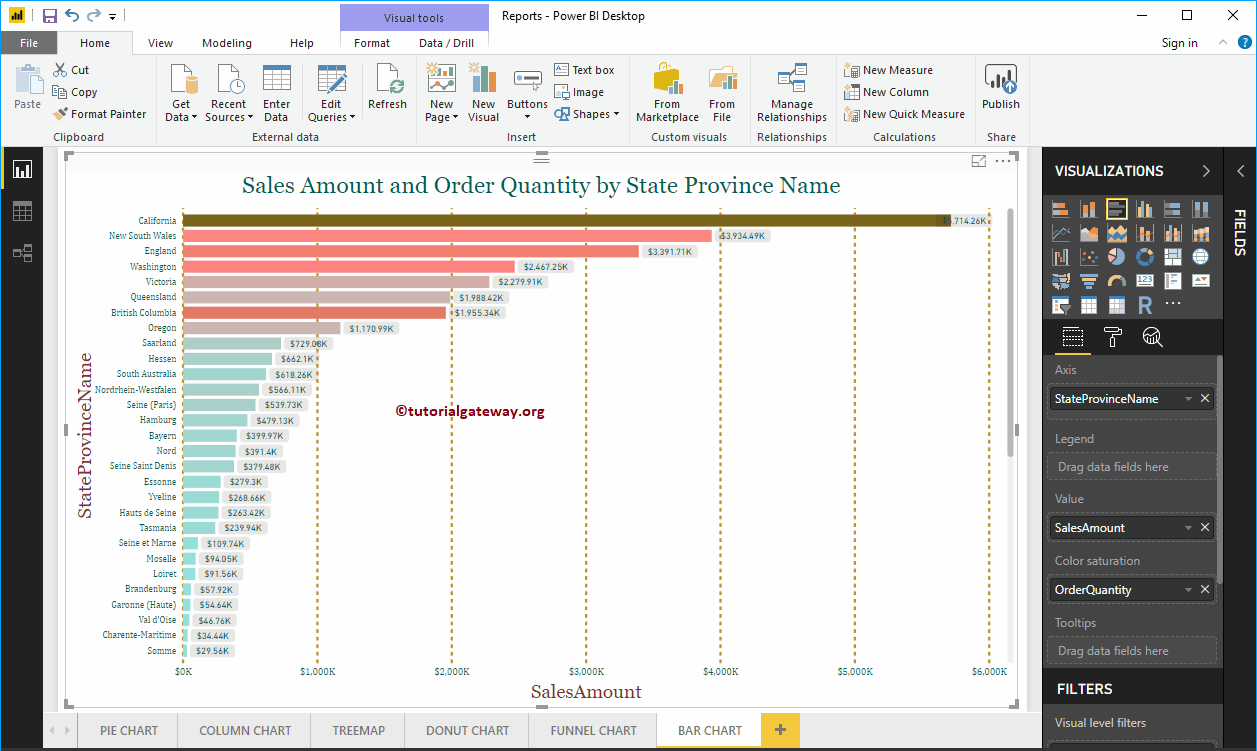
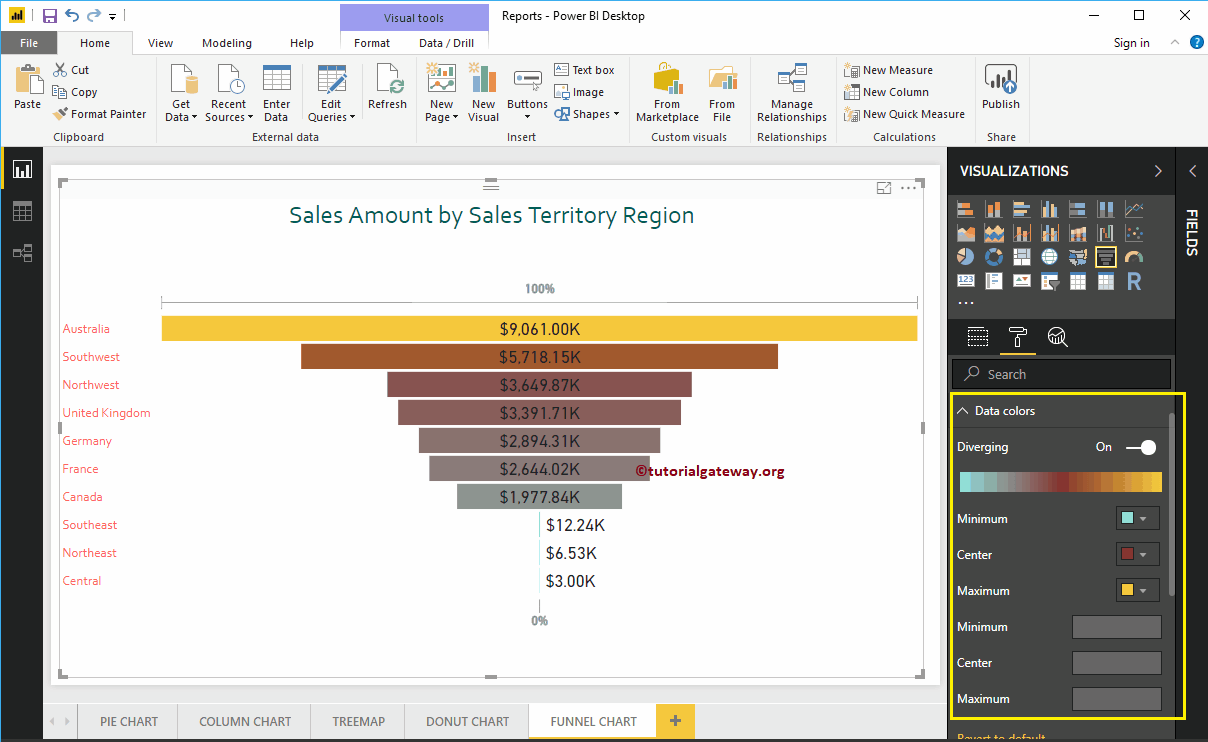
How to format the funnel chart in Power BI with an example? Formatting the funnel chart in Power BI includes changing the title of the funnel chart, ...