How to add data bars to table in Power BI with an example? Adding data bars to a Power BI table report is one of the common scenarios that you will face in real time.
To demonstrate how to add data bars to the table in Power BI, we will use the table we created earlier. See the article Create a table in Power BI to understand the steps required to create a Power BI table.
How to add data bars to the table in Power BI
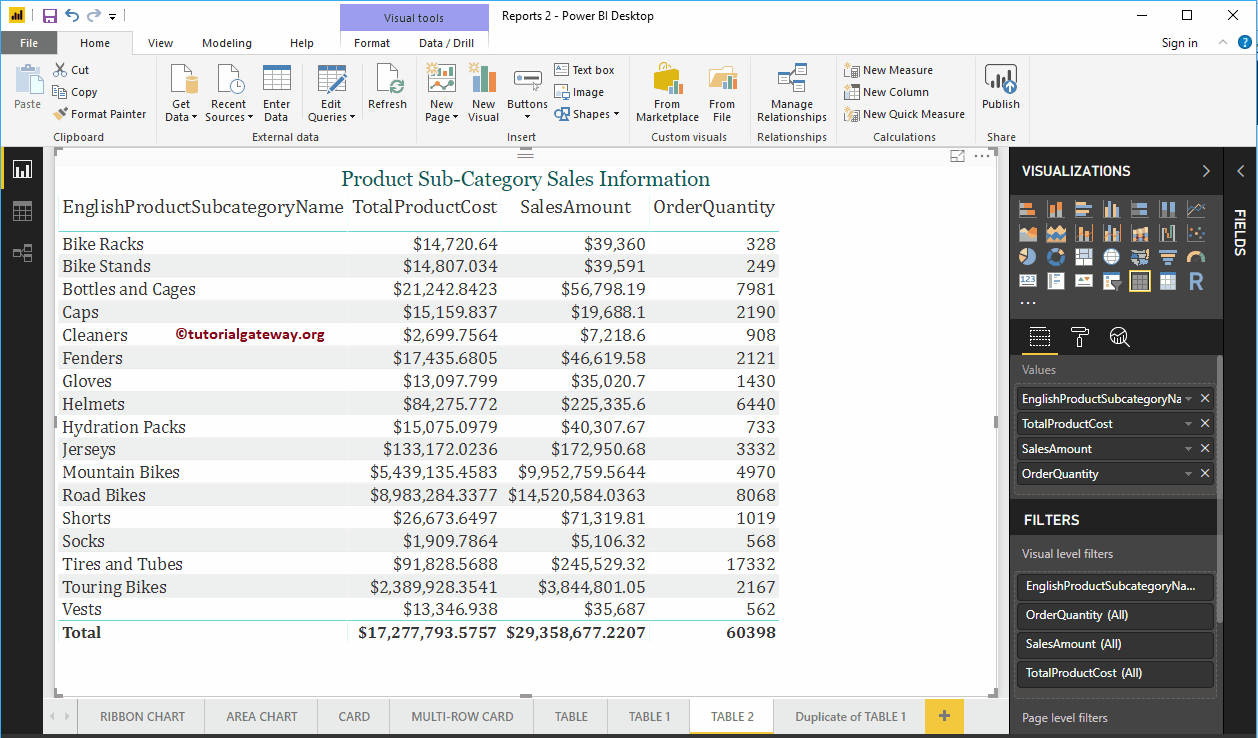
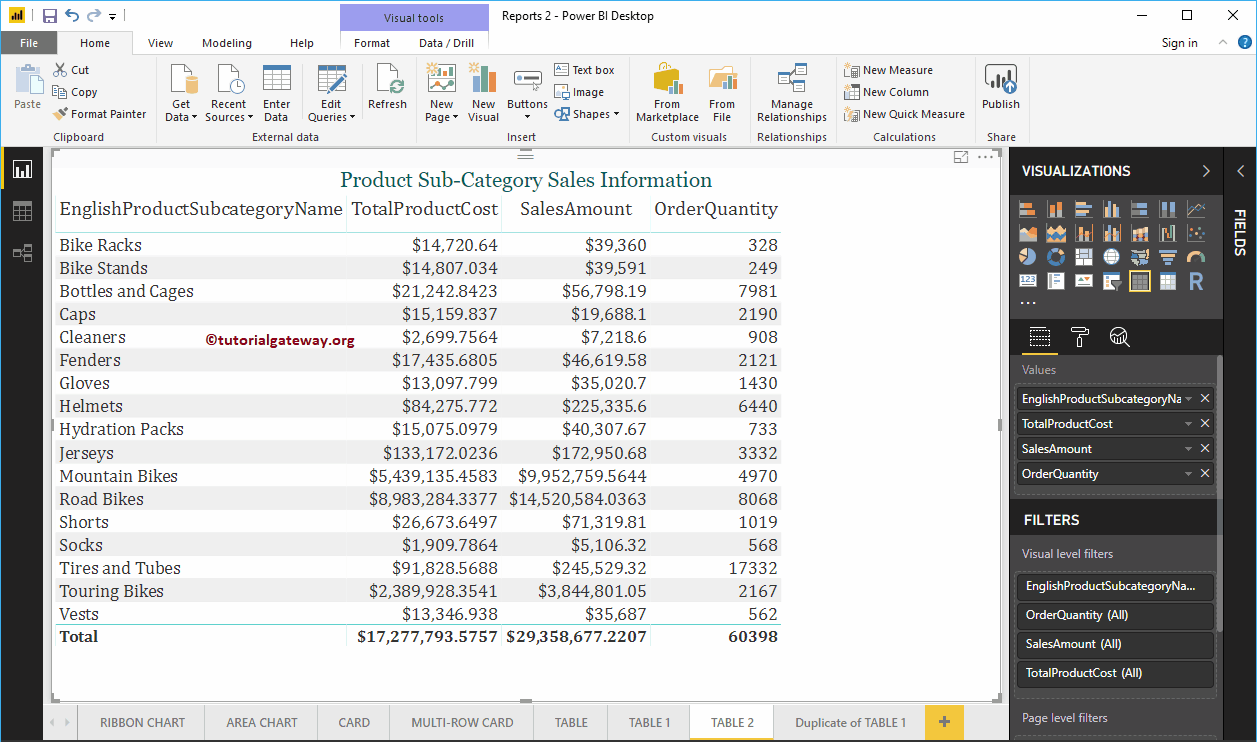
Before we start adding the data bars to the Power BI table report, let me show you the data (columns) we used to create this table. As you can see in the following screenshot, we added the English product subcategory name, total product cost, sales amount, and order quantity to the values section to create this table.
First approach to add data bars to table in Power BI
In this example, we use the Power Bi conditional formatting option available in Desktop.
Select the Column Name (metric value) in / for which you want to apply data bars. In this example, we use the Order Quantity column to add data bars.
First, click the down arrow next to the Order Quantity column under Values section opens the context menu. Select conditional formatting and then select Data bars, as it's shown in the following.
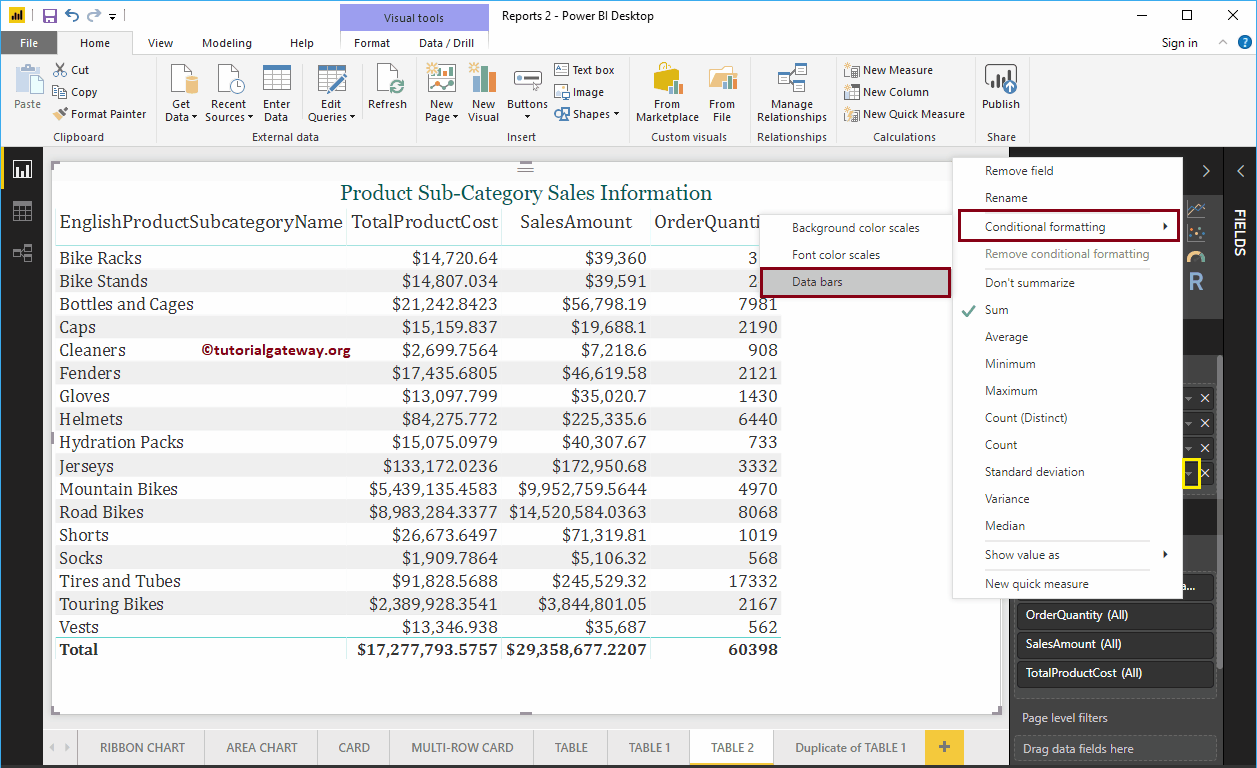
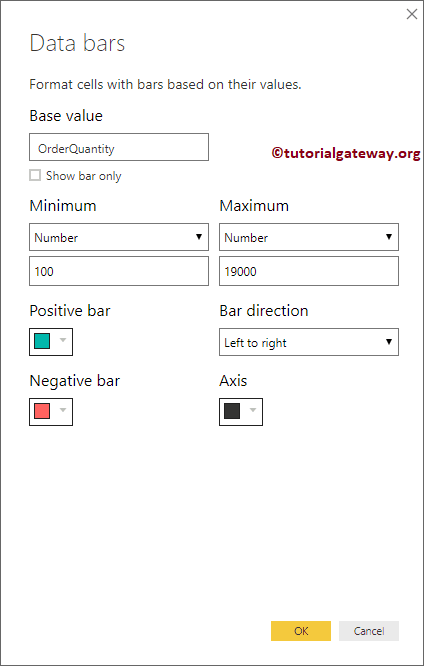
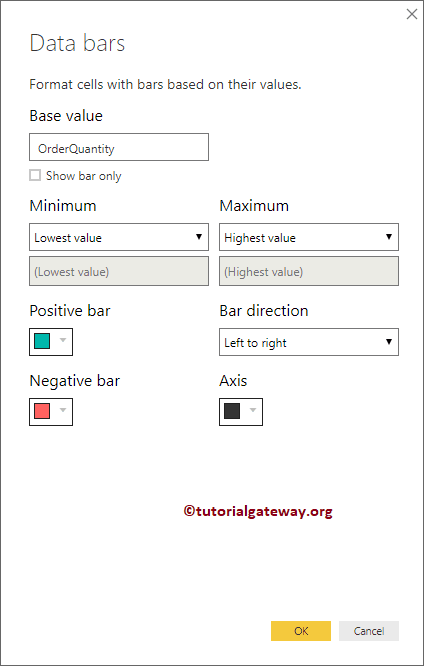
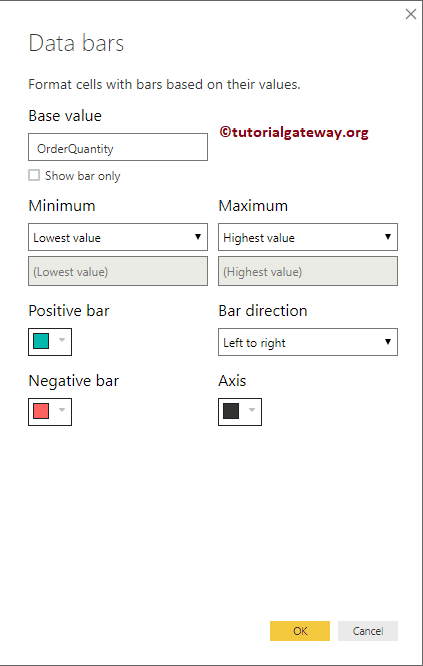
To select Data bars open the following window.
- Base value: Column you selected
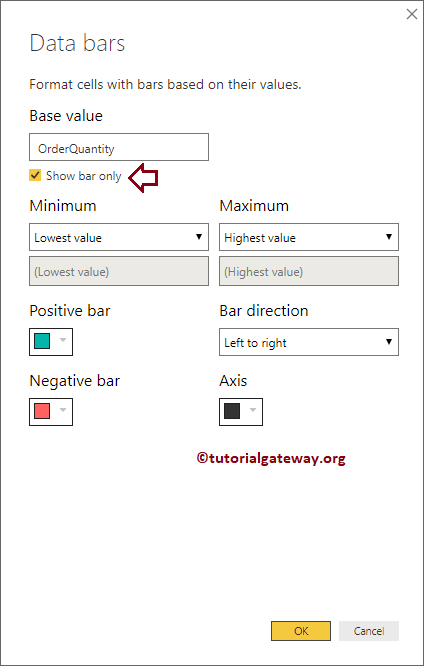
- Show only bar: If you check this option, only data bars will be displayed for each row; otherwise, both the value and the data bar will be displayed.
- Minimum: By default, select the minimum value (minimum order quantity). Use the drop-down menu to change the minimum to number and assign the minimum value within the lowest value text box.
- Maximum: By default, select the maximum value (Maximum Order Quantity). Use the drop-down menu to change the Maximum to Number and assign the Maximum value within the Text box of the highest value.
- Positive bar: Select the color of a positive bar.
- Negative bar: Select the color of a negative bar.
- Bar direction: Change the direction of the data bar from left to right or from right to left.
- Axis: Change the color of the data bar axis
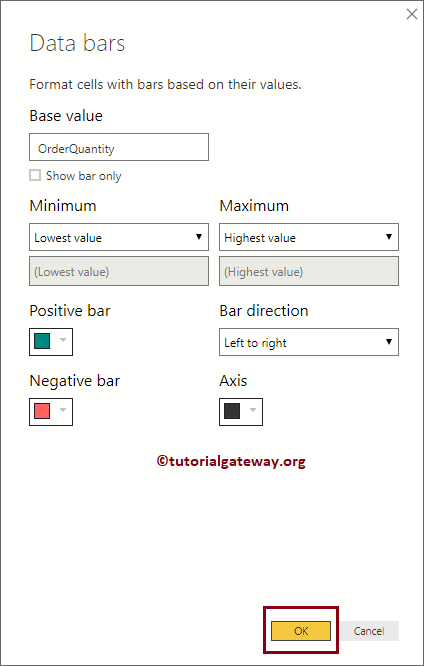
For now, we keep the default settings.
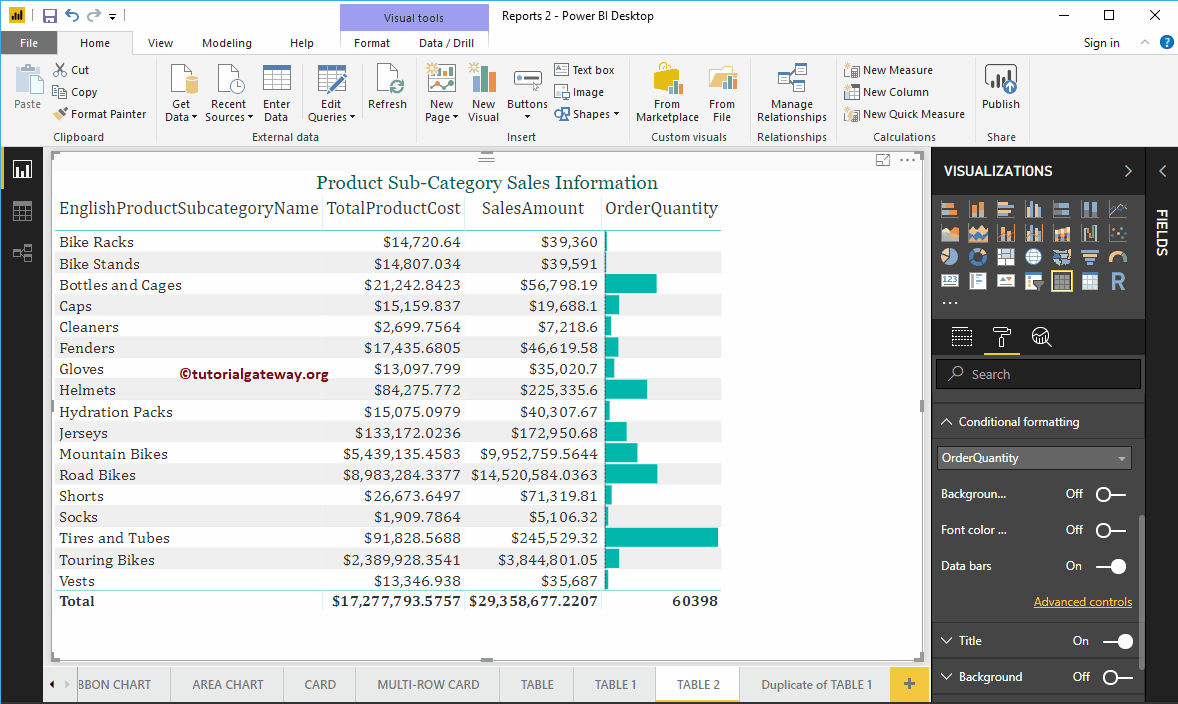
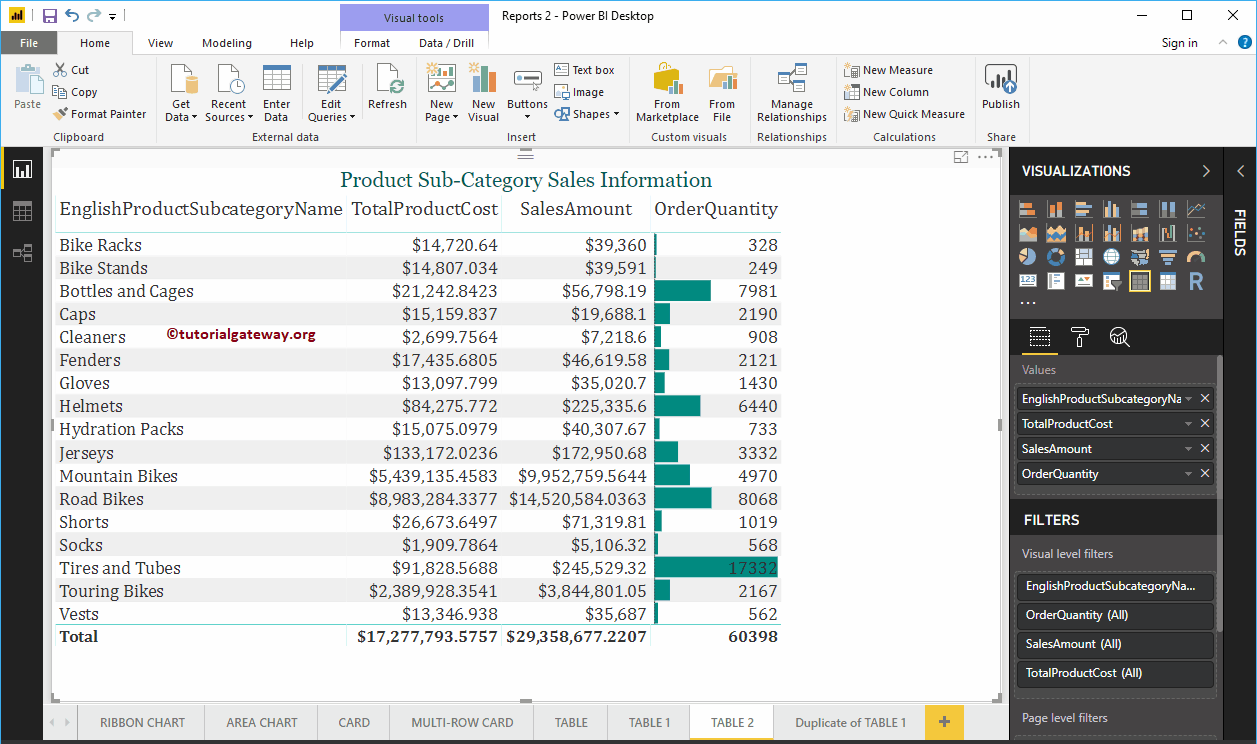
Now, you can see the data bars within the Order Quantity column.
Remove data bars from table in Power BI
Select the column name (metric value) on which you applied or added the data bar. In our previous step, we added a data bar in the Order Quantity column. Then, click the down arrow next to the Order Quantity column to open the context menu.
Select Remove Conditional Formatting and then select Data bars, as we show below.
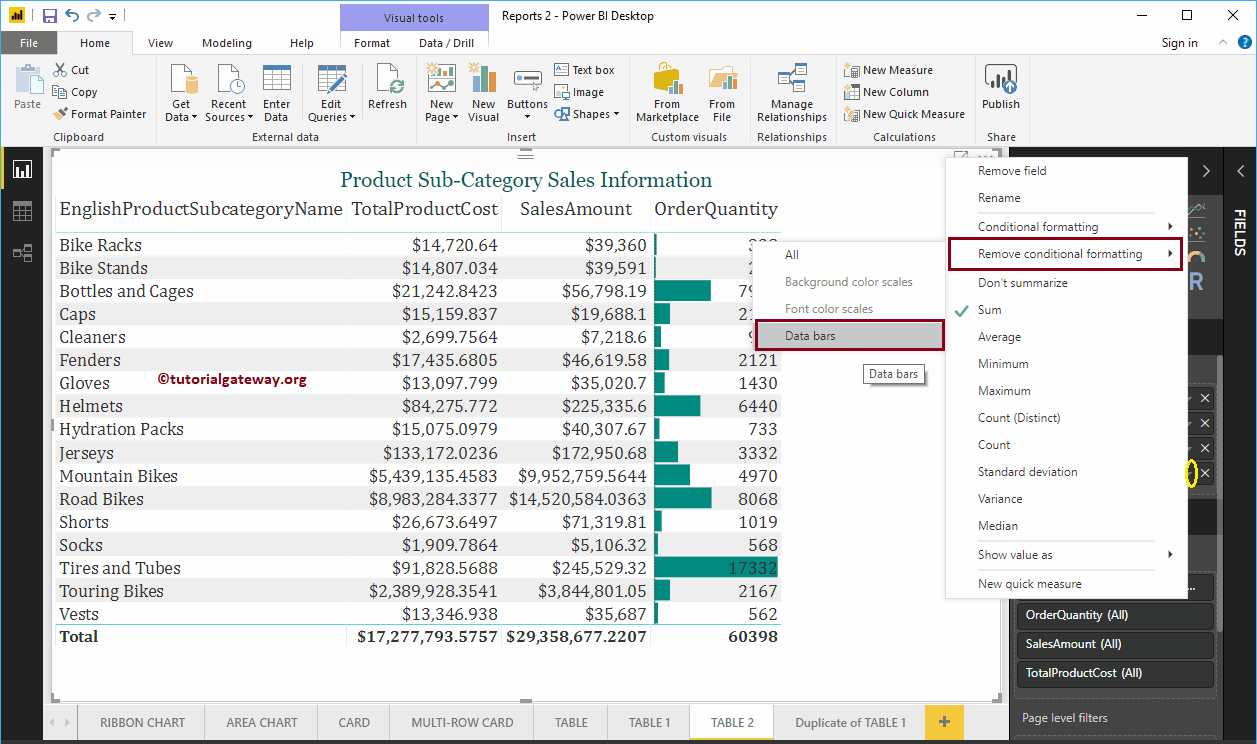
And we successfully remove data bars from a table.
Second approach to add data bars to table in Power BI
Click on the Format to see the list of table format options. Next, go to the Condition Format section to add data bars. In this Power BI example, we want to add data bars to the Order Quantity column in this table. So, we are selecting that column using the drop down list.
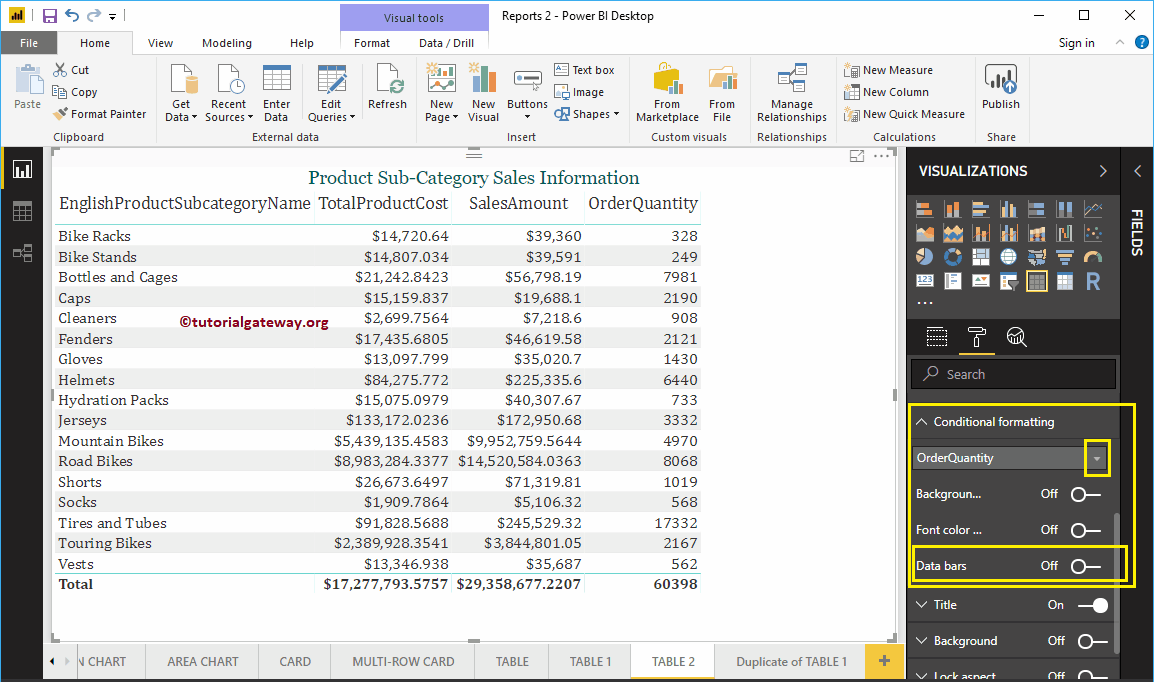
Then change the data bars property of Off to In Add Data bars as we show below. You can use the Advanced controls hyperlink to format these data bars.
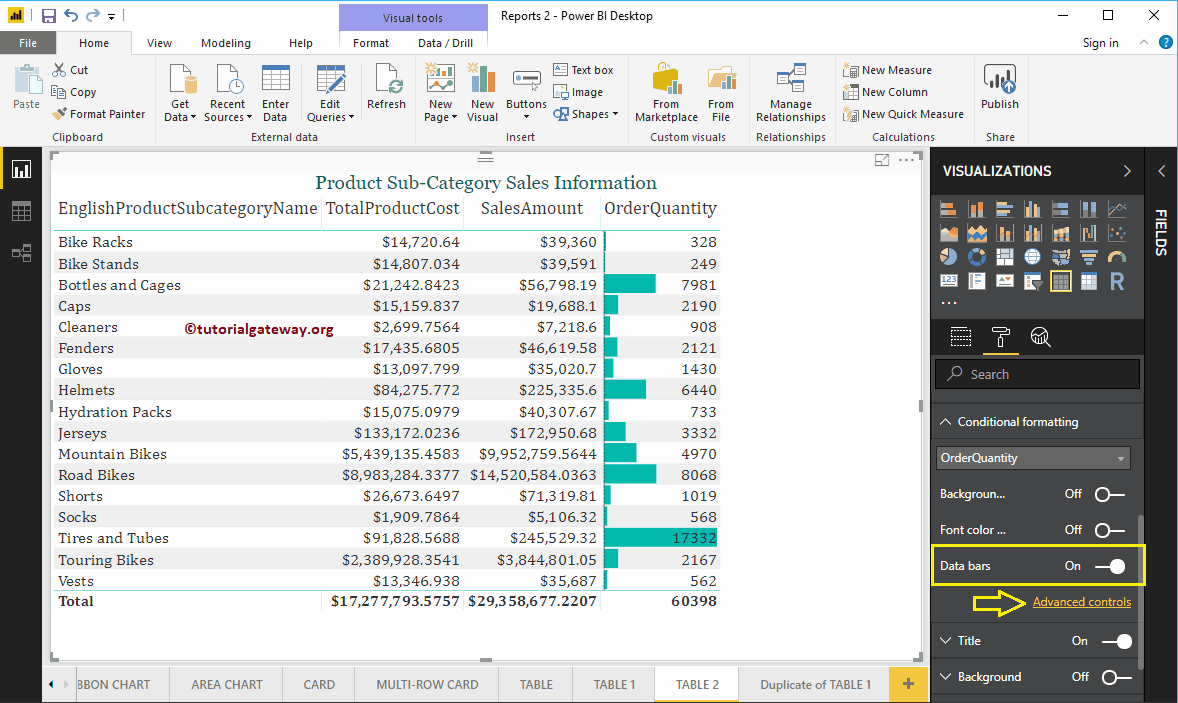
Click on the Advanced controls the following window will open.
Let me change the minimum value to 100 and the maximum value to 19000

Next, we mark the Show only bar property.

Now you can see only the data bars (only the data bar with no numeric value).