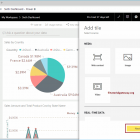
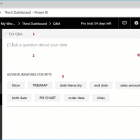
Create a custom column in Power BI

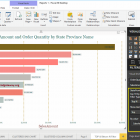
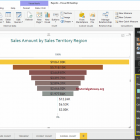
The Power BI custom column generates a new column based on the existing columns. For example, you can use this to calculate profit or loss, etc. Let's see how to create ...
R Digital Marketing16/05/2022