Advanced Power BI filters

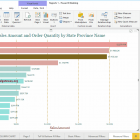
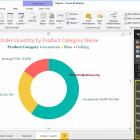
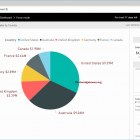
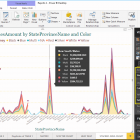
How to create advanced Power BI filters with an example ?. Power BI advanced filters use wildcards to narrow the report data based on requirements. For example,…
R Digital Marketing13/07/2022