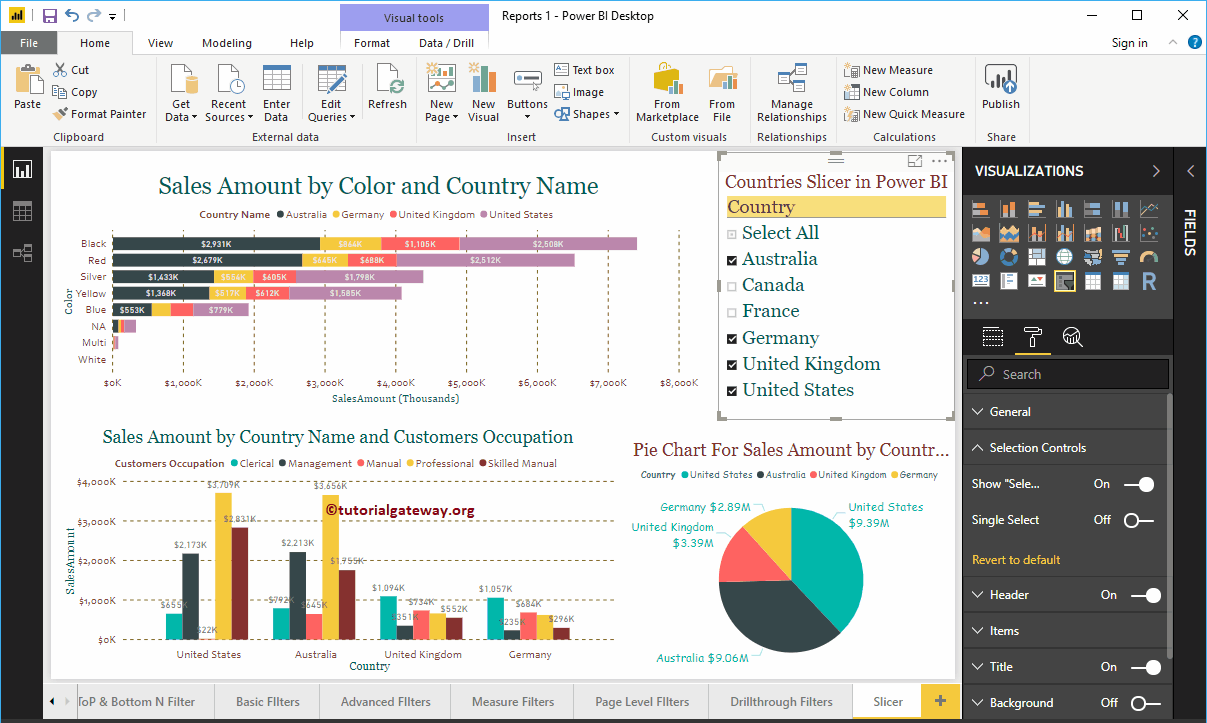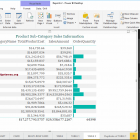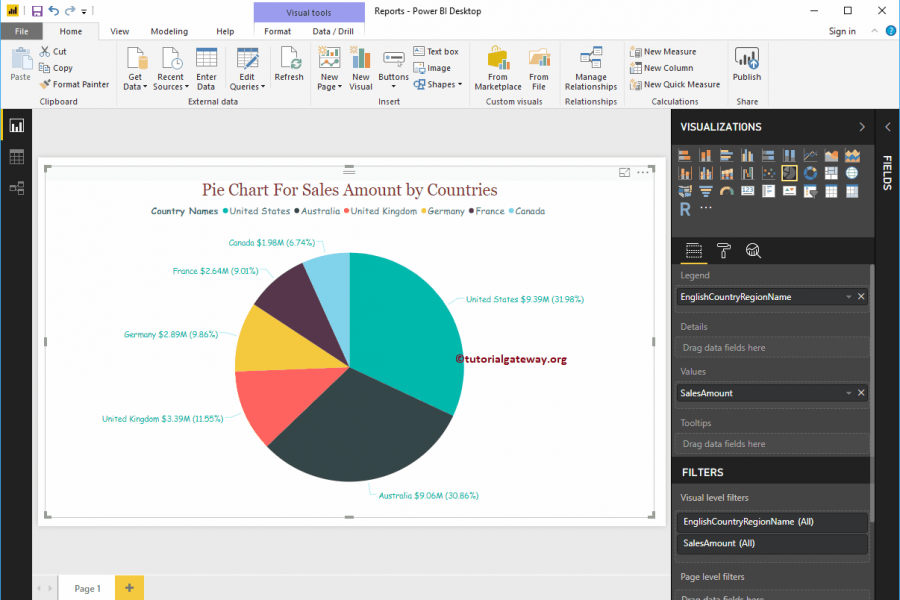
Pie chart in Power BI

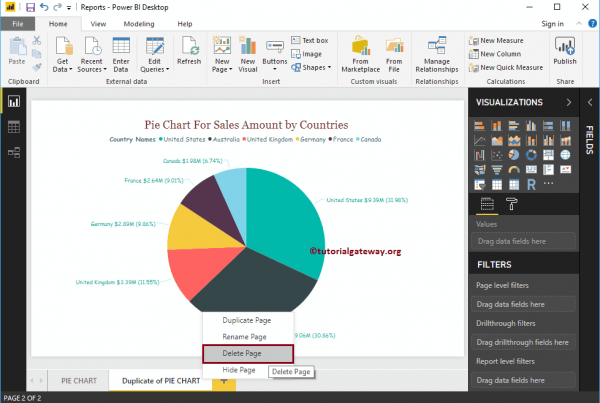
Pie charts in Power BI are very useful for visualizing high-level data. For example, Sales by continent or region, Orders by country, Customers by region or ...
R Digital Marketing16/10/2022