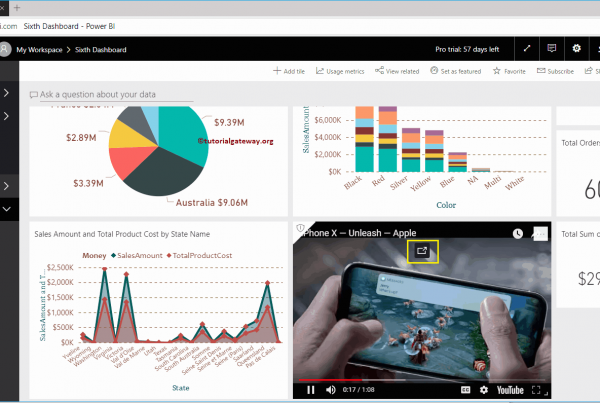
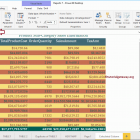
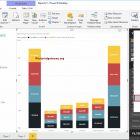
How to add web content to the Power BI dashboard

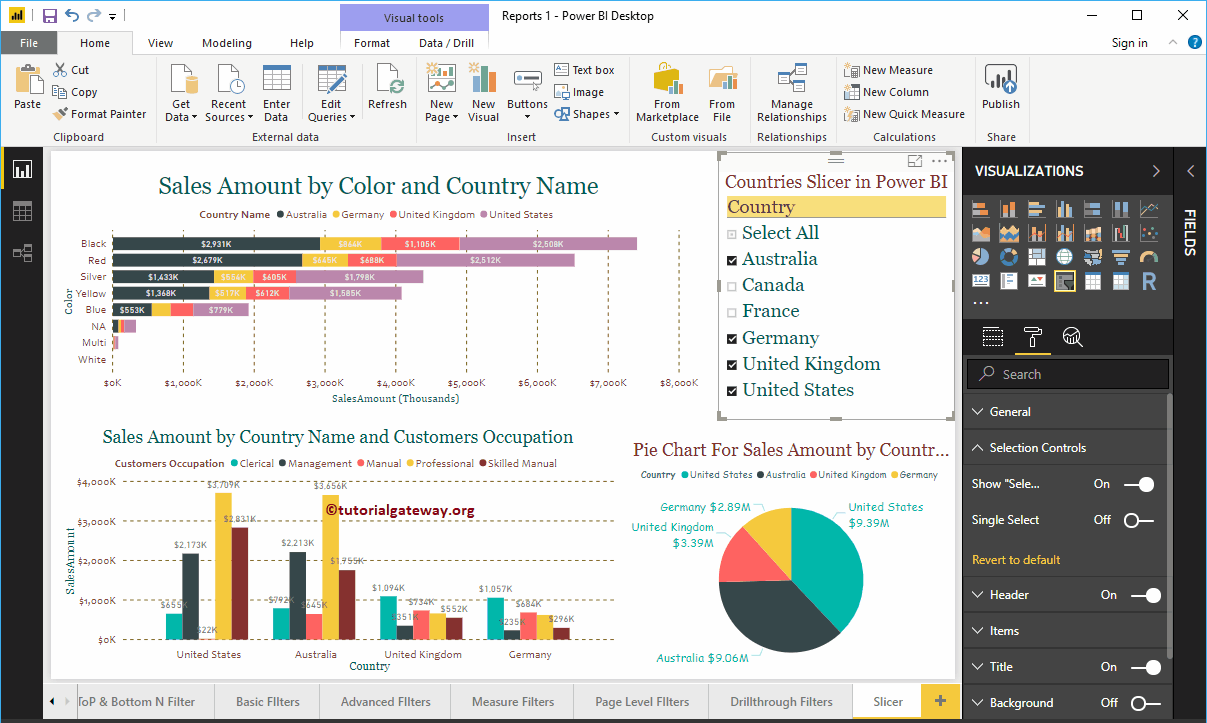
Let me show you how to add web content to Power BI dashboard with a practical example. For this demo of Adding Web Content to the Power BI Dashboard, we're going to insert ...
R Digital Marketing18/08/2022