Power BI DAX math functions

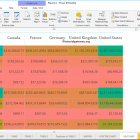
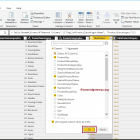
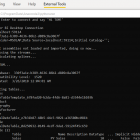
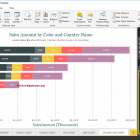
How to use Power BI DAX math functions with examples? Microsoft Power BI DAX provides various mathematical or mathematical functions such as ROOF, FLOOR, CURRENCY, INT, SQRT, POWER, MOD, DIVIDE, ...
R Digital Marketing20/08/2022