Los depósitos o contenedores de Power BI son útiles para crear un rango de datos, similar a los depósitos de SQL. Déjame mostrarte cómo crear bins en Power BI con un ejemplo
Para esta demostración de bins de Power BI, usaremos la fuente de datos SQL que creamos en nuestro artículo anterior. Por lo tanto, consulte Conectarse al artículo de SQL Server para comprender la fuente de datos.
Crear contenedores en Power BI
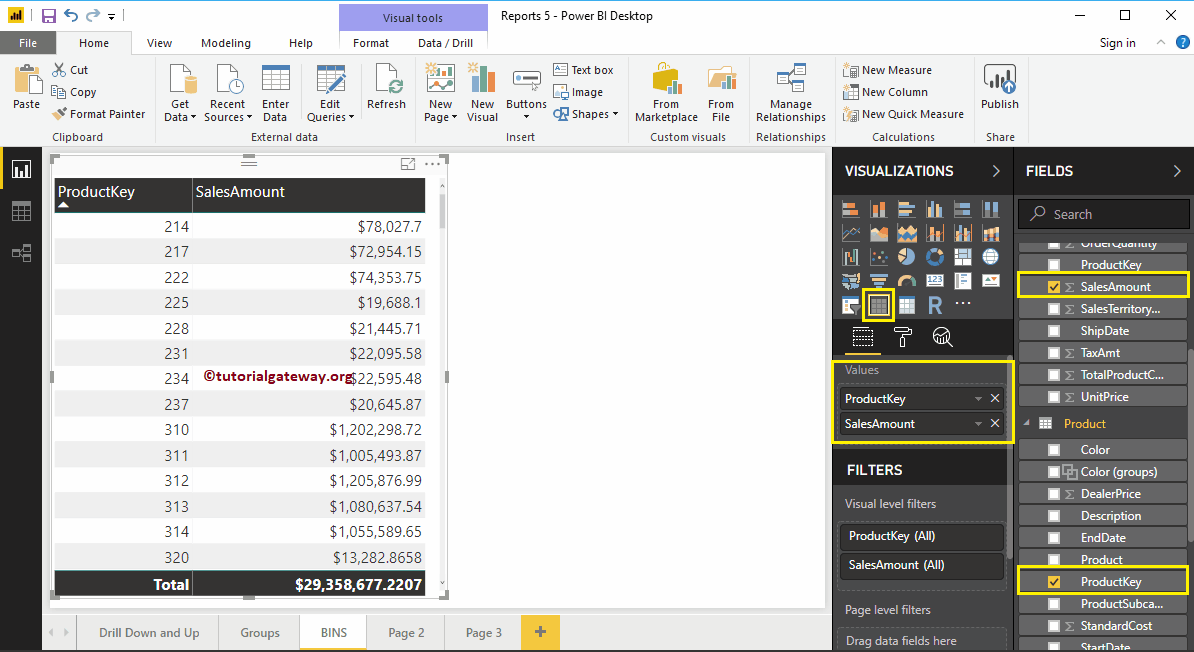
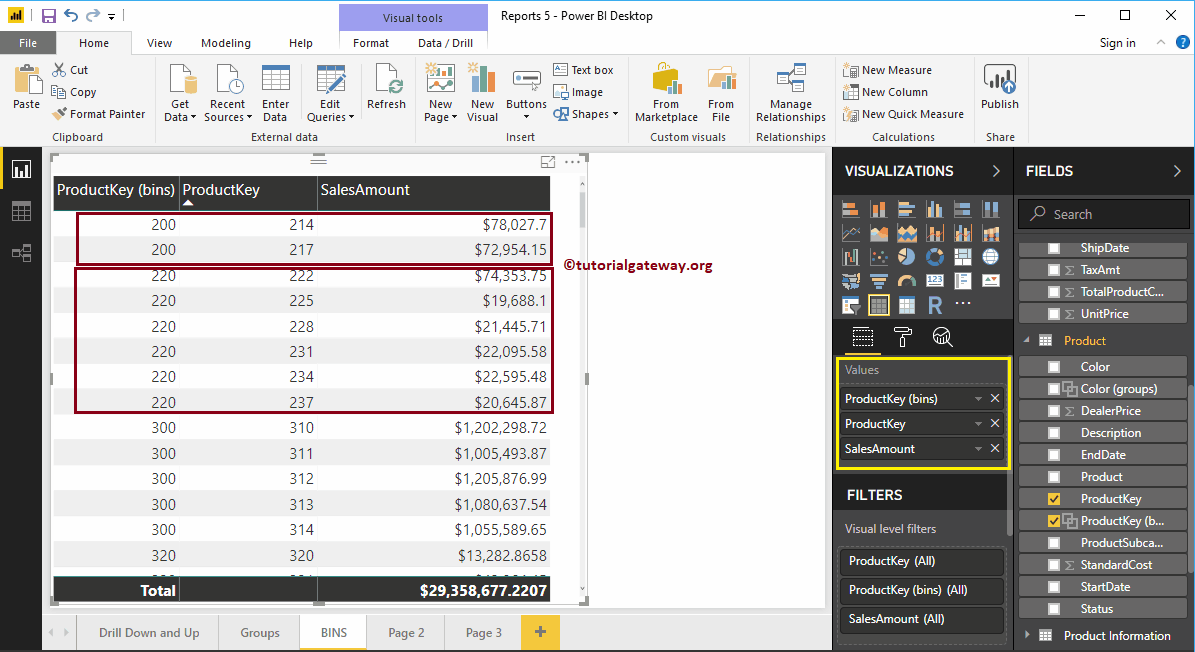
Para demostrar visualmente estos bins de Power BI, crearemos una tabla. Como puede ver en la captura de pantalla a continuación, creamos una tabla simple arrastrando la columna Clave de producto y Monto de ventas.
NOTA: Le sugiero que consulte el artículo Crear una tabla y formatear una tabla para comprender los pasos necesarios para crear y formatear una tabla de Power BI.
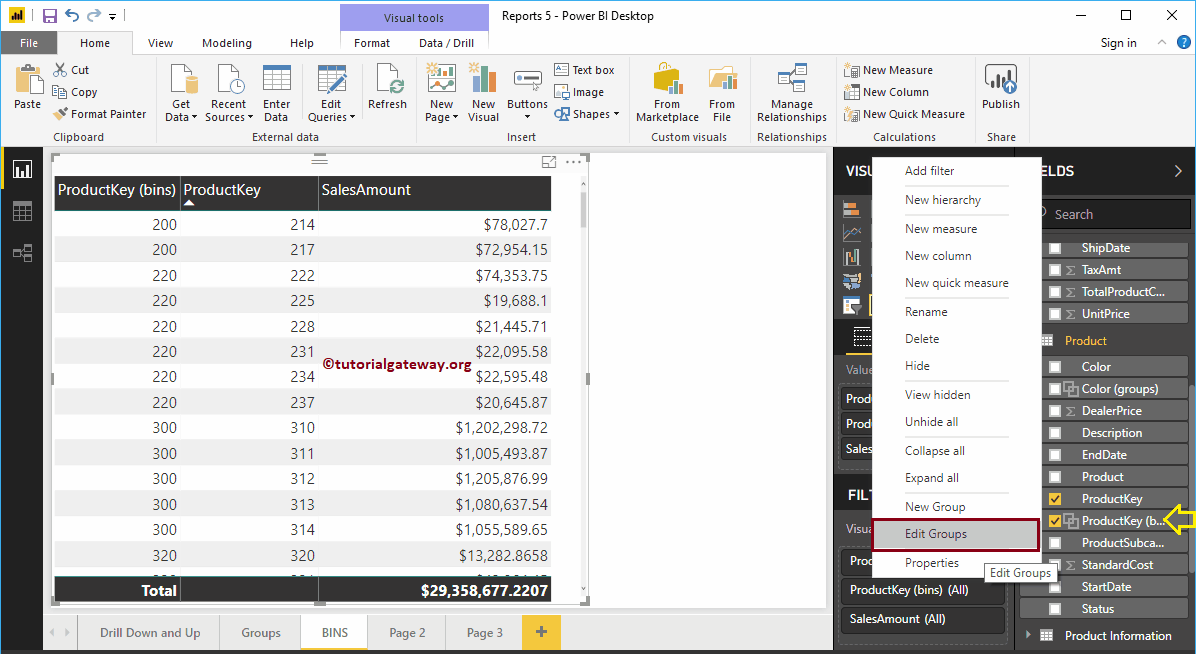
Seleccione el archivo que desea usar como contenedor y haga clic derecho sobre él para abrir el menú contextual. Selecciona el Nuevo grupo opción del menú.
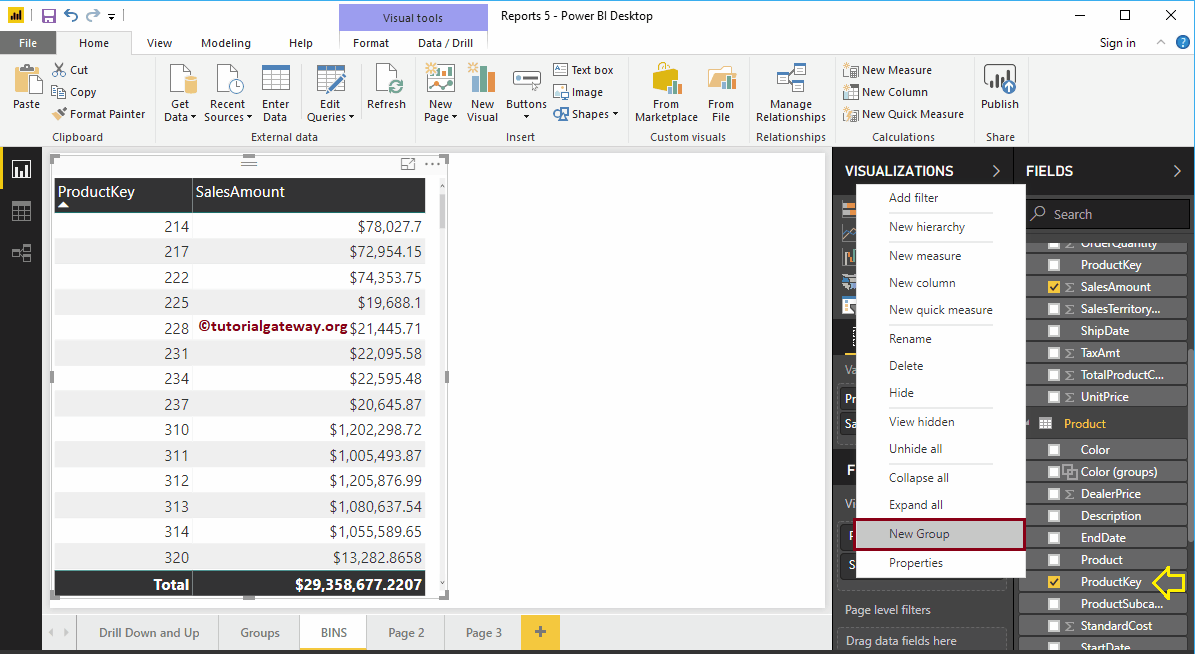
Haciendo clic en el Nuevo grupo La opción abre la siguiente ventana.
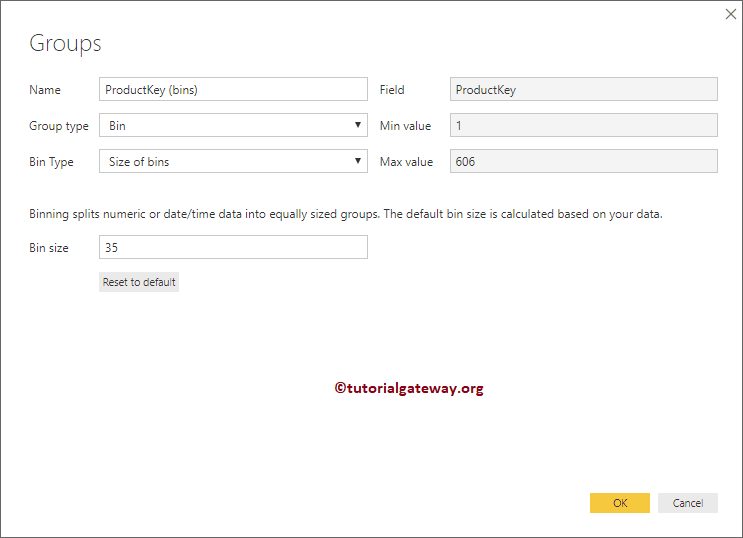
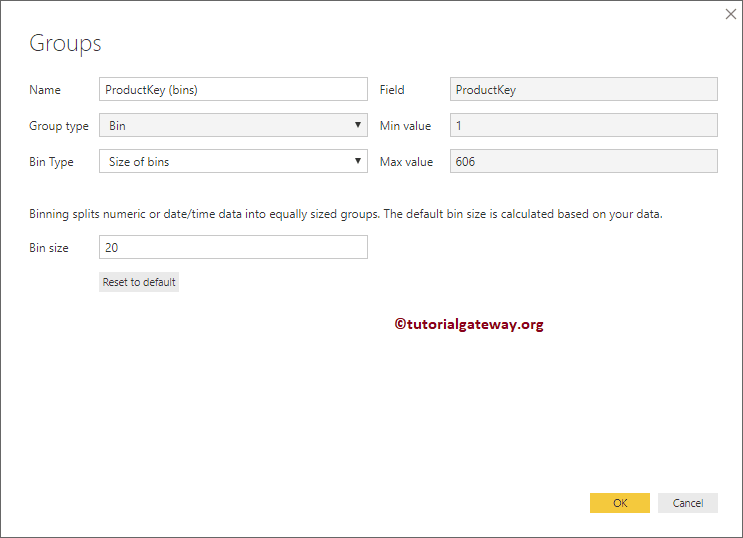
- Nombre: Especificar el nombre de la bandeja de Power BI
- Campo: Campo o columna que usó para agrupar
- Tipo de grupo: Lista (grupo) o contenedor.
- Tipo de contenedor: Hay dos opciones, como Tamaño de contenedores o Número de contenedores
- Valor mínimo y máximo: Valor mínimo y máximo presente en los Campos seleccionados. Aquí está la clave del producto.
Si seleccionó el Tipo de contenedor como Tamaño de contenedores, entonces debe especificar el Tamaño de contenedor (Número estático)
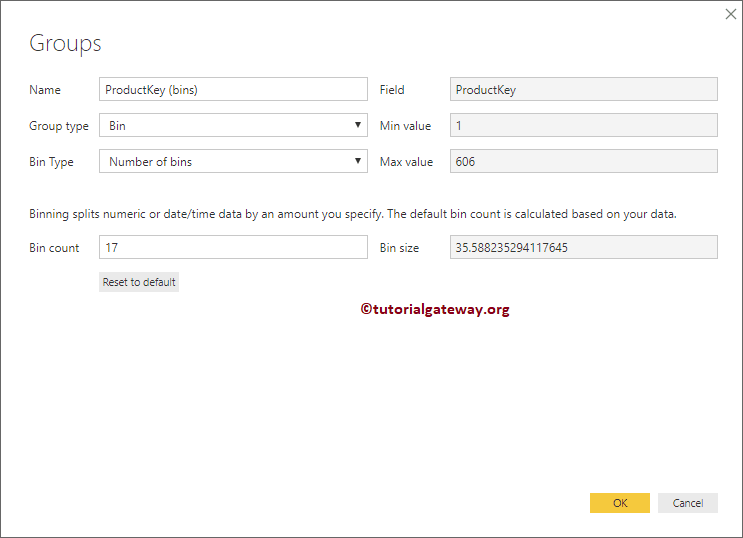
Alternativamente, si seleccionó el Tipo de contenedor como Número de contenedores, debe especificar el recuento de contenedores. Aquí, el tamaño del contenedor depende del recuento del contenedor.
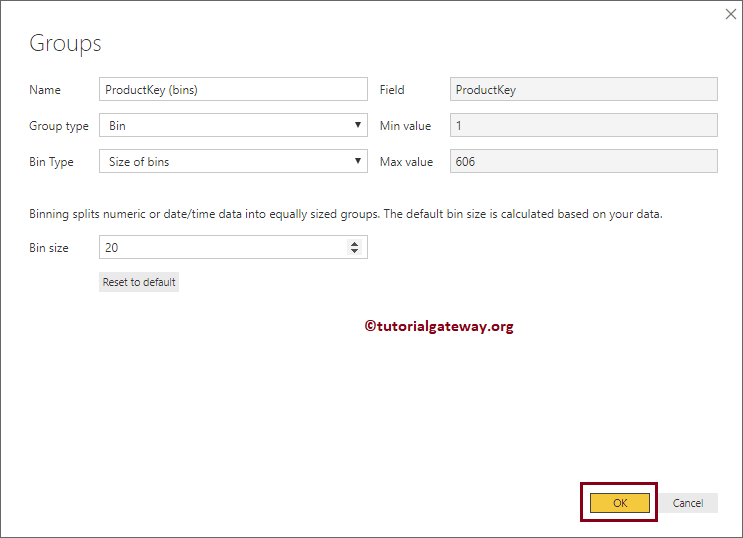
Permítanme seleccionar el tamaño del contenedor como 20 y hacer clic en Aceptar. Significa que cada tamaño de cubo es 20
Ahora puede ver el contenedor recién creado debajo de la tabla Producto.
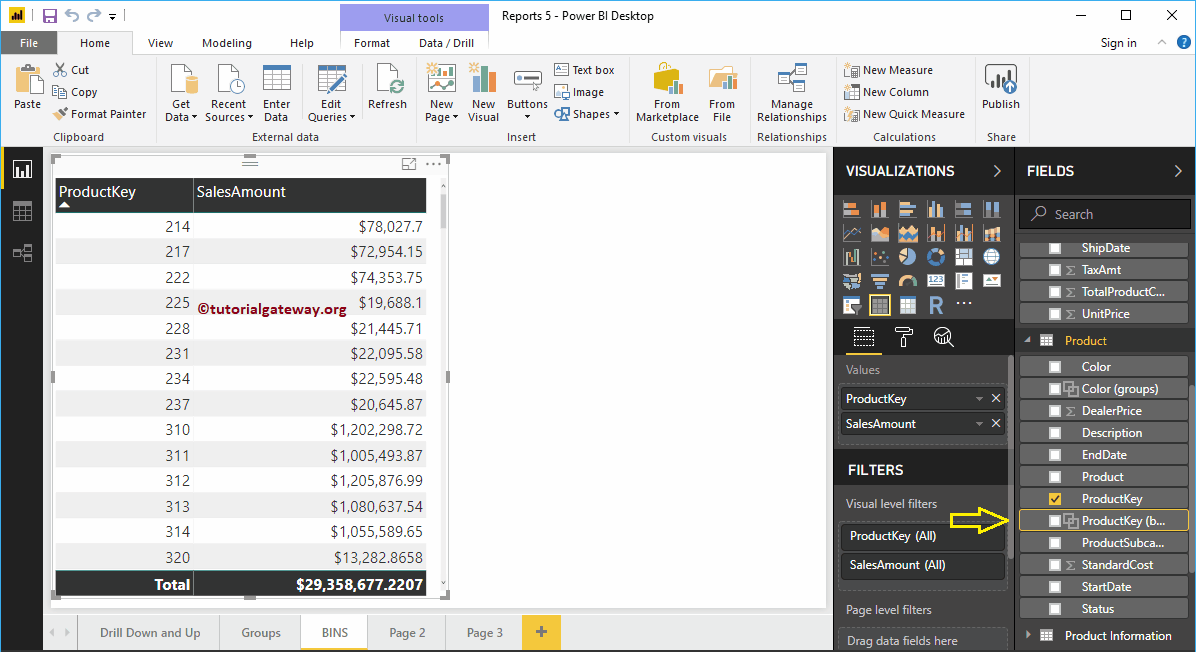
Déjeme agregar ese contenedor a esta mesa. En la siguiente captura de pantalla, puede ver que el valor de la clave del producto es 220 para las claves entre 220 y 240
Editar contenedores de Power BI
Seleccione el contenedor que desea editar y haga clic derecho en él para abrir el menú contextual. Selecciona el Editar grupos opción de ella
Haciendo clic en el Editar grupos La opción abre la siguiente ventana. Utilice esta ventana para cambiar según sus necesidades.
Eliminar contenedores en Power BI
Seleccione el contenedor que desea eliminar y haga clic derecho en él para abrir el menú contextual. Selecciona el Eliminar opción de hacerlo
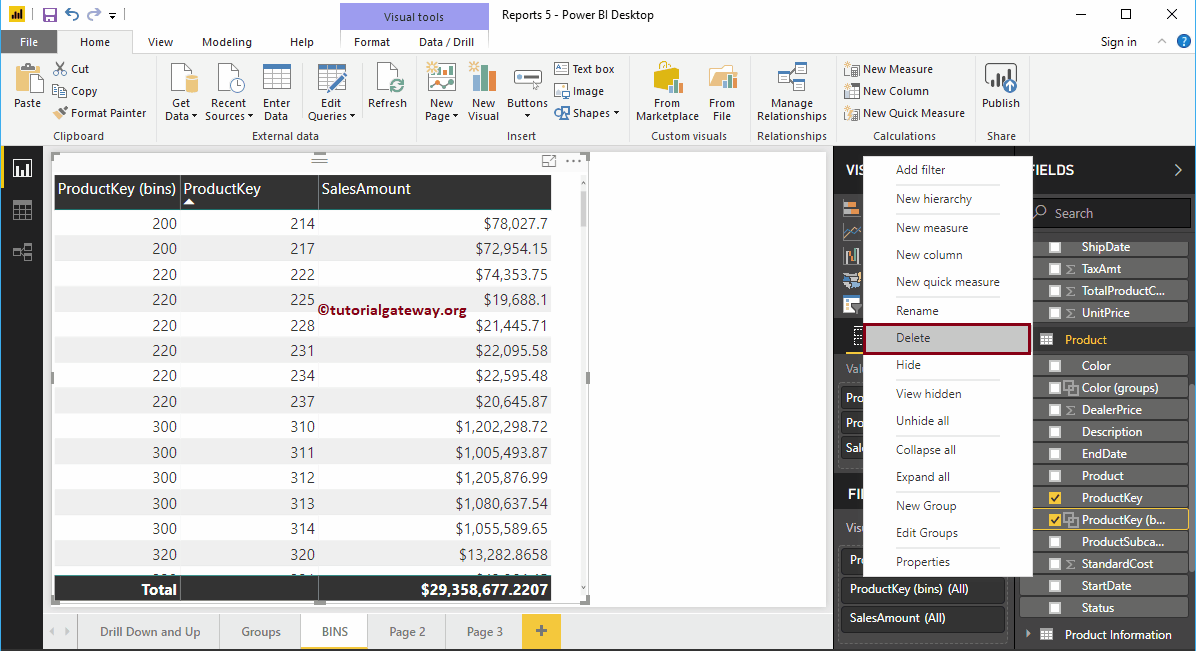
Haga clic en el Eliminar para confirmar la operación de eliminación.
Crear contenedores en el ejemplo 2 de Power BI
Para demostrar los contenedores, creamos un gráfico de columnas que muestra las ventas de colores. Esta vez creamos un bin en Sales Amount
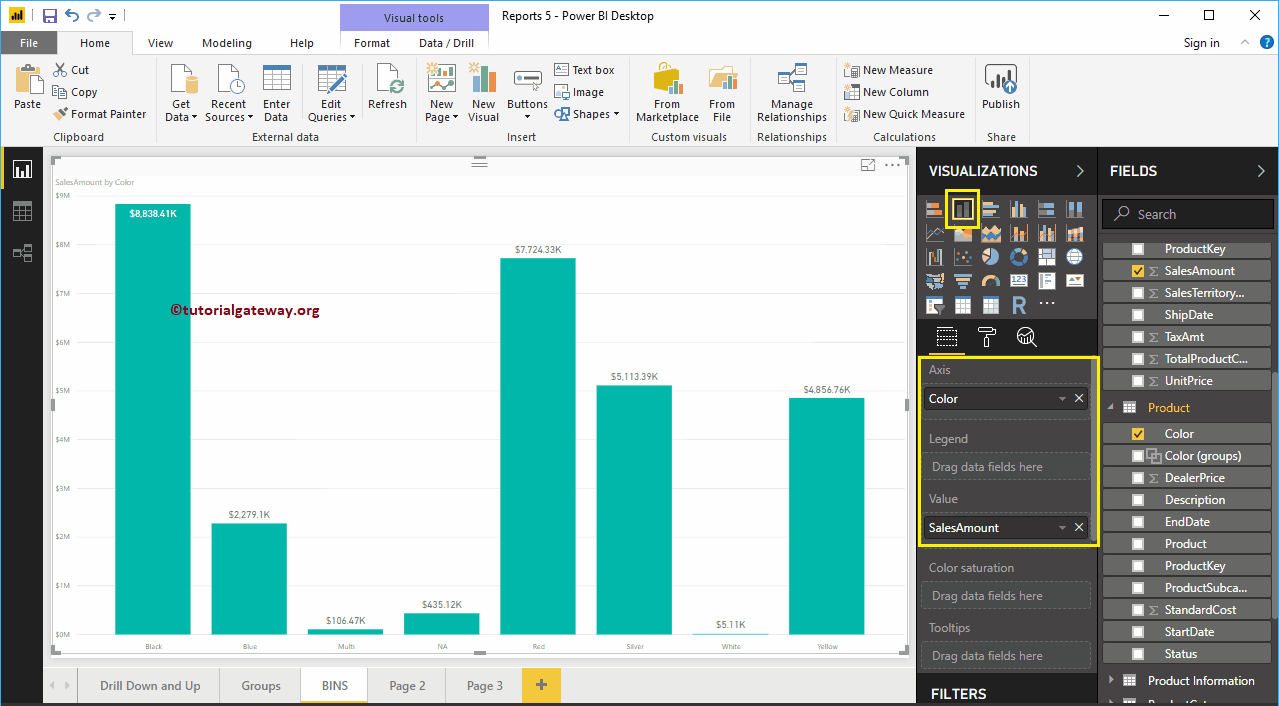
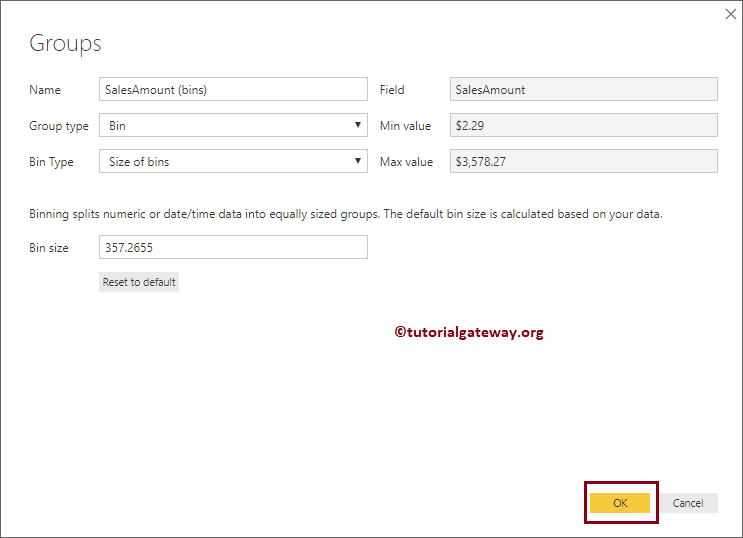
Haga clic con el botón derecho en el Monto de ventas y seleccione la opción Nuevo grupo en el menú contextual. Como puede ver en la siguiente captura de pantalla, definimos el tamaño de la bandeja de Power BI como 357.2655
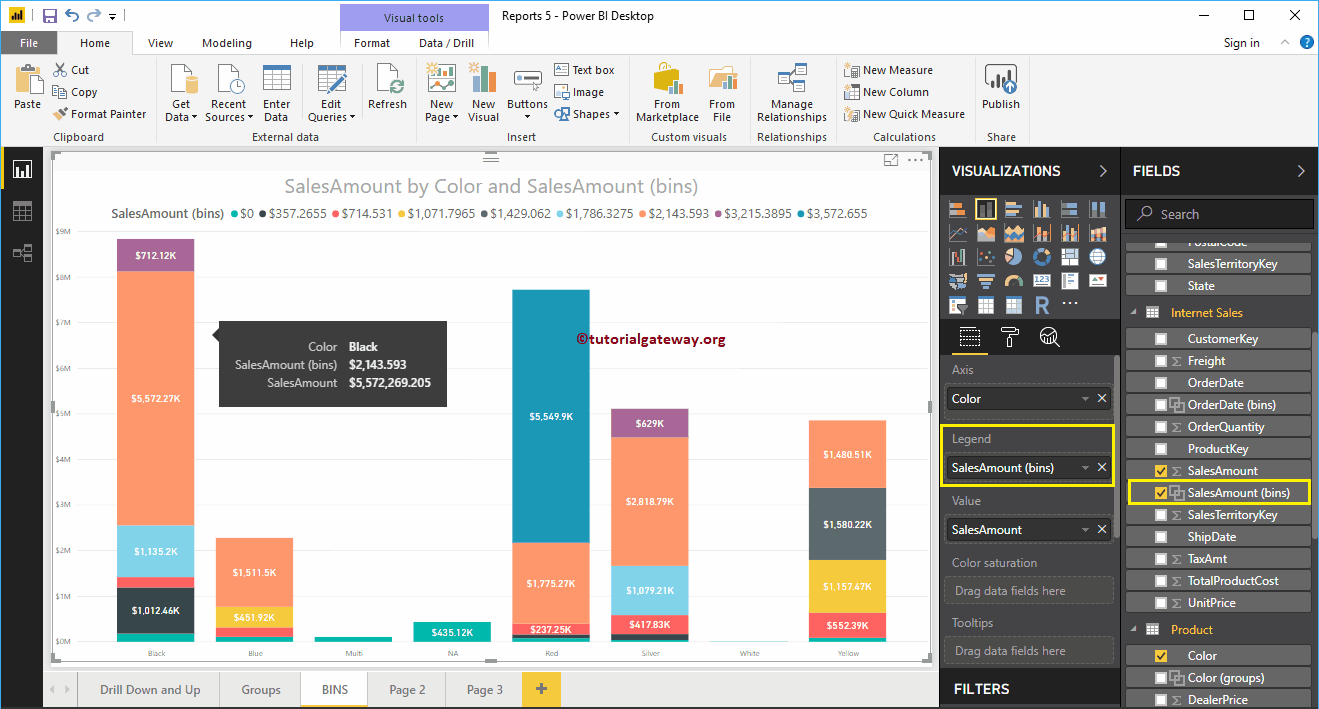
Permítanme agregar esta nueva bandeja de Importe de ventas a la sección de leyenda del gráfico de columnas.

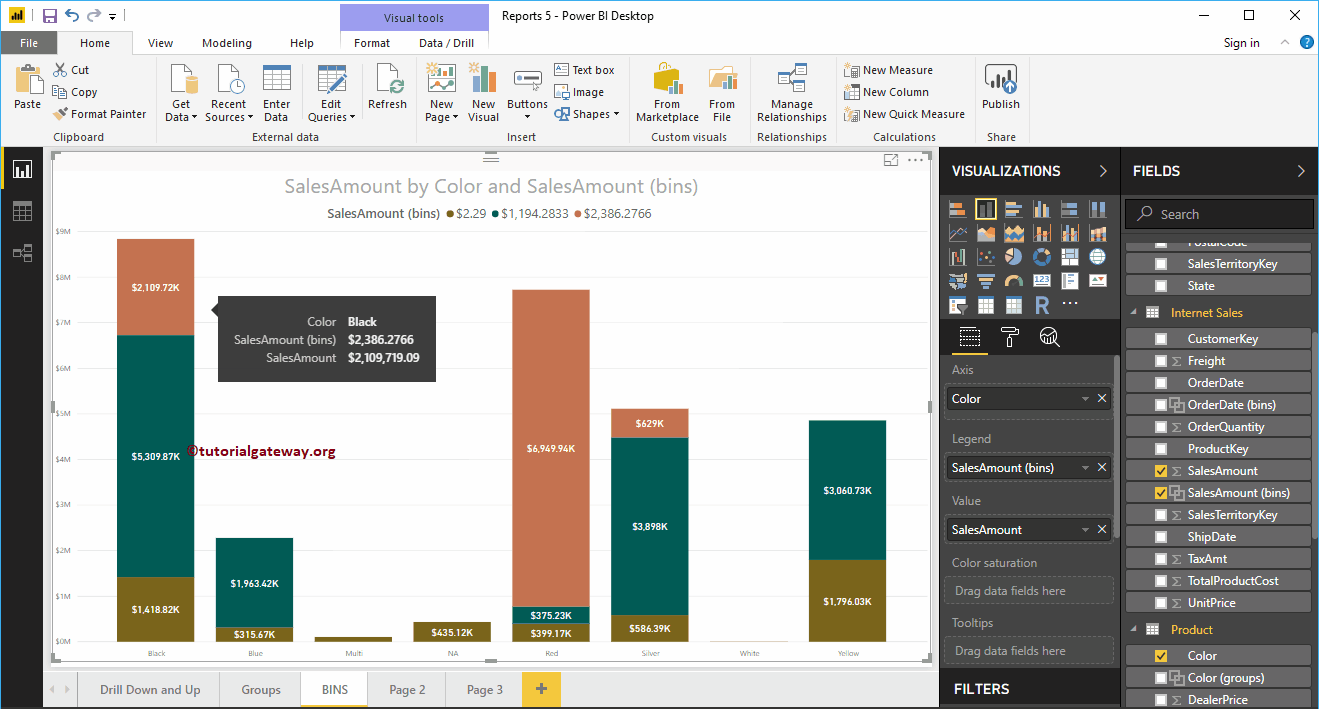
Permítame editar la bandeja de Power BI y cambiar el tipo de bandeja a Número de bandejas y el recuento de bandejas a 3
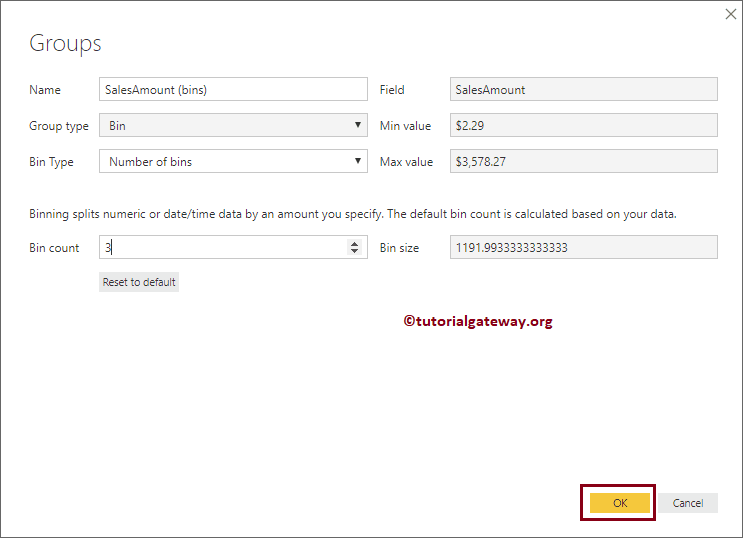
Ahora puede ver, cada barra en el gráfico de columnas dividido por un contenedor de recuento 3.