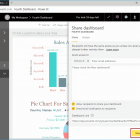
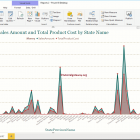
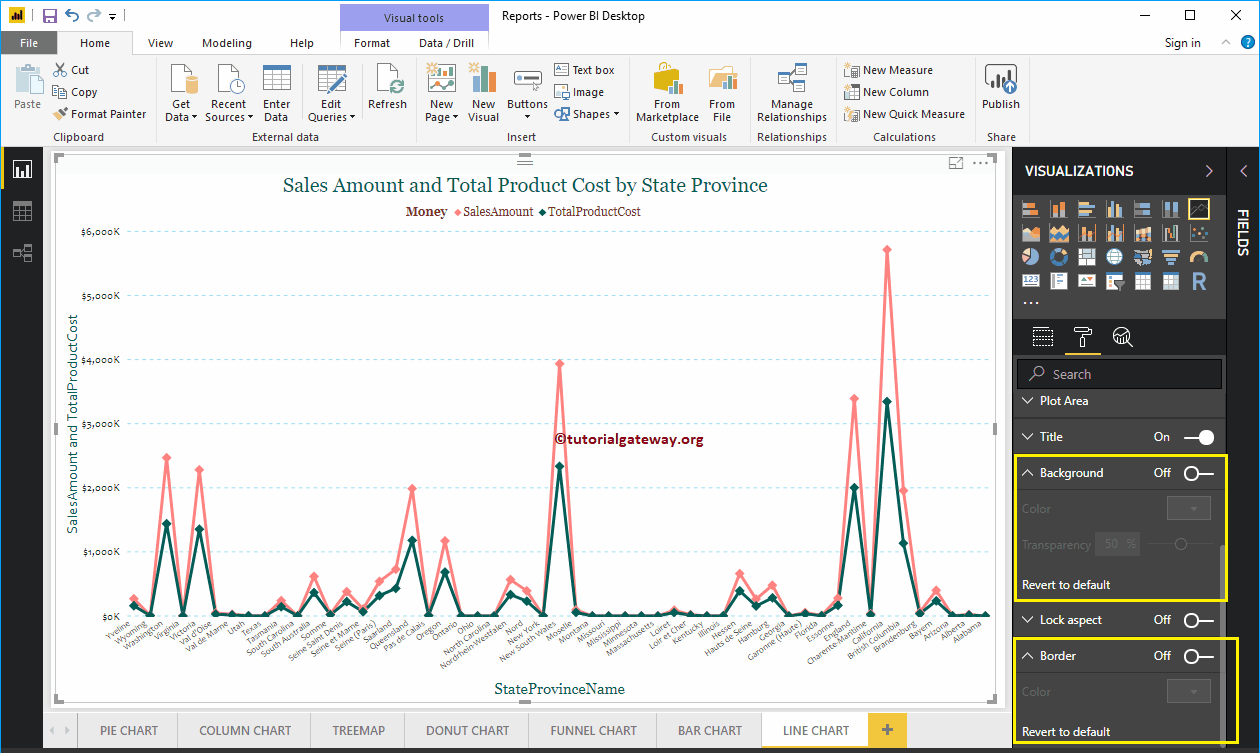
Guides and tutorials

Power BI

Articles so you can learn to master Power BI. We have more than 300 guides and tutorials on the most important business management tool of the moment. In this blog we are going to focus on the most productive facet of the application with dashboards that are for professional, personal and educational use.

power-bi-advanced-filters-8-9668999-1403250-png
Power BI

Advanced Power BI filters

How to create advanced Power BI filters with an example ?. Power BI advanced filters use wildcards to narrow the report data based on requirements. For example,…
create-a-card-in-power-bi-8-9104225-5704354-png
Power BI

How to create a card in Power BI

Let me show you how to create a card in Power BI with an example. The Power BI card is useful for displaying a single number (or metric value). For example, yes…
add-rename-and-duplicate-pages-in-power-bi-11-7608100-3486785-png
Power BI

Add rename and duplicate pages in Power BI

In this article, we show how to add new pages, rename pages, hide pages, duplicate pages, and delete pages in Power BI with an example. For the purpose ...
add-data-bars-to-table-in-power-bi-13-6057715-7000812-png
Power BI
Add data bars to the table in Power BI
power-bi-stacked-bar-chart-11-9401808-4835773-png
Power BI
Power BI stacked bar chart
power-bi-dashboard-actions-2-5008872-1000886-png
Power BI
Power BI dashboard actions
create-bins-in-power-bi-5-8787417-9429593-png
Power BI
Create containers in Power BI
create-bins-in-power-bi-5-8787417-9429593-png
Power BI
Create containers in Power BI
format-power-bi-area-chart-14-2814874-6042730-png
Power BI
Format the Power BI area chart
format-stacked-bar-chart-in-power-bi-12-9759864-2616954-png
Power BI
Format a stacked bar chart in Power BI
create-a-custom-column-in-power-bi-3-8188169-7101847-png
Power BI
Create a custom column in Power BI
scatter-chart-in-power-bi-12-7239384-5951670-png
Power BI
Scatter chart in Power BI
unpivot-table-in-power-bi-3-8488367-4091926-png
Power BI
Override pivot table in Power BI
clustered-bar-chart-in-power-bi-9-5205704-1458662-png
Power BI
Clustered bar chart in Power BI
add-video-to-power-bi-dashboard-7-3862226-2175127-png
Power BI
How to add video to the Power BI dashboard

What is Power BI?

Power BI is the collective name for a variety of cloud applications and services that help organizations collect, manage, and analyze data from a variety of sources, through an easy-to-use interface. Power BI gathers and processes data into intelligible information, often using visually appealing and easy-to-process charts and tables.

This allows users to generate and share clear and useful snapshots of what is happening in their business. Power BI connects to a variety of data sources, from basic Excel spreadsheets to databases and applications both in the cloud and on our company's servers.

Power BI is a general term and can refer to a Windows desktop application called Power BI Desktop, a software-as-a-service (SaaS) online service called Power BI service, or Power BI mobile apps available on phones and tablets. Windows, as well as for iOS and Android devices.

Power BI is built on Microsoft Excel, and as such the learning curve from Excel to Power BI is not that steep; Anyone who can use Excel can use Power BI, but Power BI is much more powerful than the spreadsheet.

+ Productivity

Best Free Power BI Articles

Surely you are looking to optimize the delivery of information and reporting in your company or enterprise.How many hours have we spent creating spreadsheets and formulas What do we use in our home or office?

With a good dashboard in Power BI you can save hundreds of hours of work. We want to share with you our selection of tutorials and guides for Power BI.