Power BI Stacked Bar Chart The bar chart is useful for comparing multiple dimensions with a single measure. Let me show you how to create a stacked bar chart in Power BI with an example.
For this Power BI stacked bar chart demo, we will use the SQL data source that we created in our previous article. Therefore, see the article Connect Power BI to SQL Server to understand the Power BI data source.
How to Create a Power BI Stacked Bar Chart
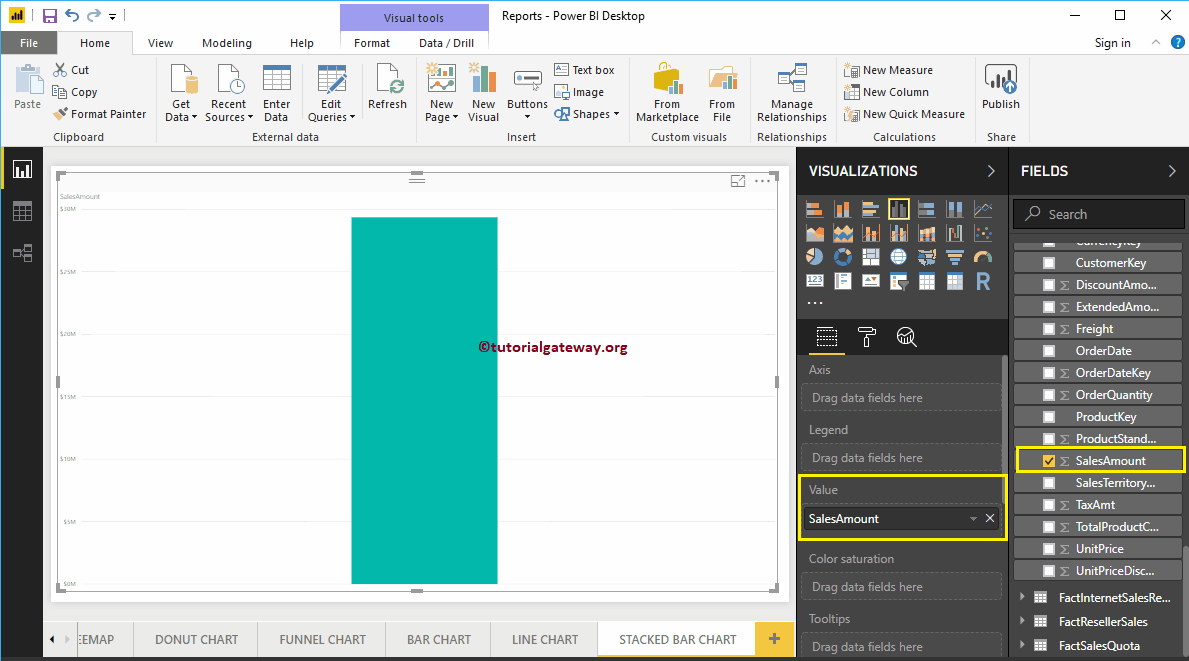
To create a stacked bar chart in Power BI, first drag and drop the Sales Amount section of the fields onto the region of the canvas. Automatically create a column chart, as shown in the following screenshot.
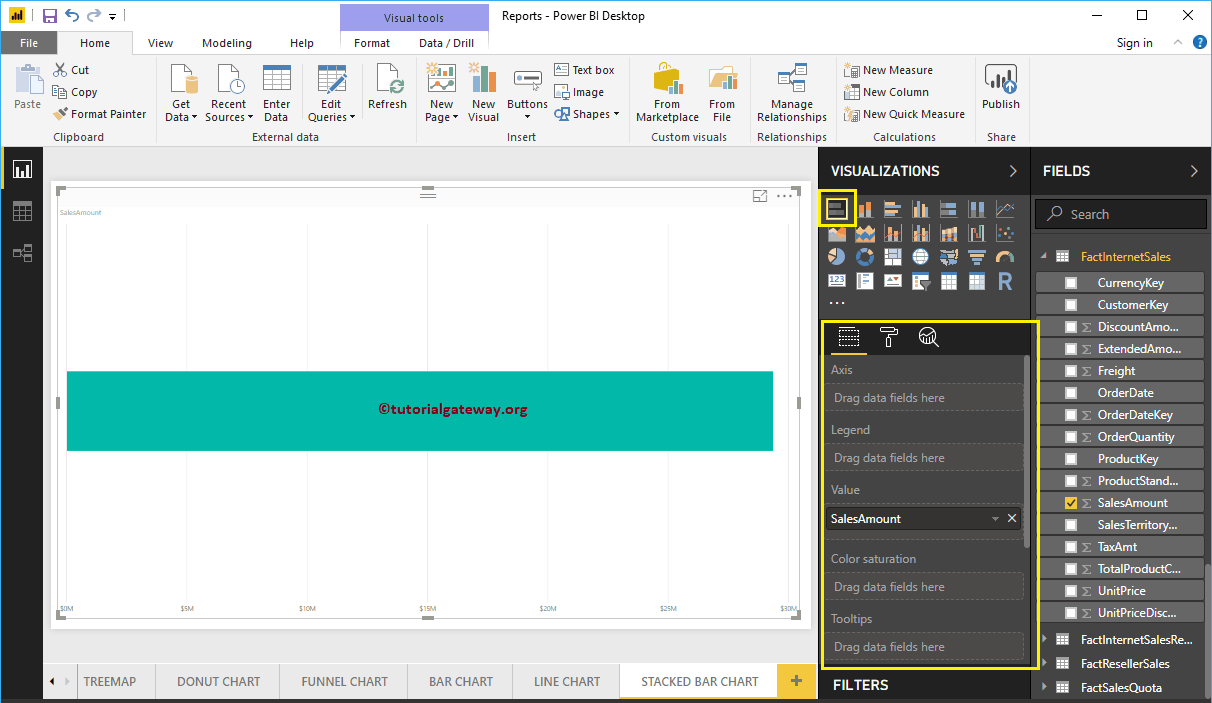
By clicking on the stacked bar chart below the Display section, automatically converts column chart to stacked bar chart
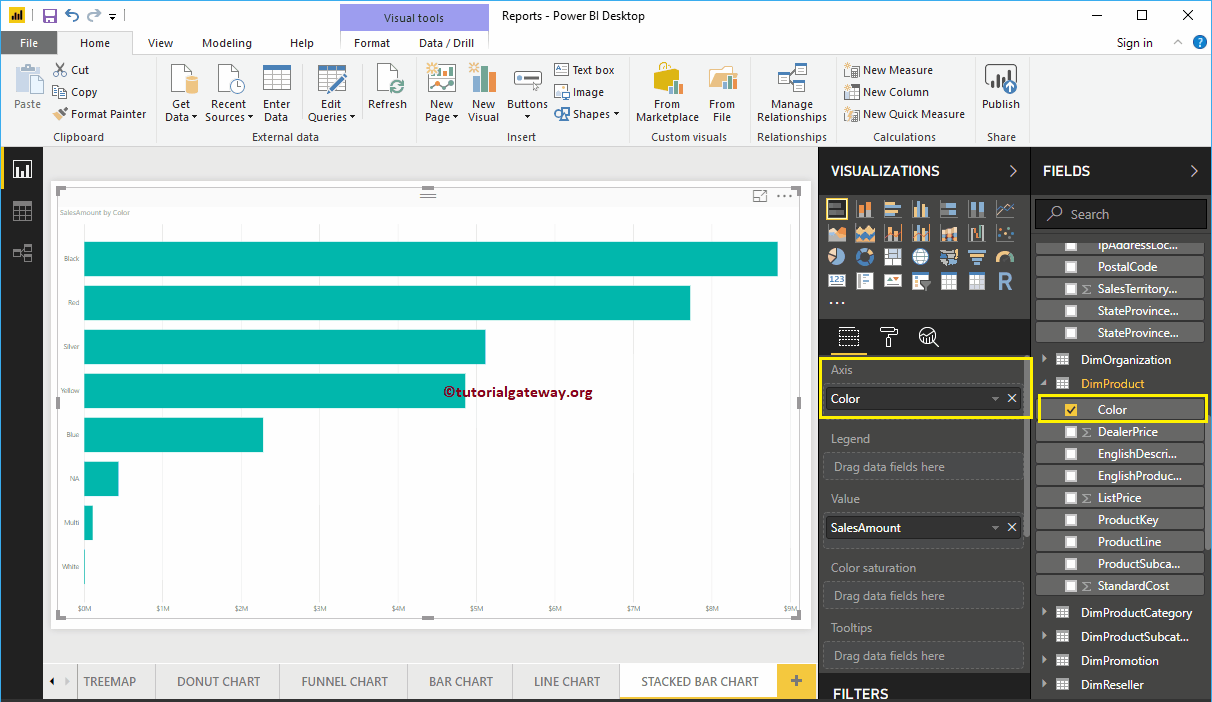
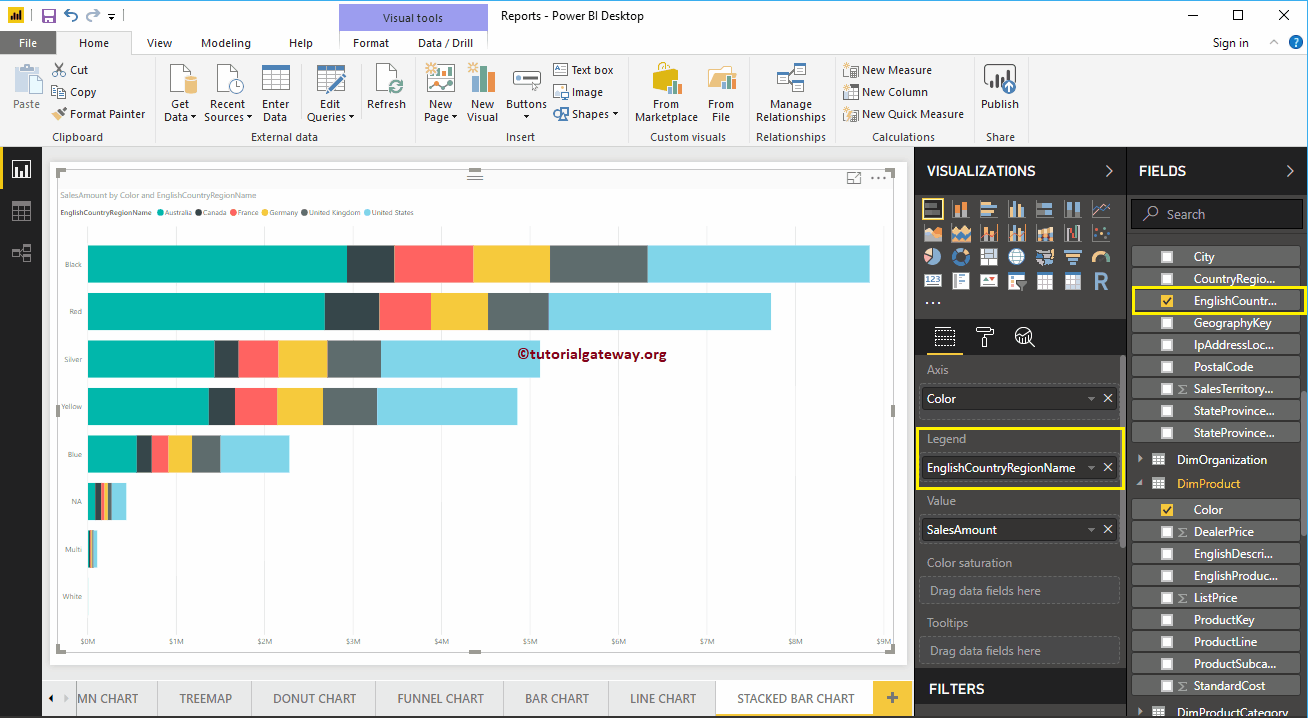
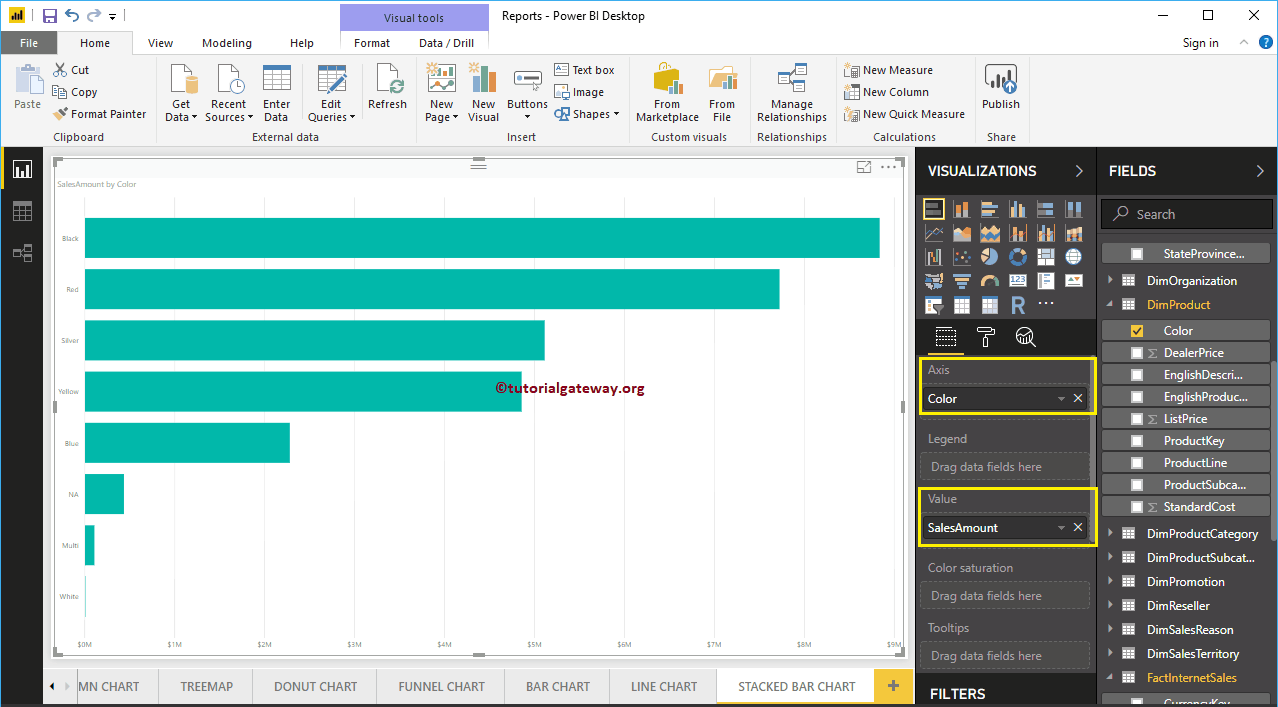
Next, let me add Color to the Axis section to create a bar chart showing the sales amount by color.
Next, we add the English country region name to the Legend section to make it the stacked bar chart.
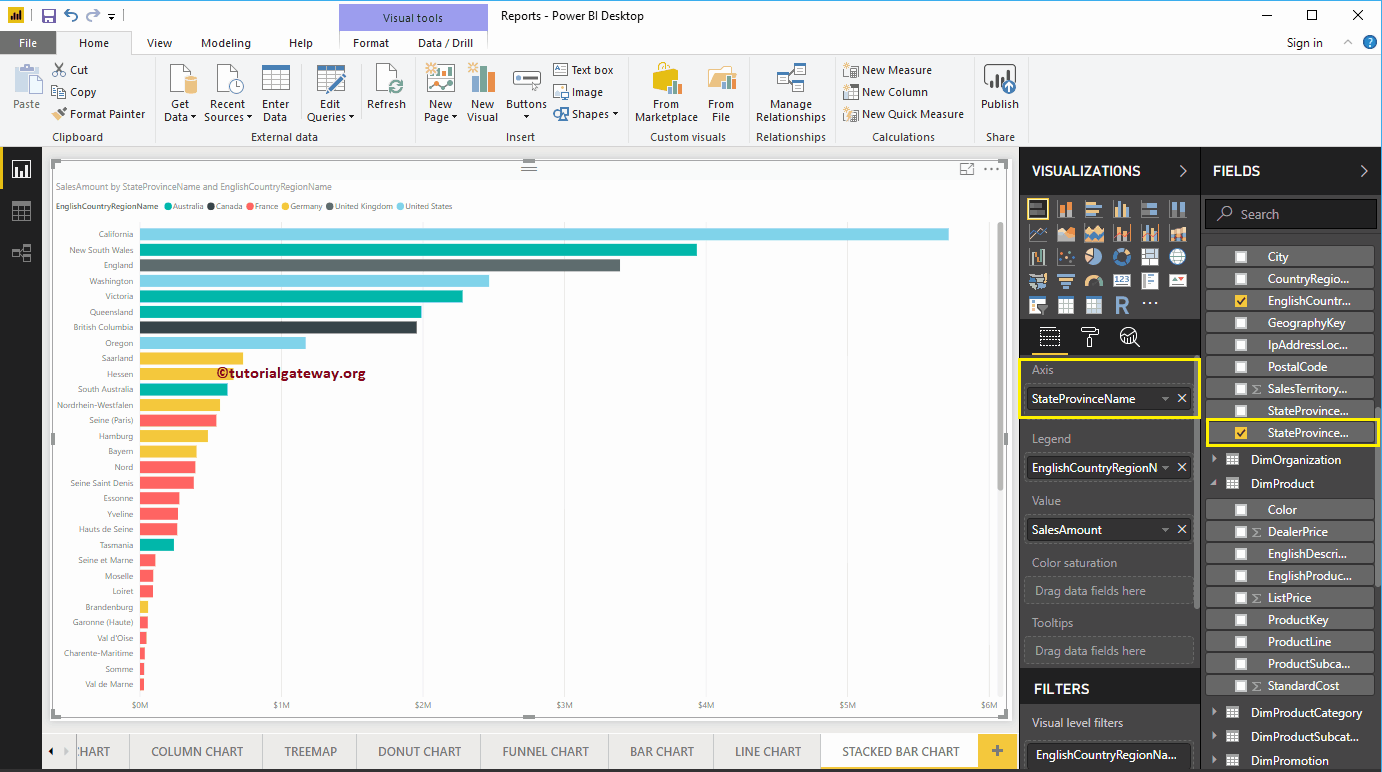
This time, we add the name of the state province to the axis and the country to the legend. In the following screenshot, you can see that the country name acts as the color of the bar. It's because you can't group country names within a state (state name inherited from country). Remember this while working with a stacked bar chart.
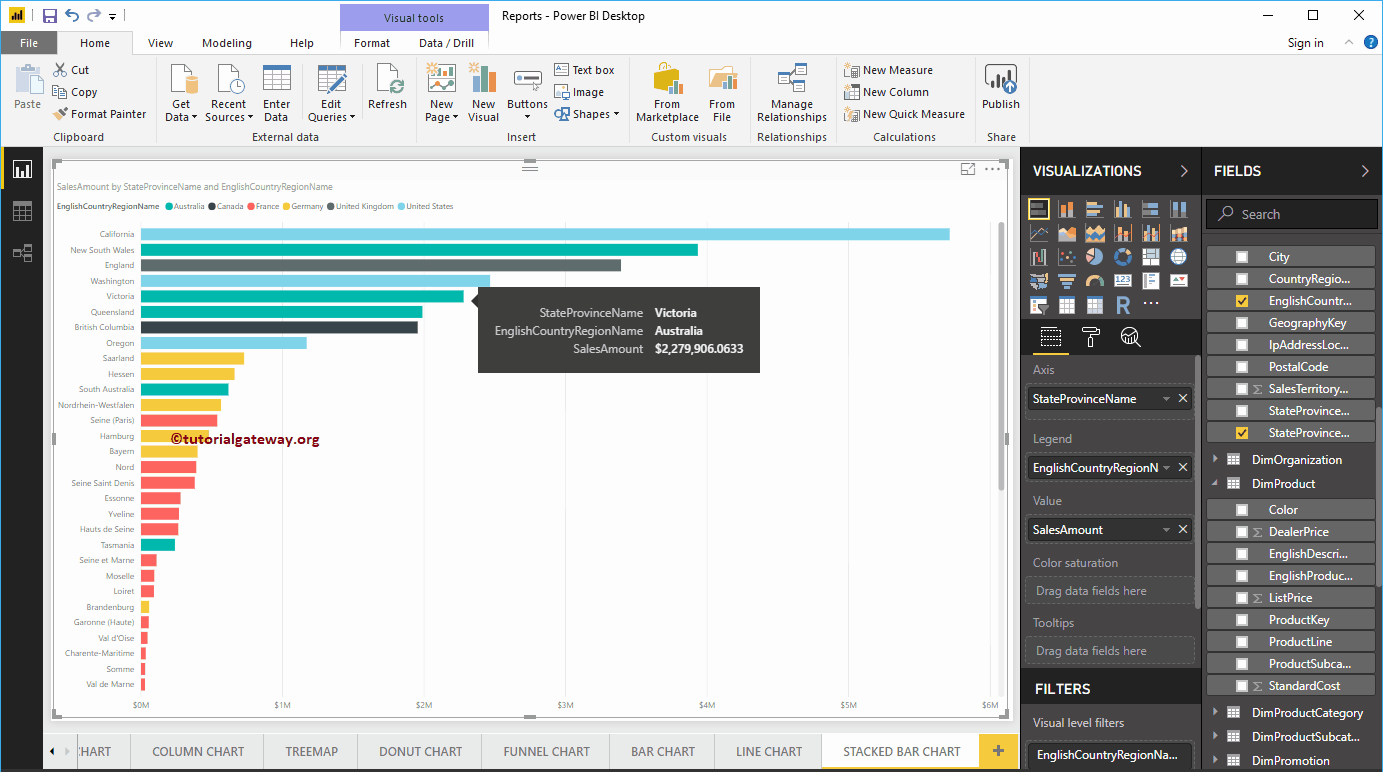
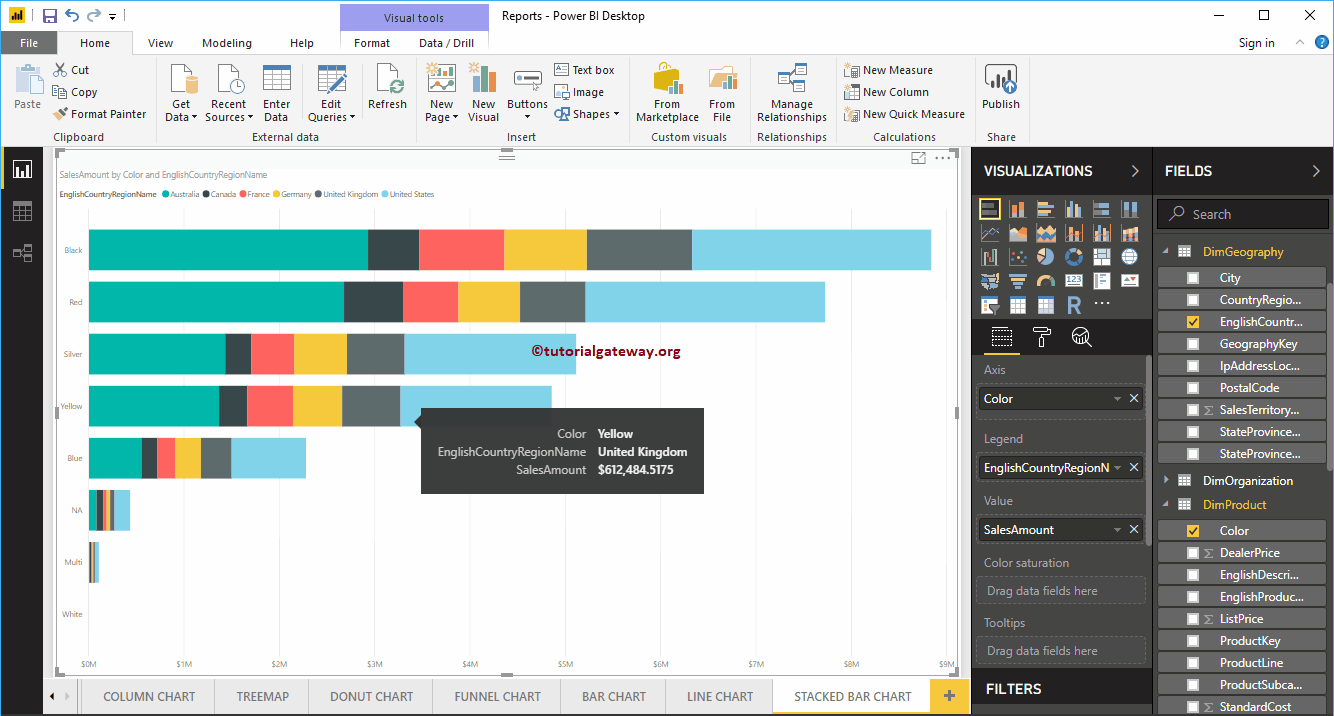
Hover over any stacked bar to display the state name, country, and sales amount tooltip
Create a Power BI Stacked Bar Chart Approach 2
First, click on the stacked bar chart below the Display section. Automatically creates a stacked bar chart with fictitious data, as shown in the following screenshot.
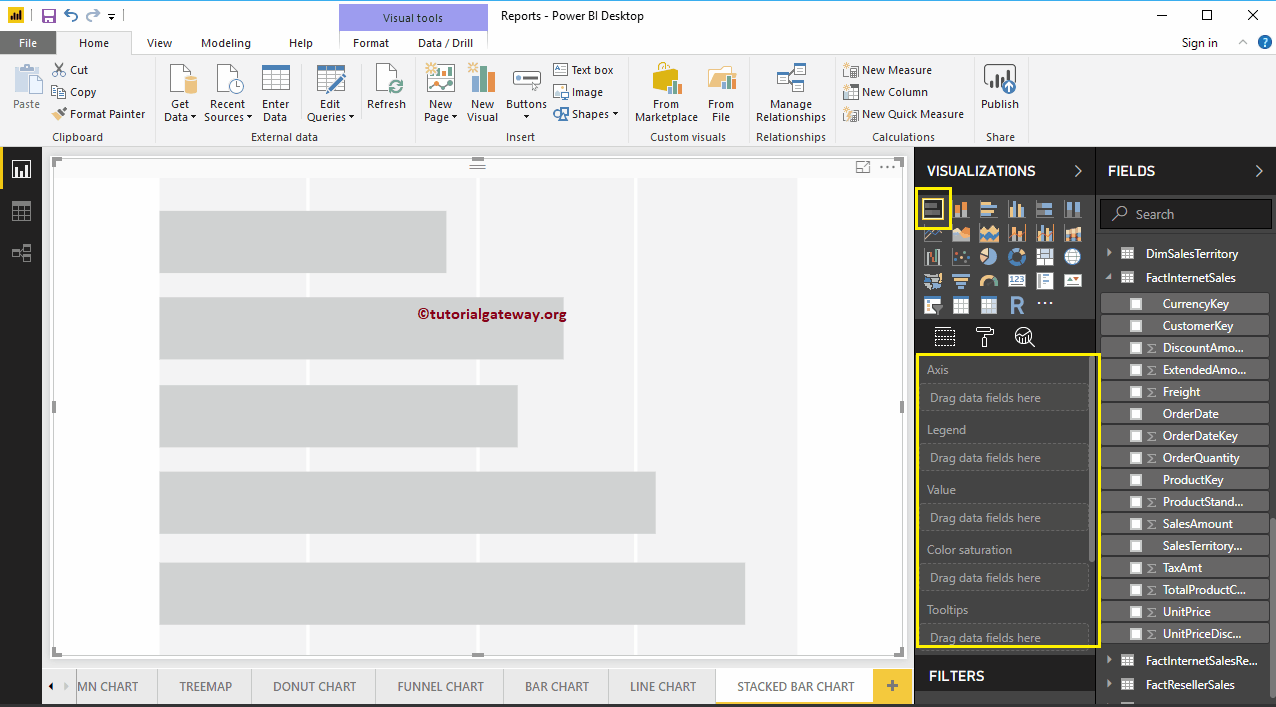
To add data to the Power BI stacked bar chart, we have to add the required fields:
- Axis: Specify the column that represents the horizontal bars.
- Legend: Specify the column to split the horizontal bars.
- Values: Any numerical value such as sales amount, total sales, etc.
Let me drag the sales amount from the Fields section to the Values field and the Color field to the Axis section.
Next, add the English country region name from the DimGeography table to the Legend section. You can do this by dragging Country to the Legend section, or just check the Country Region Name column in English
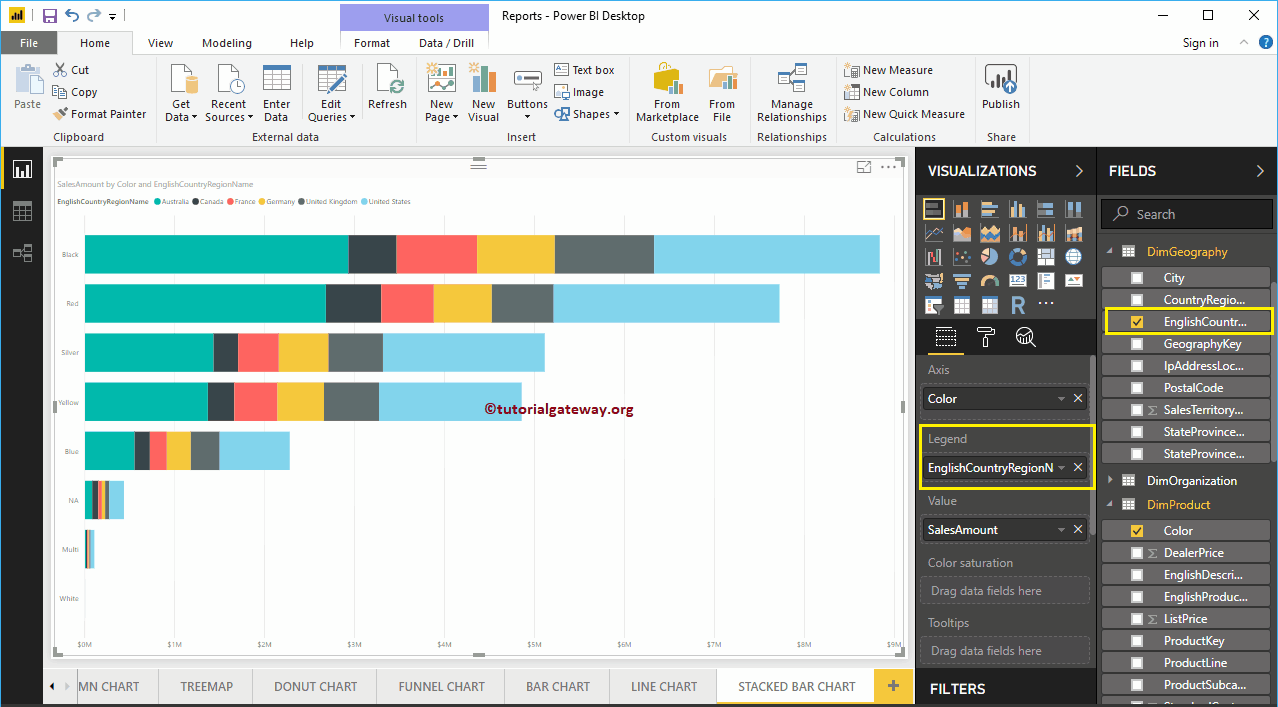
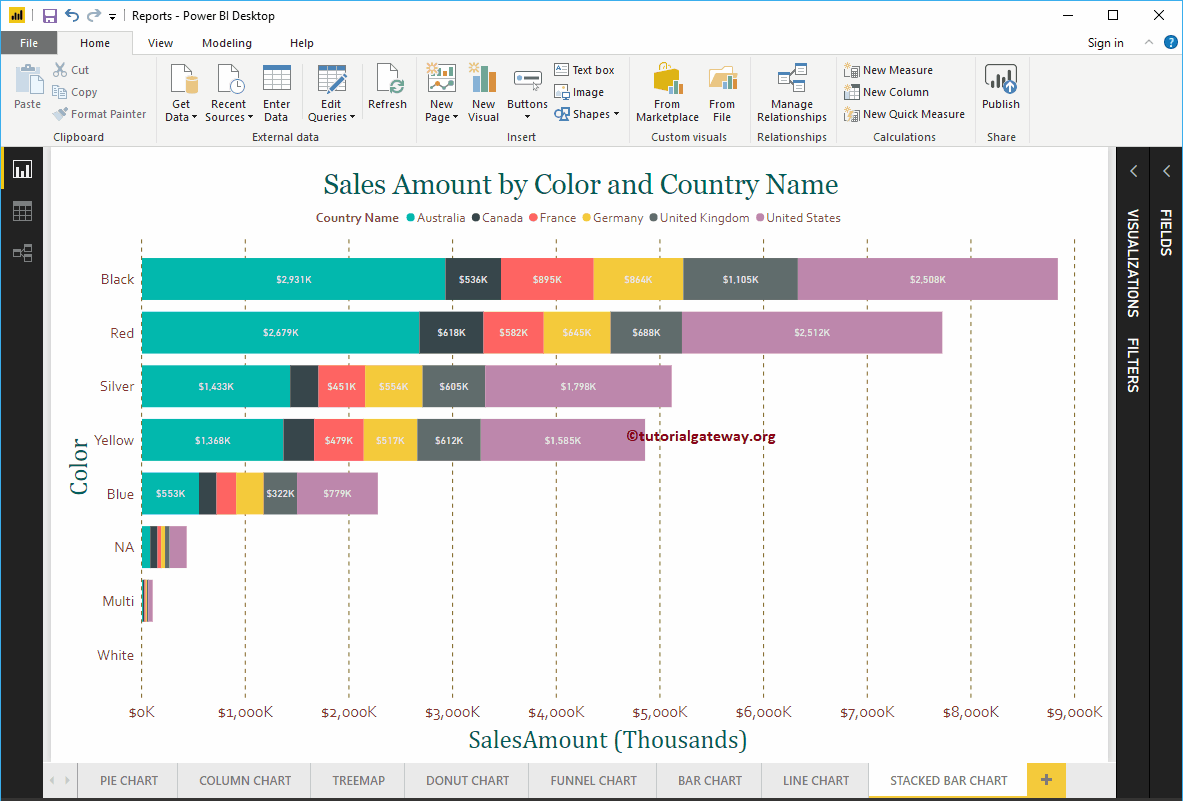
You can now see a stacked bar chart representing sales by color, further divided by country name. Hover over any part of a bar that displays the Tooltip for Color, Country, and your Sales Amount.
Let me apply a quick format to this Power BI stacked bar chart
NOTE: I suggest you refer to the Format Stacked Bar Chart article to understand the steps required to format the stacked bar colors, chart title, data color, background color, axis colors, style, and colors. axis sources, etc.