How to format the line chart in Power BI with an example? Formatting the Power BI line chart includes changing line colors, text ...
Read More
Power BI report-level filters are used to filter the visual (or graphic) elements present on all pages of a report. For example, if your report ...
Read More
How to use DAX aggregate functions in Power BI with examples? Microsoft Power BI DAX provides various aggregate functions, which allows us to perform aggregations such as calculating sum, average, ...
Read More
How to format the Power BI ribbon chart with an example? Formatting the Power BI ribbon chart includes changing the colors of the ribbon, the ...
Read More
In this study, we show you how to connect Power BI to text files and how to get data from a text file to Power BI. To demonstrate the obtaining of ...
Read More
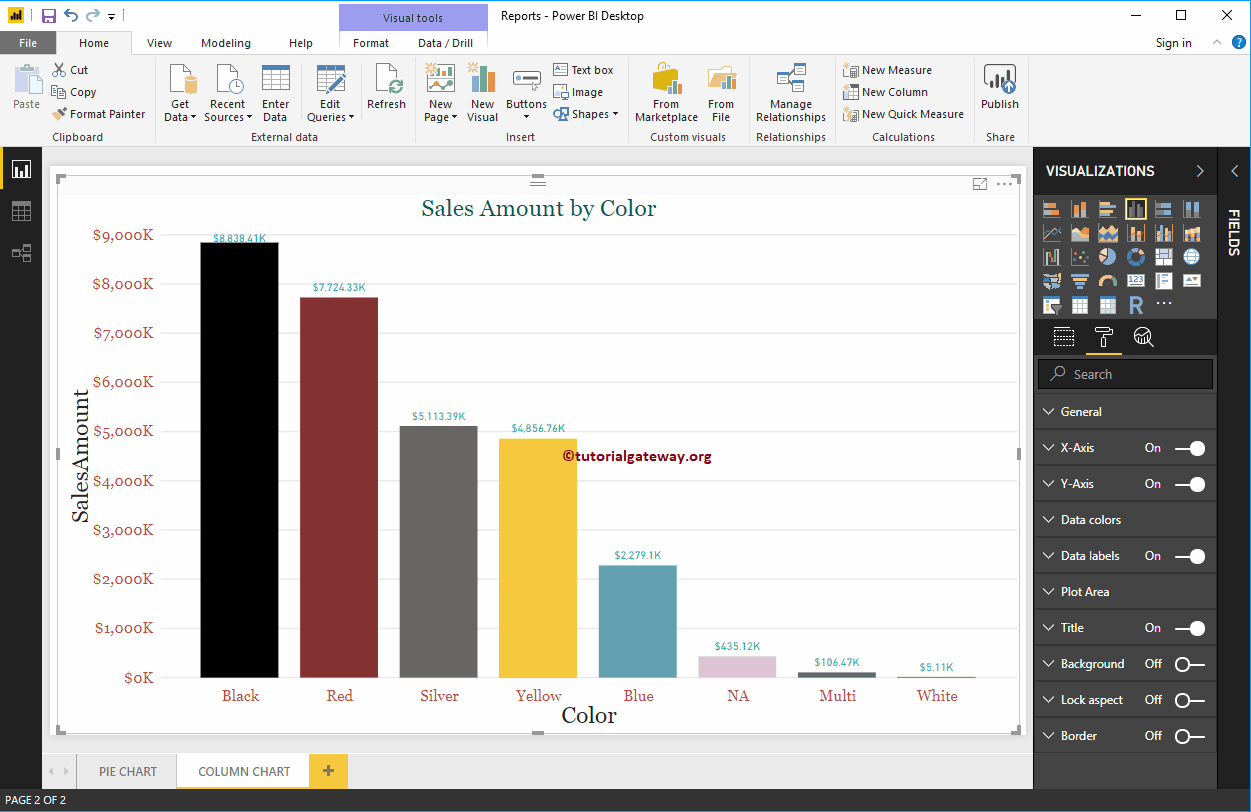
The Power BI column chart is very useful for visually comparing categorical data. For example, if we want to compare Sales by product group or Color, we can use ...
Read More
Power BI Q&A helps you ask business questions or perform natural language data analysis. In this case, we show you the uses of Power BI Q&A with a…
Read More
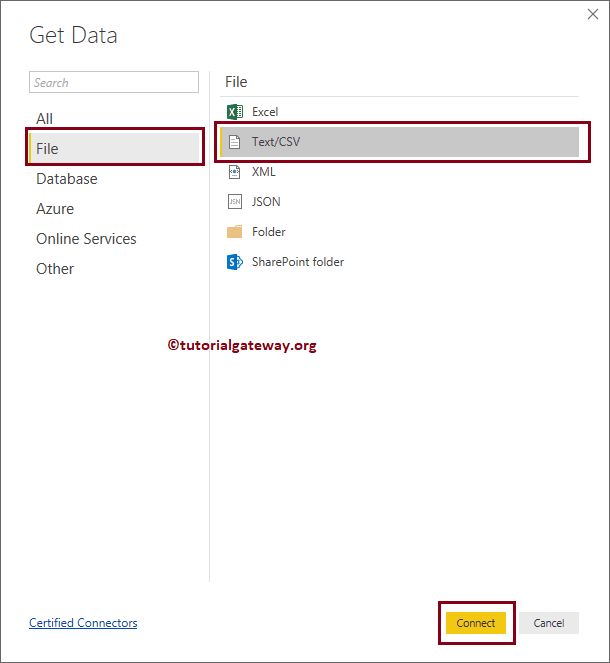
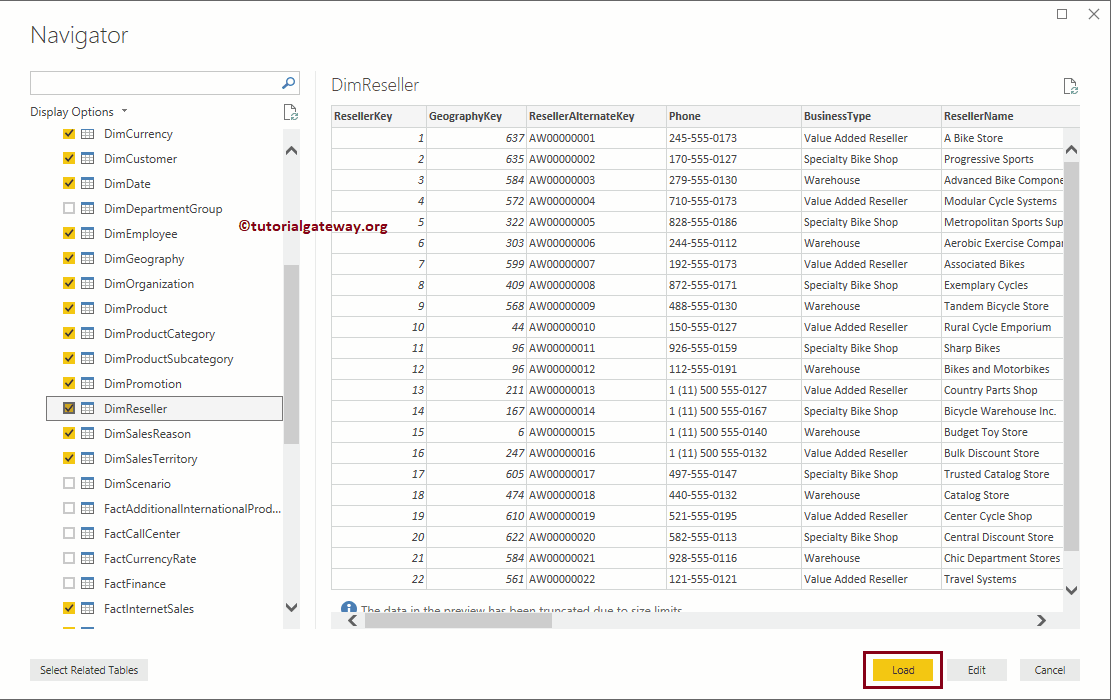
Let's take a step-by-step approach to connecting Power BI to SQL Server database. In addition to this Connect Power BI to SQL Server, how to use queries ...
Read More
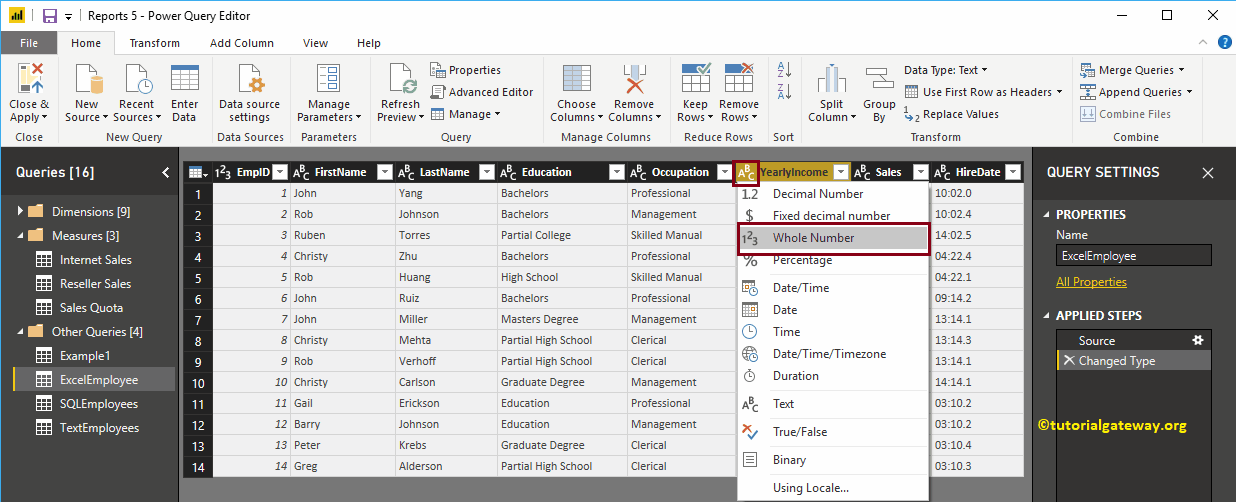
Generally, when you load a table from any data source, Power BI automatically detects the data type of a column. However, there may be some situations where ...
Read More
How to format Power BI line and clustered column chart with an example? Formatting your Power BI line and clustered column chart includes ...
Read More