Power BI Q&A helps you ask business questions or perform natural language data analysis. In this case, we show you the uses of Power BI Q&A with a practical example. Before we dive into the questions and answers, let me show you the existing dashboards in my Power BI workspace.
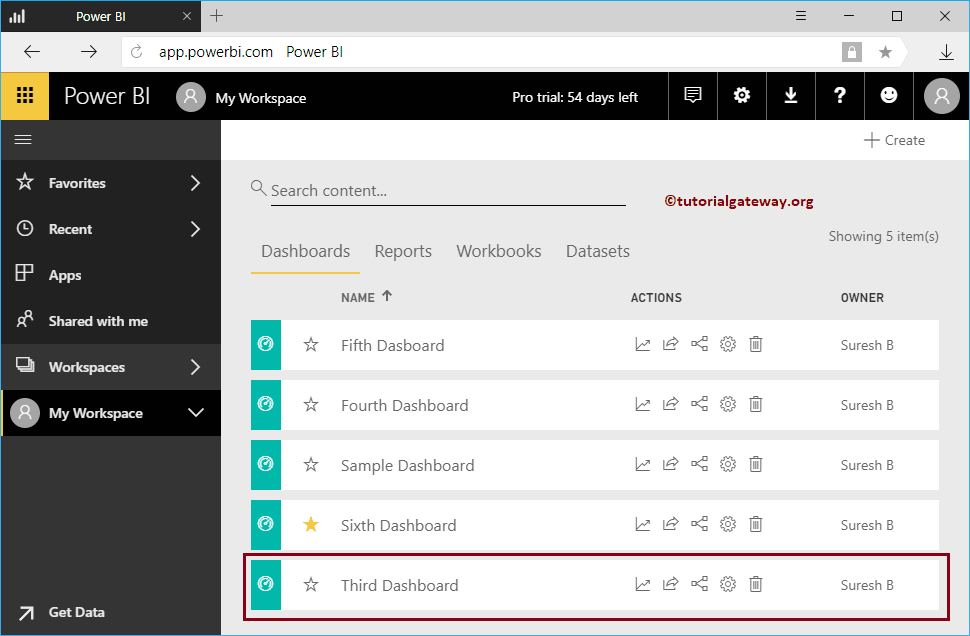
To see them, click on Power BI My Workspace and then go to the dashboards tab. In the screenshot below, you can see that there are five panels.
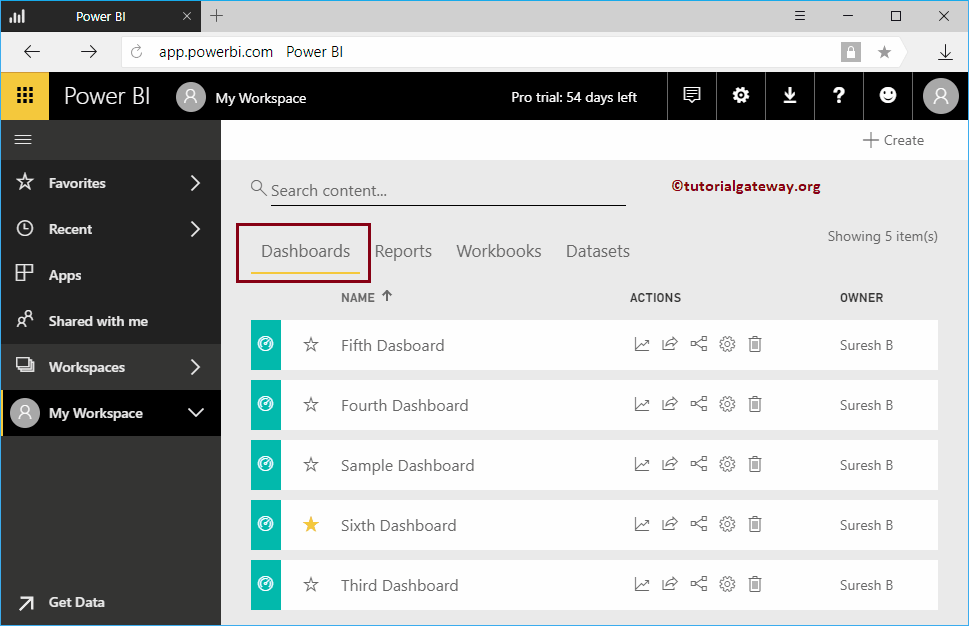
In this example, we use the third panel to demonstrate the questions and answers. Click on it to view the reports for this dashboard.
Power BI questions and answers
In the Power BI screenshot below, you can see some text Ask a question about your data. It is the place where we can write business related questions in natural or standard language.
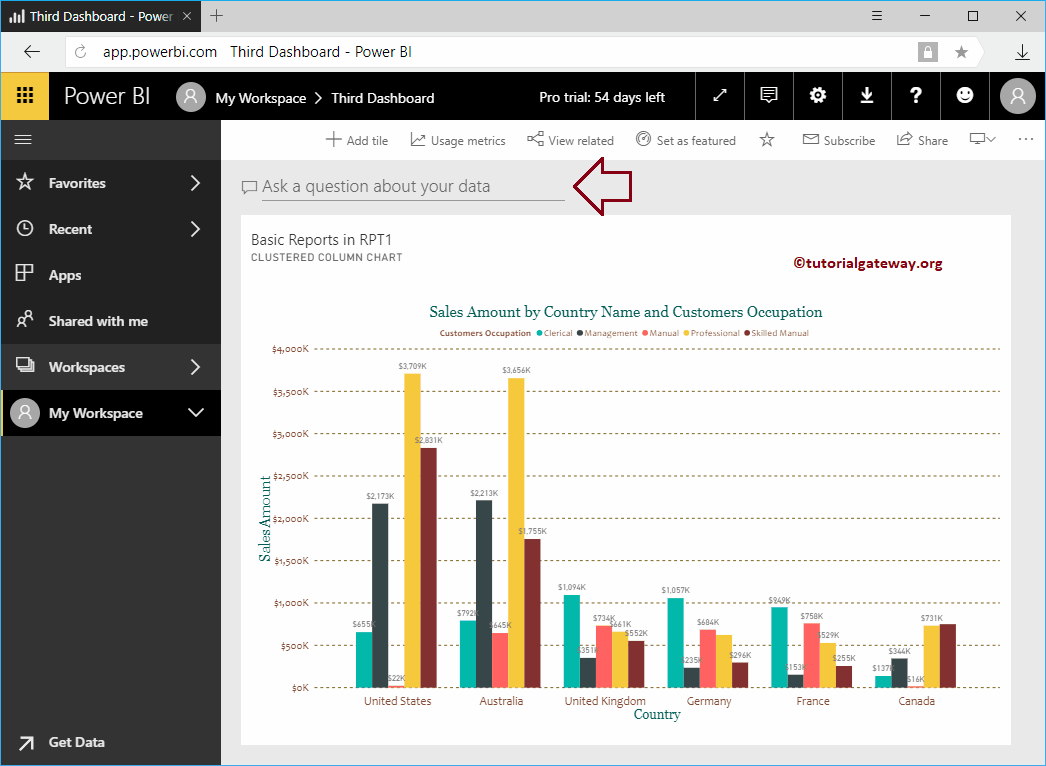
Once you click on that area, the following window will be displayed
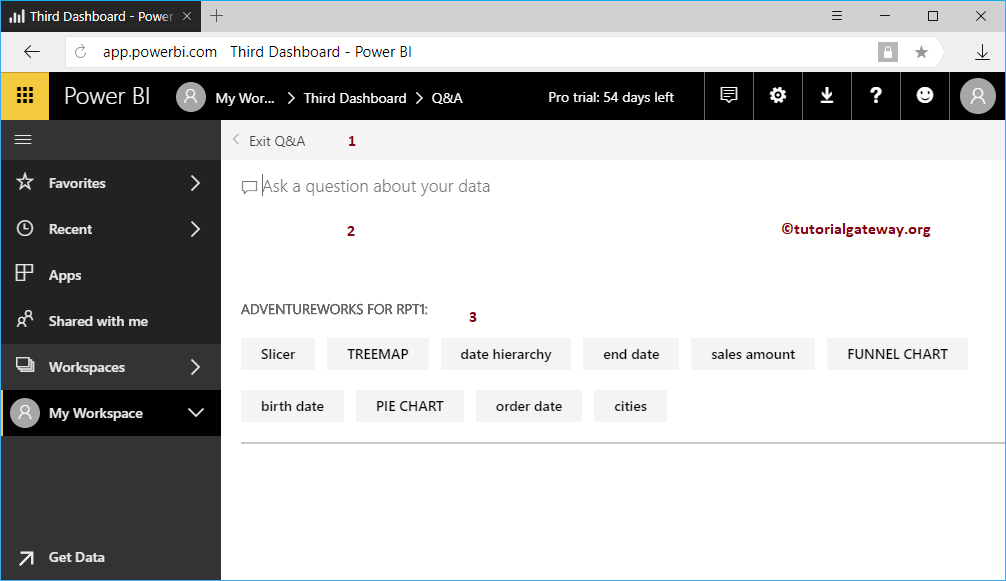
- Exit questions and answers: Use this button to exit this window. It will redirect you to the previous panel.
- Ask a question about your data: You can ask any questions related to the company or the data
- Suggestions: These tips are displayed based on the data, or you can predefine them
Remember, we design many pages from this data set. That is why it mainly shows those reports. In your case, it could be different. I mean it can show more words like cities, product sales, etc.
Power BI question and answer example 1
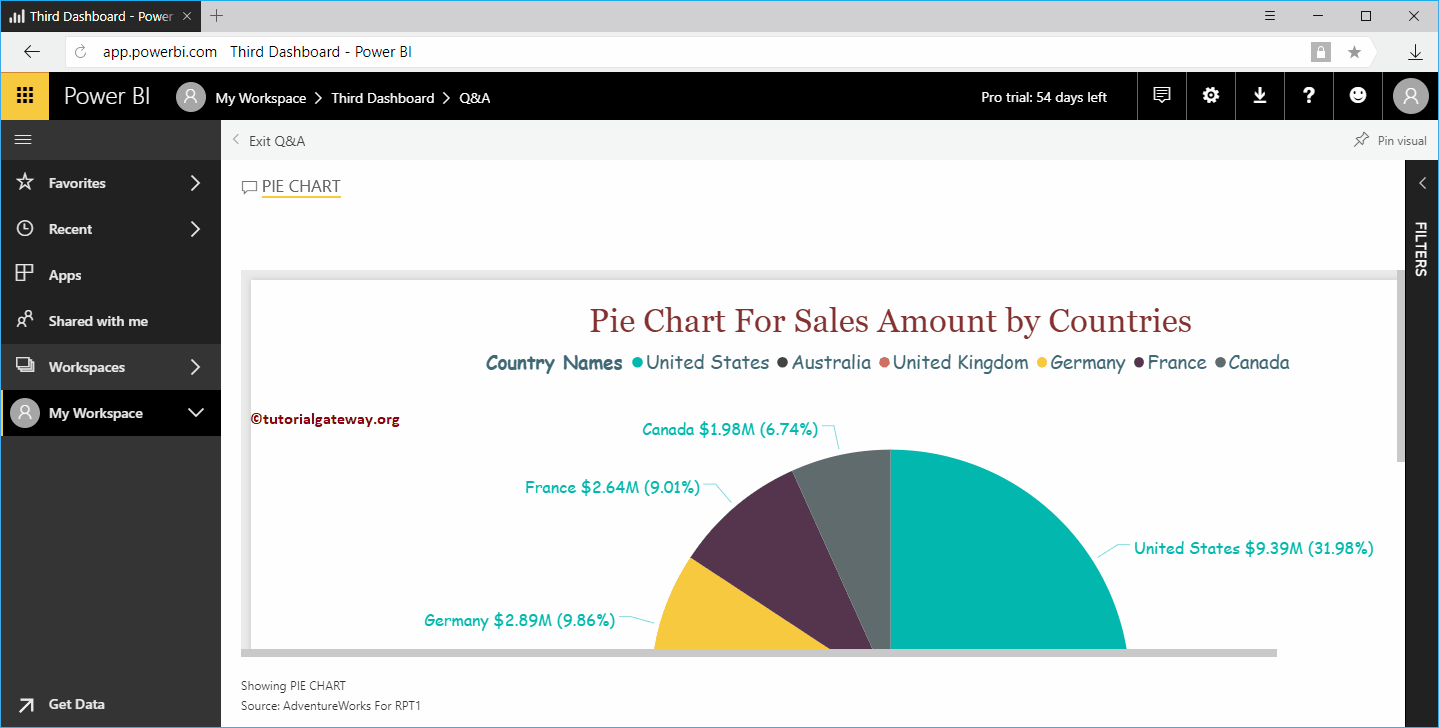
Let me select the pie chart
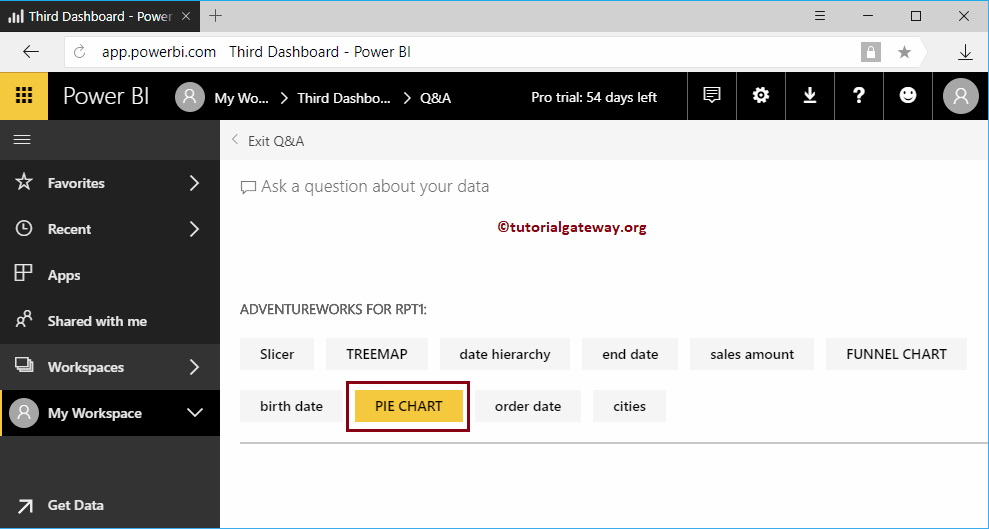
In the following screenshot you can see the pie chart that was already present in my report.
Power BI question and answer example 1
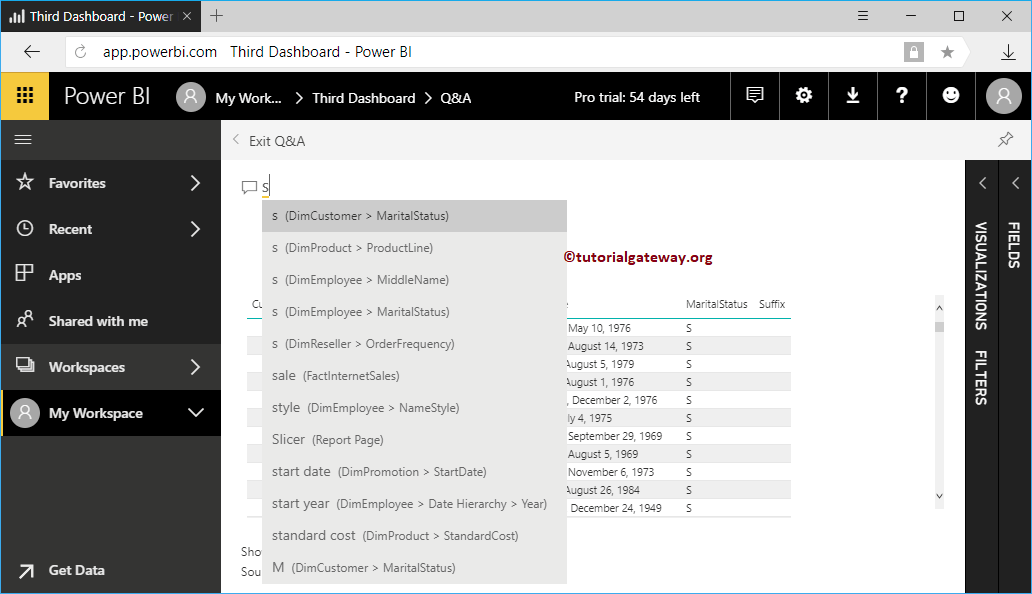
Apart from the predefined scenarios, you can ask your own business questions. Remember, Power BI intellisense is fast enough to provide suggestions and also displays the visuals that best fit the question.
From the screenshot below, you can see, when I typed s, shows all the possibilities that match S and also draws a table with the martial state S.
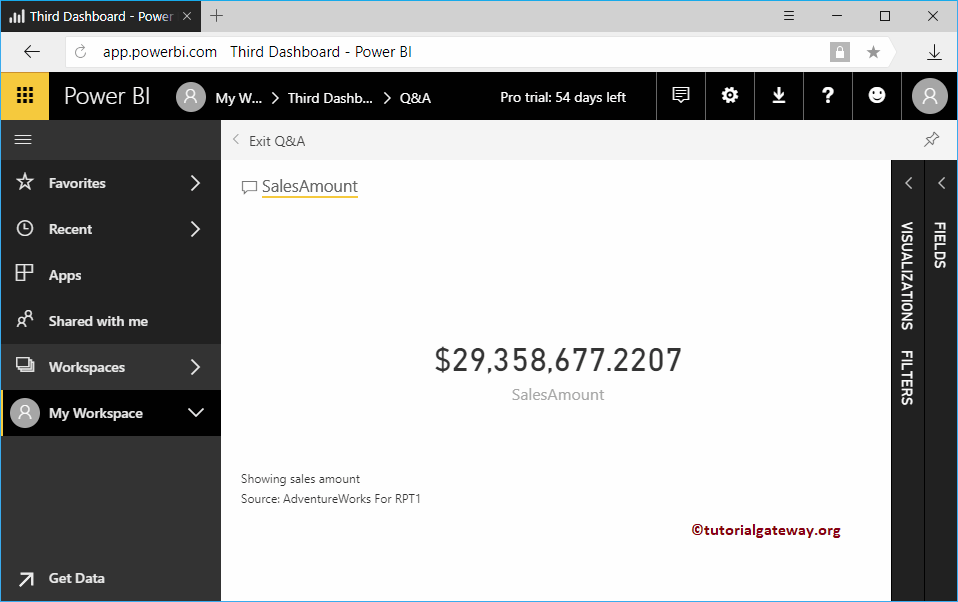
Let me select the sales amount from Fact Internet Sales
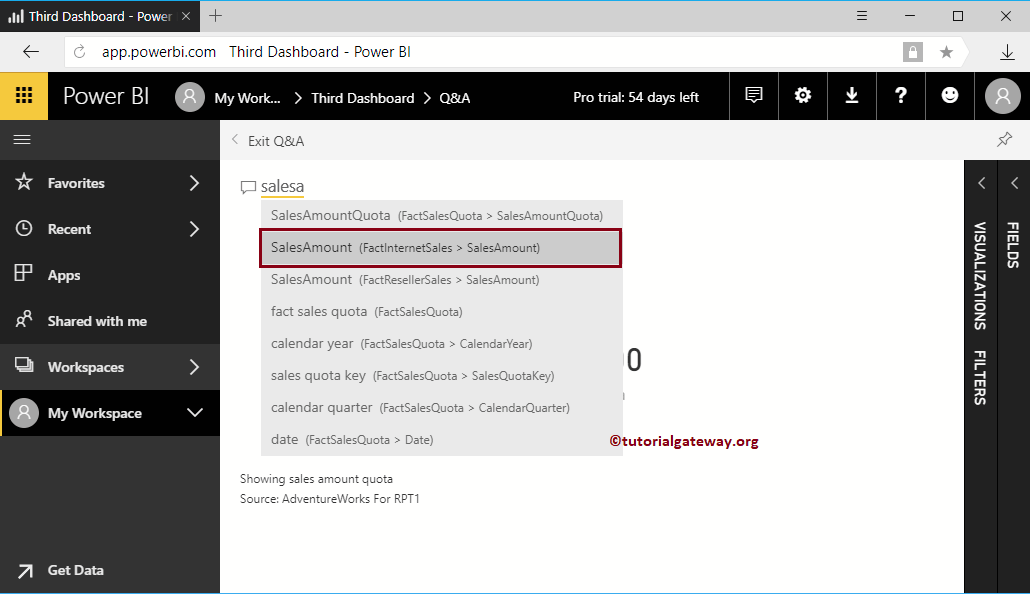
The moment I select the sales amount, the total sales amount card is displayed.
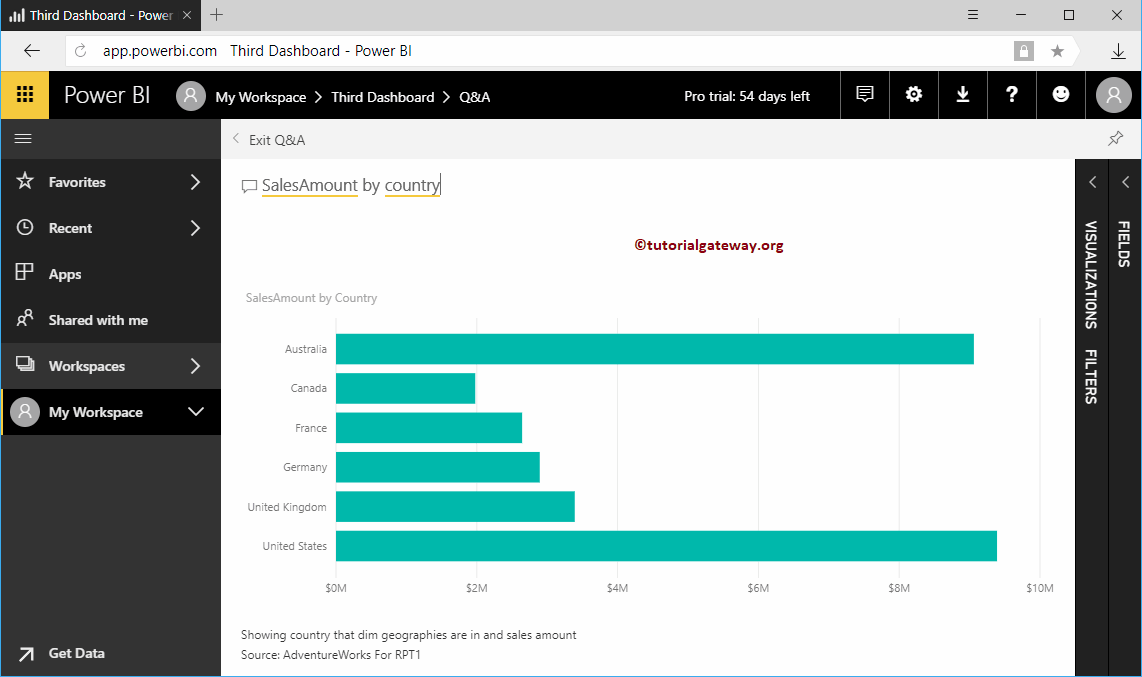
Let me ask for sales by country

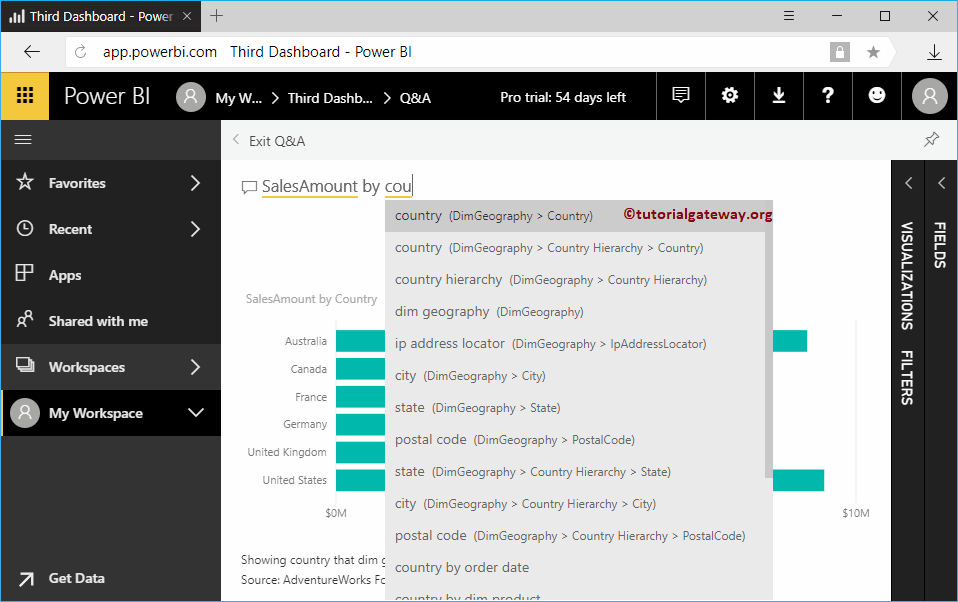
You can see the bar chart showing sales by country.
TIP: You can use the Pin button in the upper right corner to Pin this visual to the Dashboard. And you can use the Visualization, Filters, and Fields tabs to customize this visual to your needs.

Power BI question and answer example 2
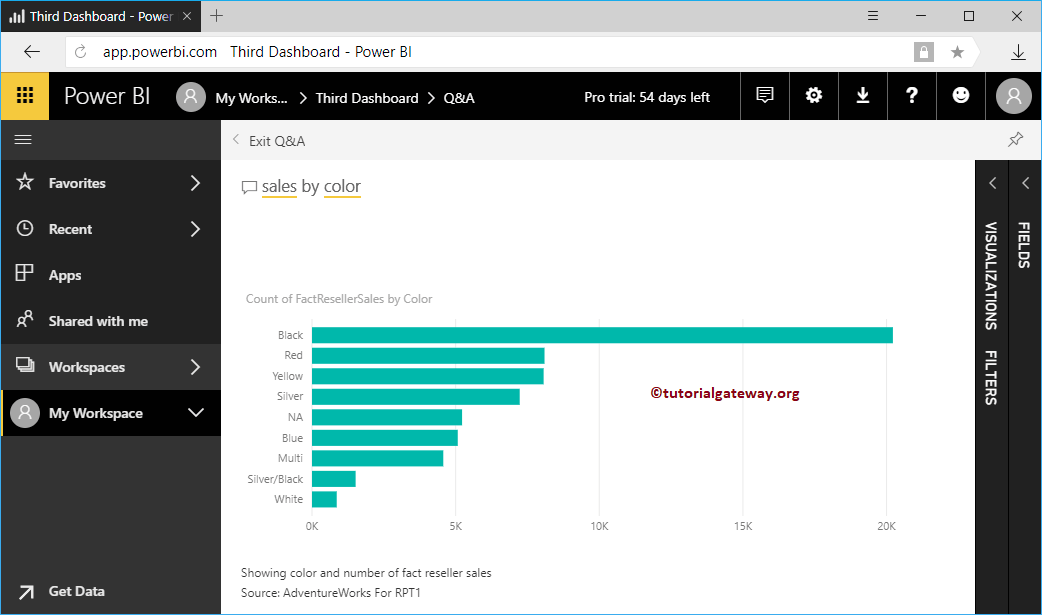
This time sales by color

Power BI question and answer example 3
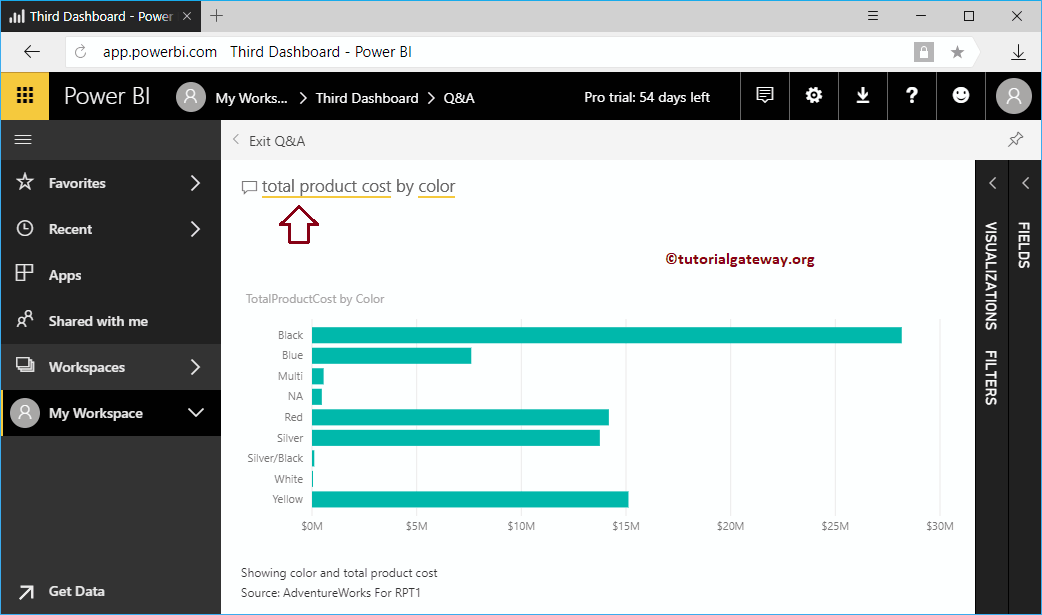
In Power BI Q&A, when you click the yellow underlined term, you can replace it with another field. Let me select Sales and replace it with Total Product Cost
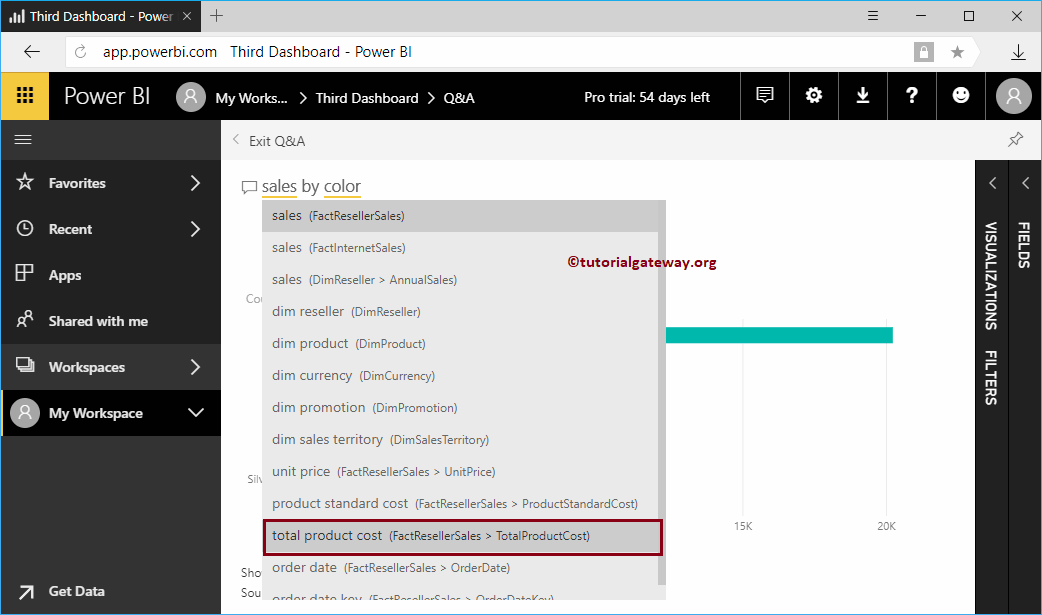

Now you can see the bar chart showing the total cost of the product by color

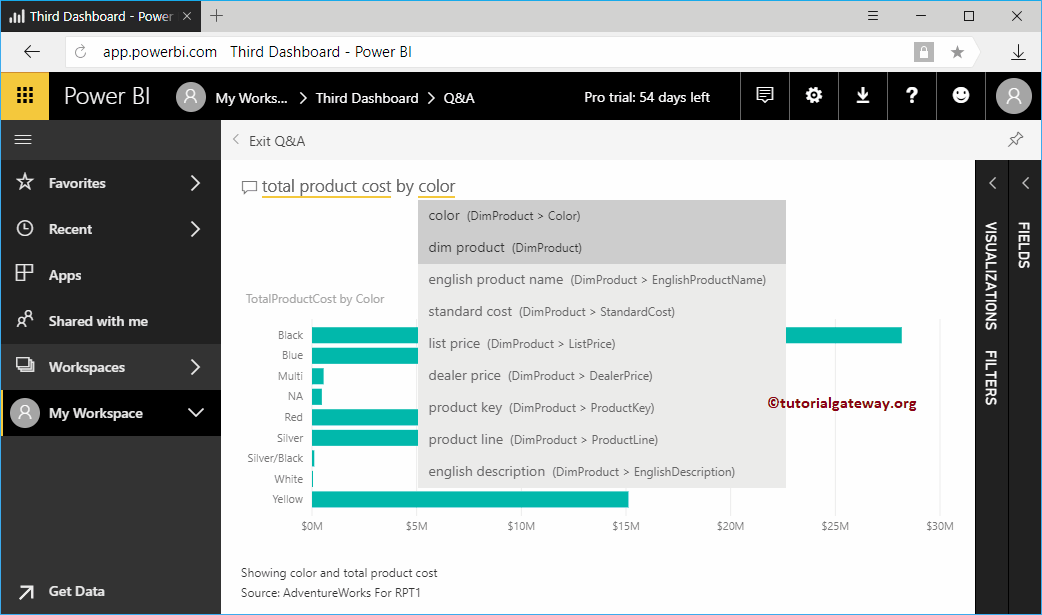
You can also try replacing the term Color.

Power BI question and answer example 4
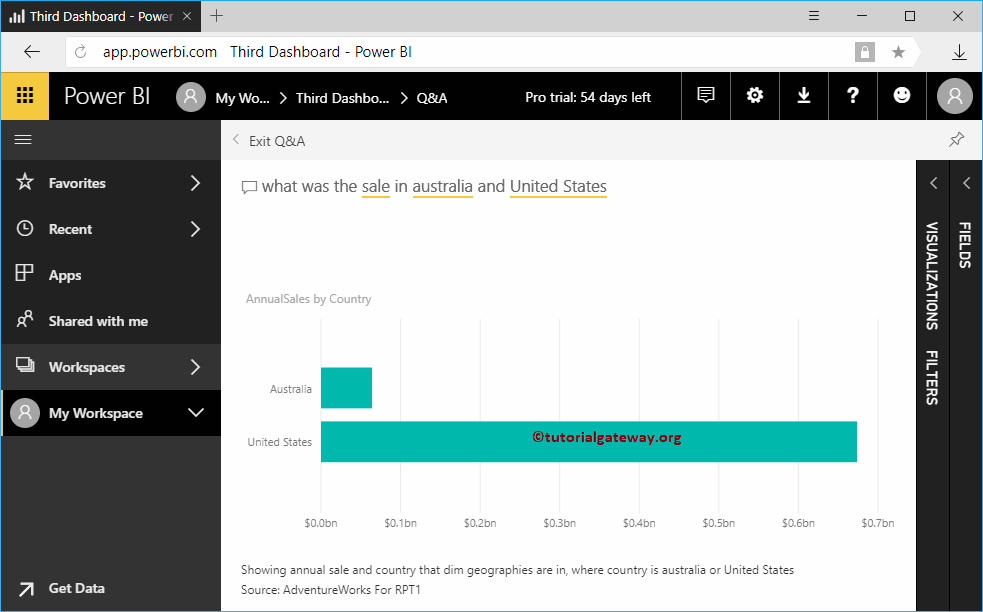
This time we use a regular question. I mean, a standard question
In the below screenshot, you can see what the result shows.