Guides and tutorials

Power BI

Articles so you can learn to master Power BI. We have more than 300 guides and tutorials on the most important business management tool of the moment. In this blog we are going to focus on the most productive facet of the application with dashboards that are for professional, personal and educational use.

subscribe-power-bi-dashboard-5-3736584-6069235-png
Power BI

Subscribe to the Power BI dashboard

In this section, we show you the step-by-step approach of the Subscribe Power BI dashboard with a practical example. Before starting the subscription process for a panel of ...
simple-multiple-fact-table-data-model-1-5693365-7214372-png
Power BI

Four fundamental differences between the Tableau and Power BI data models

Time to read: 4 minutes Tableau recently released a logical data model in version 2020.2, while a similar semantic layer has been critical to Microsoft Power BI since…
create-calculated-measures-in-power-bi-3-8168034-7945860-png
Power BI

How to calculate measures in Power BI

In Microsoft Power BI, you can create a custom calculated measure (or numerical aggregate calculation) from existing columns. In this article, we show you how to create calculated measures in Power ...
Power BI
How to add an image to the Power BI dashboard
power-bi-advanced-filters-8-9668999-1403250-png
Power BI
Advanced Power BI filters
edit-power-bi-app-6-7709886-2777552-png
Power BI
How to edit the Power BI app
customize-power-bi-qa-suggestions-4-2528478-2331111-png
Power BI
Customize Power BI question and answer suggestions
power-bi-dashboard-actions-2-5008872-1000886-png
Power BI
Power BI dashboard actions
power-bi-dax-trigonometric-functions-10-8152120-4104950-png
Power BI
Trigonometric functions in Power BI DAX
how-to-sort-a-chart-in-power-bi-6-5716580-1509494-png
Power BI
How to sort a chart in Power BI
power-bi-slicer-17-8356259-9975112-png
Power BI
Slicer in Power BI
power-bi-qa-advanced-5-4697869-5314343-png
Power BI
Power BI Advanced Questions and Answers
create-groups-in-power-bi-22-4070016-2912151-png
Power BI
Create groups in Power BI
share-power-bi-workspace-4-8436090-3763773-png
Power BI
Share your Power BI workspace
power-bi-funnel-chart-4-7744744-8874220-png
Power BI
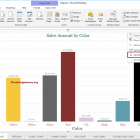
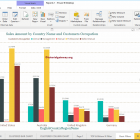
Power BI funnel chart
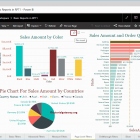
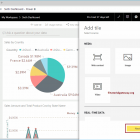
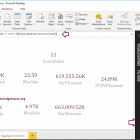
What is Power BI?

Power BI is the collective name for a variety of cloud applications and services that help organizations collect, manage, and analyze data from a variety of sources, through an easy-to-use interface. Power BI gathers and processes data into intelligible information, often using visually appealing and easy-to-process charts and tables.

This allows users to generate and share clear and useful snapshots of what is happening in their business. Power BI connects to a variety of data sources, from basic Excel spreadsheets to databases and applications both in the cloud and on our company's servers.

Power BI is a general term and can refer to a Windows desktop application called Power BI Desktop, a software-as-a-service (SaaS) online service called Power BI service, or Power BI mobile apps available on phones and tablets. Windows, as well as for iOS and Android devices.

Power BI is built on Microsoft Excel, and as such the learning curve from Excel to Power BI is not that steep; Anyone who can use Excel can use Power BI, but Power BI is much more powerful than the spreadsheet.

+ Productivity

Best Free Power BI Articles

Surely you are looking to optimize the delivery of information and reporting in your company or enterprise.How many hours have we spent creating spreadsheets and formulas What do we use in our home or office?

With a good dashboard in Power BI you can save hundreds of hours of work. We want to share with you our selection of tutorials and guides for Power BI.