How to get a custom visual from Power BI if it no longer appears in AppSource

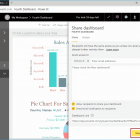
Reading time: 4 minutes AppSource is the digital marketplace where Microsoft makes many complementary resources available for a variety of products. This marketplace includes custom visuals from Power…
R Digital Marketing14/08/2022