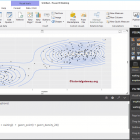
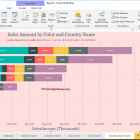
Create a ribbon chart in Power BI

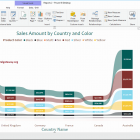
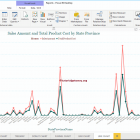
The Power BI ribbon chart is useful for quickly identifying which categorical data has the highest rank (large values). Let me show you how to create a tape chart ...
R Digital Marketing18/09/2022