MapSVG is a nifty WordPress plugin that helps you to create interactive and responsive maps on your WordPress site. Thanks to a suite of nice features, you can convert any SVG file into an interactive map. That's not all, you can create detailed floor plans, infographics, Google maps, Chloropleth maps, image maps and so much more.
In this review, we look at the features that make MapSVG one of the best mapping plugins for WordPress on the web. We also test drive the plugin, so stick around and read all the way to the end. This is definitely a good deal, so get yourself a mug of coffee and let's roll.
MapSVG Interactive Maps for WordPress
Brought to you by developer extraordinaire Roman Stepanov, MapSVG makes creating interactive maps easy and fun. I had a great time playing around with the various options even though I had to read the documentation first. That being said, let's look at the features available in MapSVG.
100+ Ready Maps
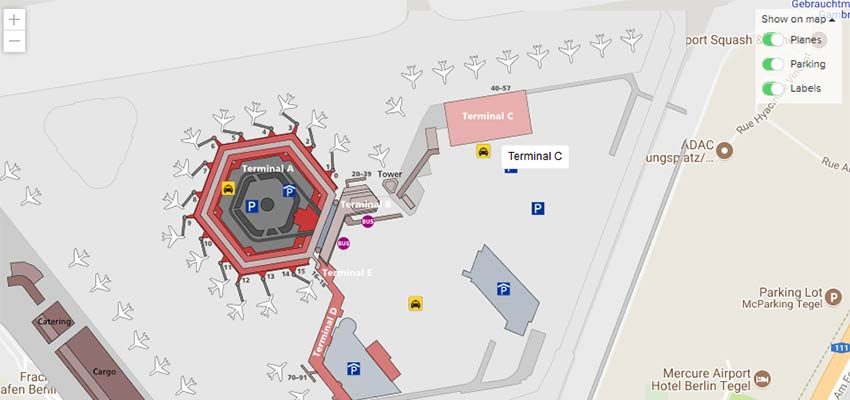
To help you hit the ground running, MapSVG comes with over 100 geo-calibrated maps. There is a world map, and it's already subdivided into clickable regions (countries). Then you have country maps with the respective states / provinces. You also get a few special maps.
And since most of the maps are calibrated, you can add markers to the maps using an address or coordinates. On top of that, you can create your own SVG maps and upload them to MapSVG.
All you have to do is create an SVG image using any vector editing software such as Inkscape or Adobe Illustrator, upload the damn thing and customize away.
Do you know what this means? It means you can design interactive diagrams and visualize statistics (and generally improve user experience) without bending over backwards.
Database Objects
MapSVG allows you to create objects and add them to specific areas of your map. This allows you to enrich your maps with information offering your web visitors an immersive experience.
For purposes of illustration, let us assume for a minute you are a real estate agent with properties to sell all over the country. You're doing really well and would like to show available properties on a map. You'd like to display information such as size, address, price, photos and stuff like that.
MapSVG allows you to add these details to a database, and then attach the info to one or multiple areas of your map. Whenever a user clicks on the area you define, say a state, the details are displayed in a nice popover, detail view or tooltip.
Filterable and Searchable Directory
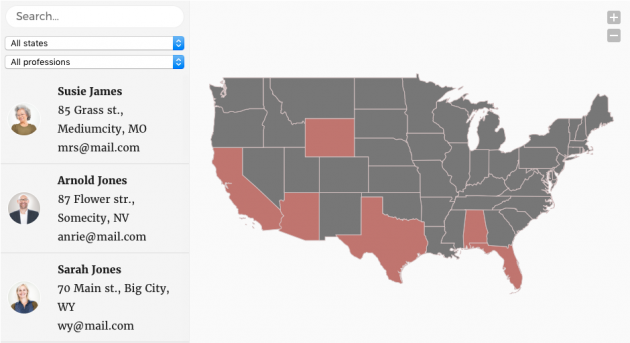
As if adding database objects isn't enough, MapSVG allows you to create a directory and display it next to your map. Going with our real estate analogy, you may want to show all properties (or agents) available in a certain state. MapSVG makes this very much possible.
Users can filter items in the directory using drop-down filters or a search box. Further, users can filter objects by clicking a specific area on the map. This directory feature makes even the most complex diagrams and maps easy to comprehend. Additionally, users can find information easily which is a plus for your UX.
Enhance Google Maps
Did I mention you can integrate MapSVG with Google Maps? Yes, you can and you just need a Google API key. Typically, you cannot customize Google Maps extensively, which is or can be limiting in some scenarios. MapSVG enables you to overcome this challenge.
How? You can layer vector maps on top of any type of Google Map (terrain, satellite, road or hybrid). And since vector images are interactive, you can then modify your Google Map until you drop. The obvious end result here is you're able to provide more usability.
Remember Google maps come with a set of controls. Couple these controls with MapSVG features and you'll literary drive your users crazy with excitement. They will be like, "How the heck did they do that?" This feature allows you to enhance your Google map by highlighting landmarks and making anything clickable.
CSS, JavaScript, and Templates Editors
What is the use of a map you can't customize or extend? Roman seems to have this grounded what with nifty CSS and JavaScript editors. As long as you know your way around code, you can push your interactive illustrations to the limit.
For starters, you can style your maps and diagrams with CSS as you desire, and without breaking a sweat. You can style many elements from tooltips, popovers, and other info containers. On top of that, you can leverage the power of JavaScript to extend default map functionality.
Additionally, you get a templates editor that helps you to create custom templates for popovers, markers and tooltips. The template editor is easy to use we don't expect you to run into any problems.
Intuitive Control Panel With Live Preview
Working with MapSVG is pretty much straightforward thanks to an intuitive admin dashboard that makes creating maps a breeze. Creating maps and other interactive illustrations with MapSVG is coupled with ease from start to finish.
On top of that, the plugin comes with a live preview feature that lets you see your changes in real time. Now you don't have to wonder how your maps will look upon completion. Further, you don't have to go to and fro (or refresh a page) to see how your maps look. How sweet?
Image Maps
We mentioned image maps a few minutes ago, but I had to cover this feature on its own because I think it's impressive. We already know that MapSVG converts SVG files to interactive maps automatically. Just draw an SVG file, upload it and customize.
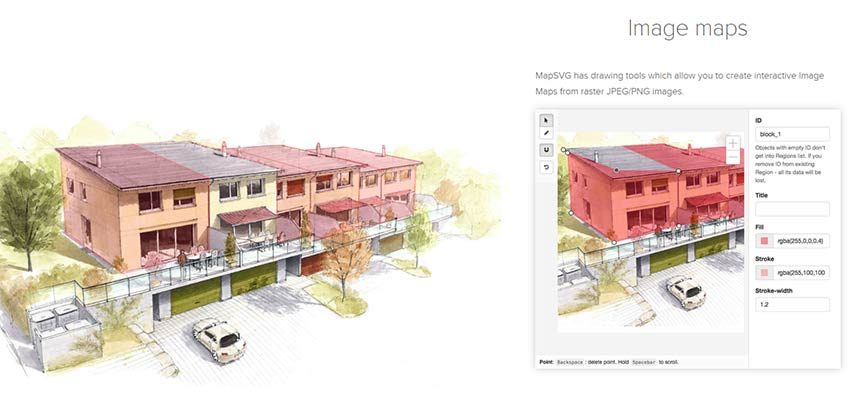
But did you know you can also create maps from PNG and JPEG images? Sounds interesting now, right? MapSVG comes with brilliant drawing tools that allow you to create interactive (clickable) maps from raster images. How is this useful? You can draw interactive house plans, blueprints, routes, city plans, seating charts and so much more.
Thanks to these features and amazing support, nothing should hold you back from creating maps and interactive illustrations out of this galaxy. The sky is the limit here guys since MapSVG is a no-nonsense (and probably the best) map plugin for WordPress.
How To Setup MapSVG and Create A Map
Setting up MapSVG is as easy as installing any other typical WordPress plugin. You're ready to start creating interactive maps as soon as you install and activate the plugin. You don't need to configure anything since MapSVG works right out of the box.
Get MapSVG
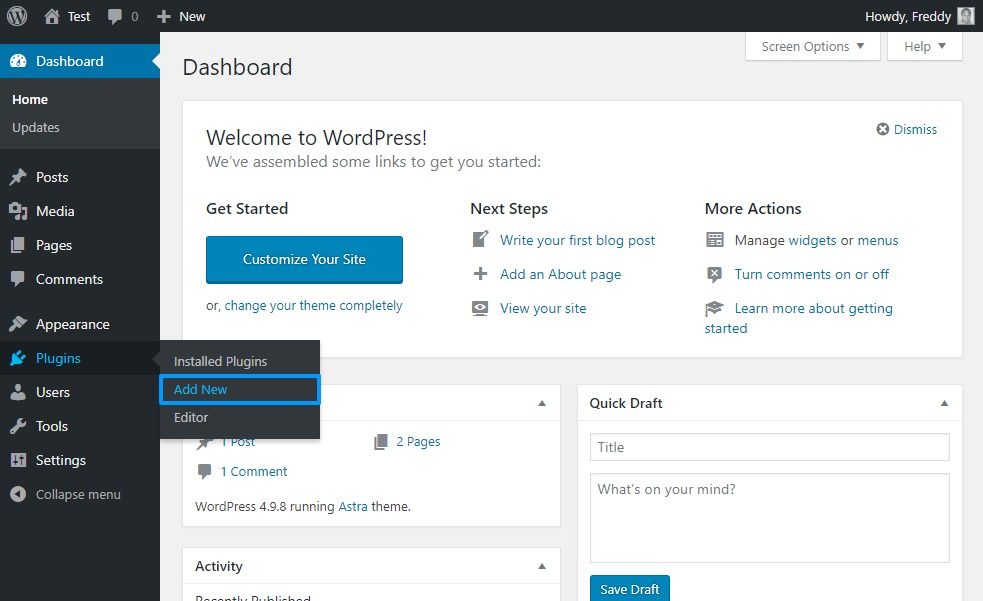
Let's get some hands-on experience. Grab a copy of MapSVG, and follow the following instructions. Login to your WordPress admin dashboard and navigate to Plugins> Add New.
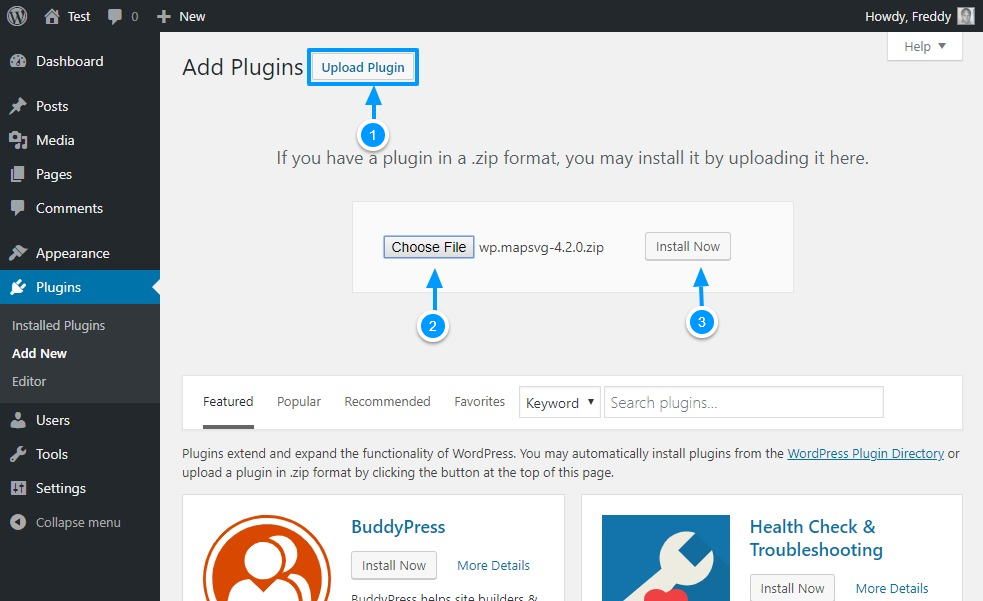
Next, hit the Upload button (1), Choose File (2), and hit the Install Now (3) button as shown below.
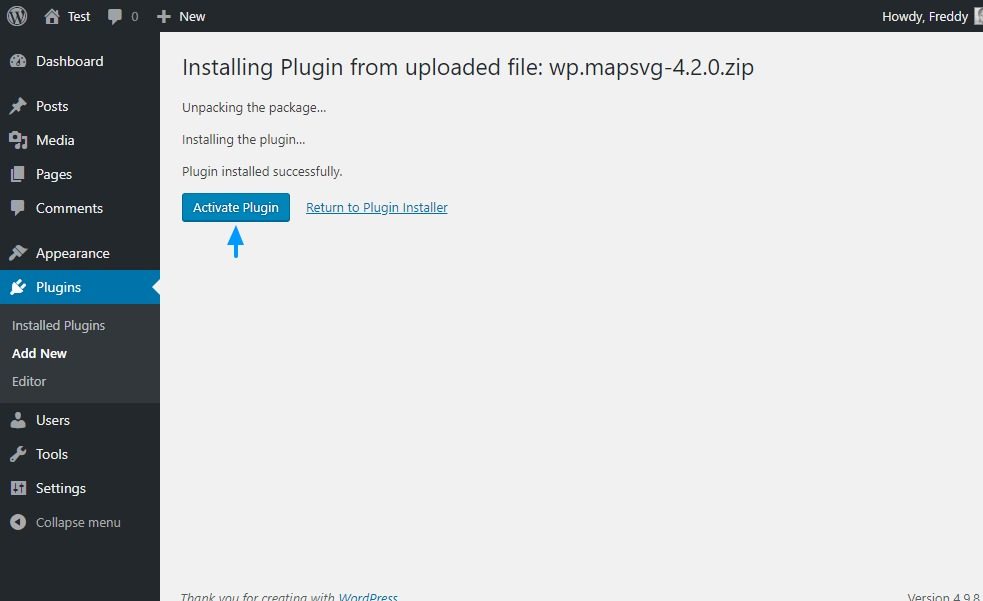
Wait out the installation process to complete and then click the Activate Plugin button.
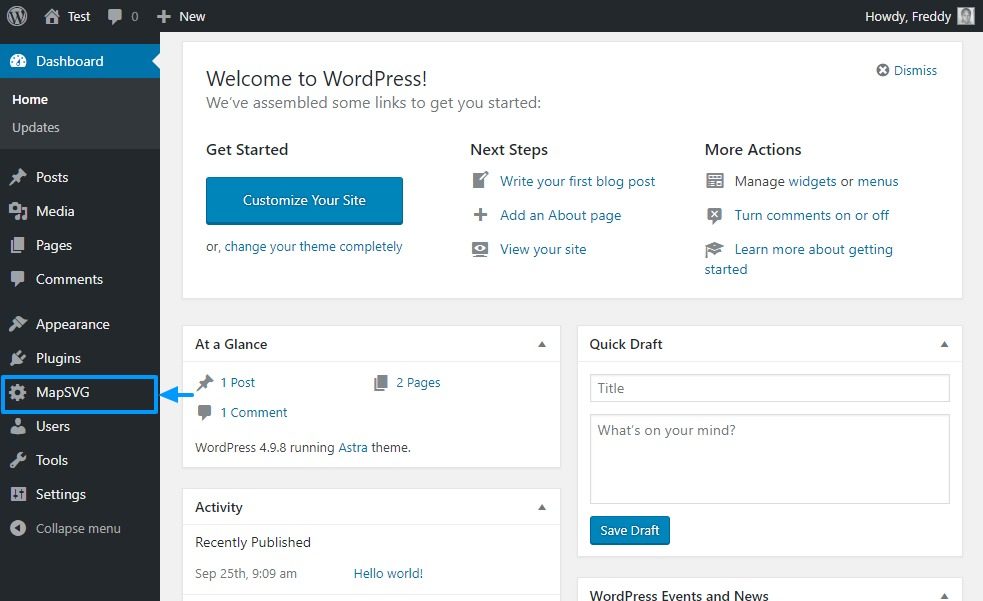
And that's it; the plugin is ready to use after activating. Click on the MapSVG item on the WordPress admin to launch the control panel.
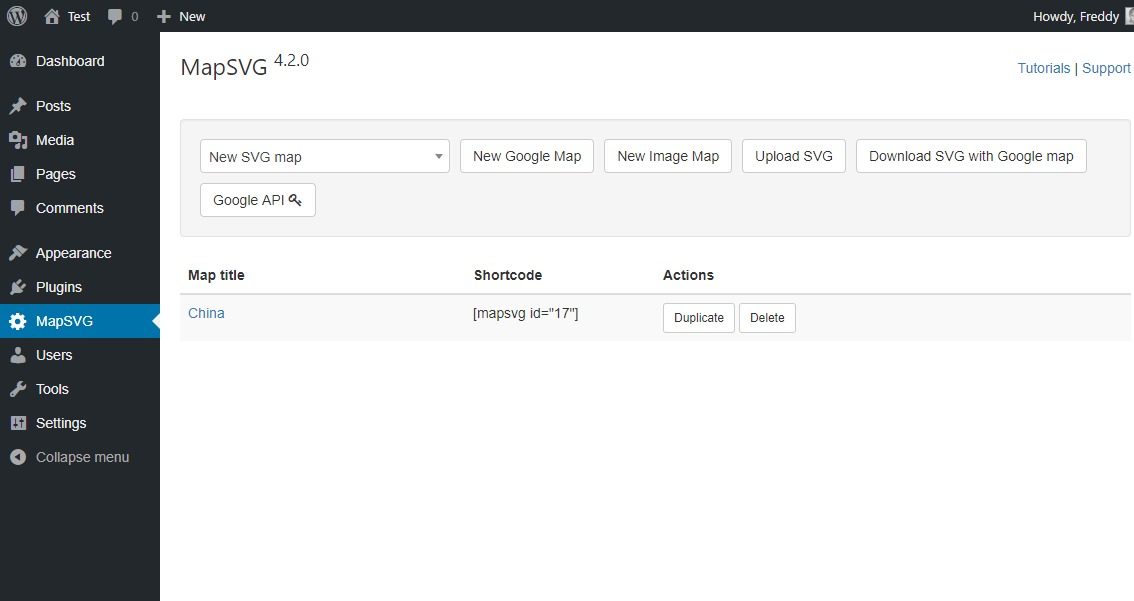
So far so good, I think you will agree the process is simple. On the control panel, you can choose one of the pre-made maps, create a Google map (needs integration first, which is as easy as copy-pasting an API key), build an image map, upload an SVG file or download an SVG file with Google map.
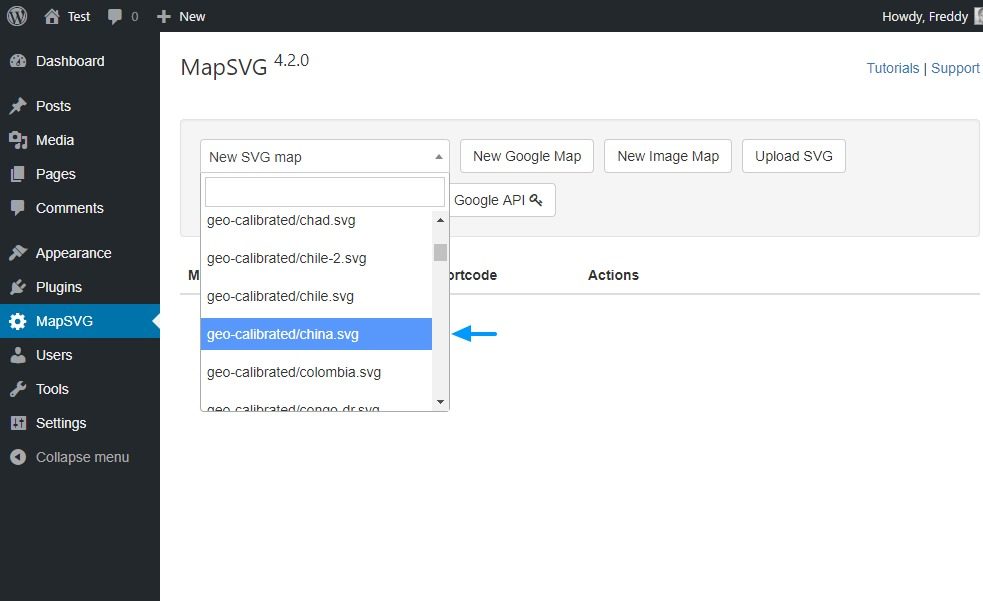
If you need help creating a map, you can get quick help by clicking Tutorials or Support links at the top of the control panel. Let's choose one of the pre-existing maps. I will go with China because everything is made there nowadays anyway 🙂
N / B: The developer recommends using geo-calibrated maps instead of not-calibrated maps because ...
… Geo-calibrated maps are newer, have Region titles and you can add Markers by geo-coordinates (latitude / longitude) or just by entering an address which is being converted into coordinates automatically. - MapSVG Tutorials
Choose China (or any other map you like) from the New SVG map drop-down menu. If you hate the scroll bar, feel free to use the search box.
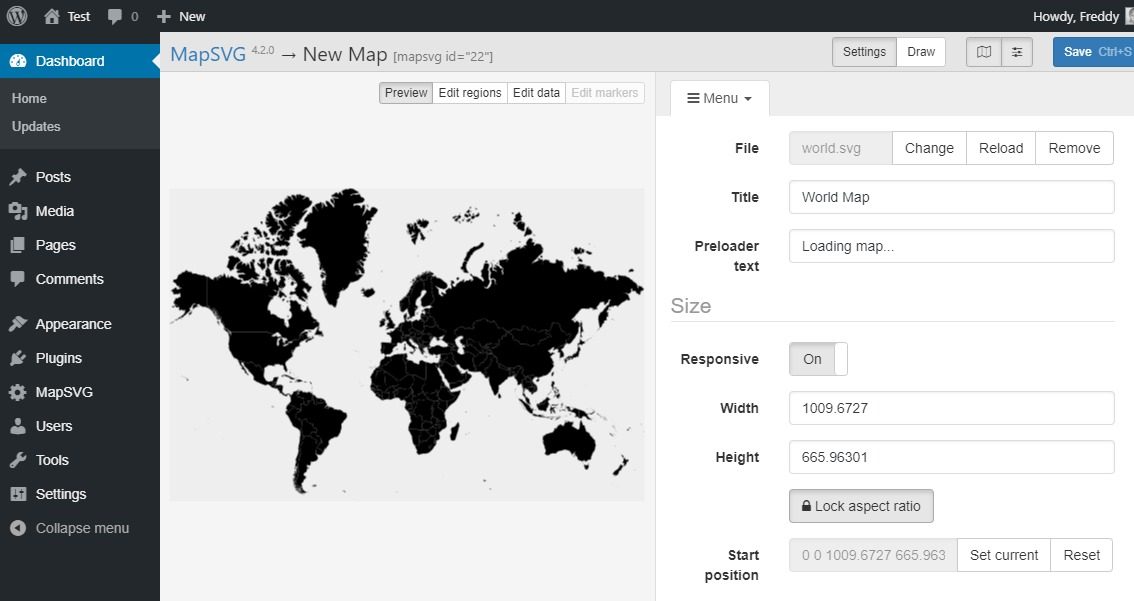
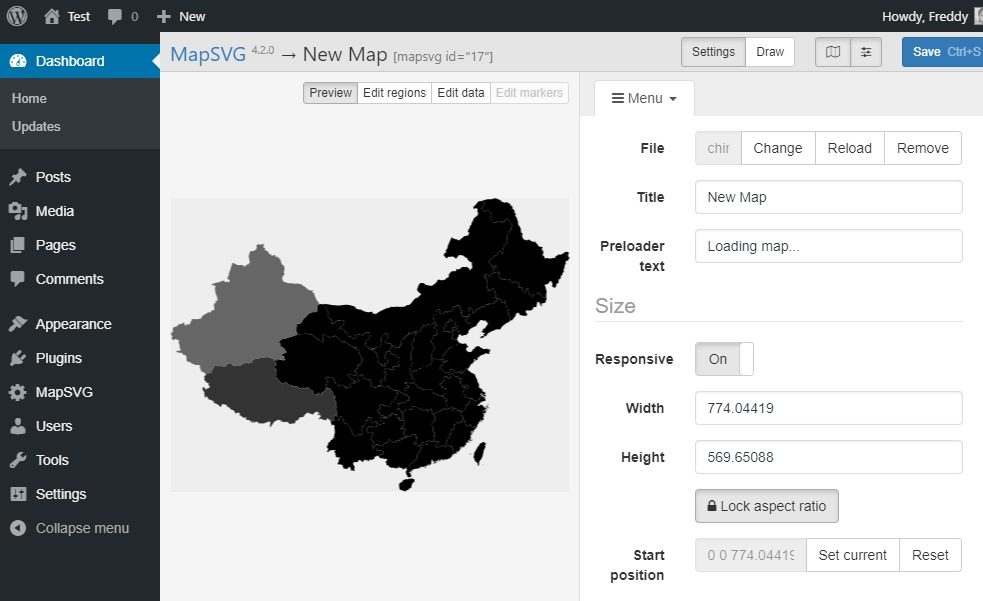
On the next screen, fill out the Title and change the Preloader Text if you're so inclined. On the same screen, you can set your map size, toggle off responsive design (it's on by default, so don't touch the dial), turn on tooltips and popovers among others things.
You will also notice the map is already split into regions (China provinces in our case) and they are already clickable! Also, familiarize yourself with the other controls including the Menu drop-down menu.
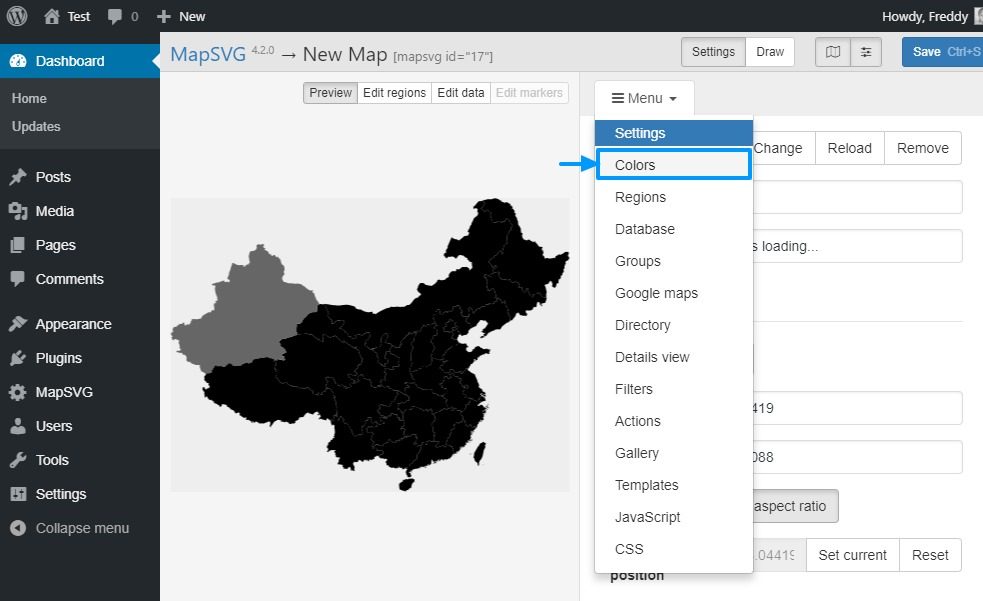
Let us change some colors, and get a feel of the plugin. Navigate to Menu> Colors as shown below.
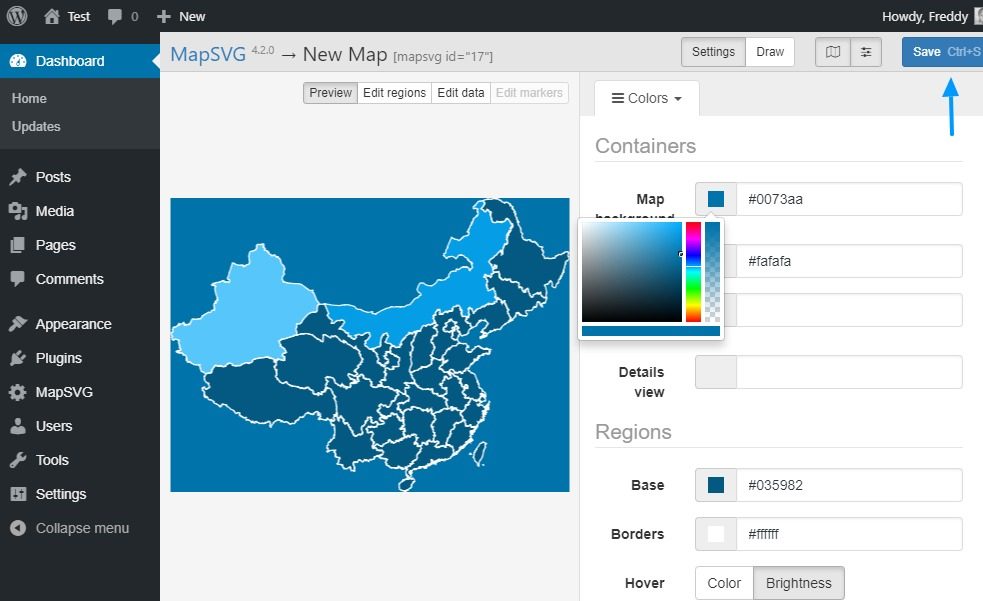
The Colors screen helps you to choose the colors of your dreams. What I mean is there is no limit to the colors you'd like to use. Just work the color picker until you have something you like. I will go with shades of blue because WordPress is bae 🙂
Choose your colors and don't forget to hit the Save Ctrl + S button as we illustrate below.
See? I told you MapSVG is easy to use. With a couple of clicks, I changed my map colors and it feels good - just like that one time, many years ago, when I ranked first in Google. Editing any other part of the map is equally easy, and to prove my point, I will add tooltips because that would be fun.
Adding Tooltips in MapSVG
So, how do you add tooltips that appear when you mouse over a region on your map? It's easy, and I'll show you how in a moment.
By the way, if anything isn't clear for one reason or another, don't hesitate to check out the official MapSVG tutorials and documentation. Better still, hit up the comment section at the end of this post and I will summon Thor just for you. That hammer solves everything 🙂
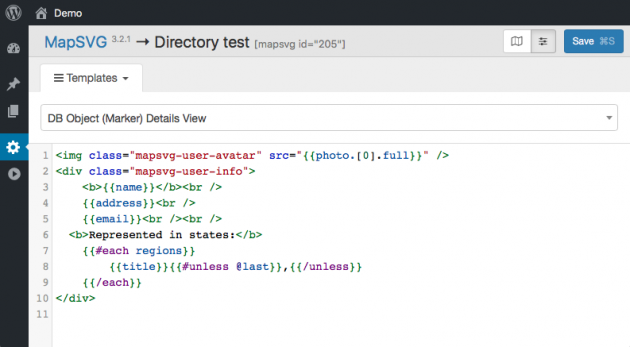
That aside, adding tooltips involves adding a template (remember the templates editor we mentioned earlier?). For that, navigate to Menu> Templates and then choose Region Tooltip.
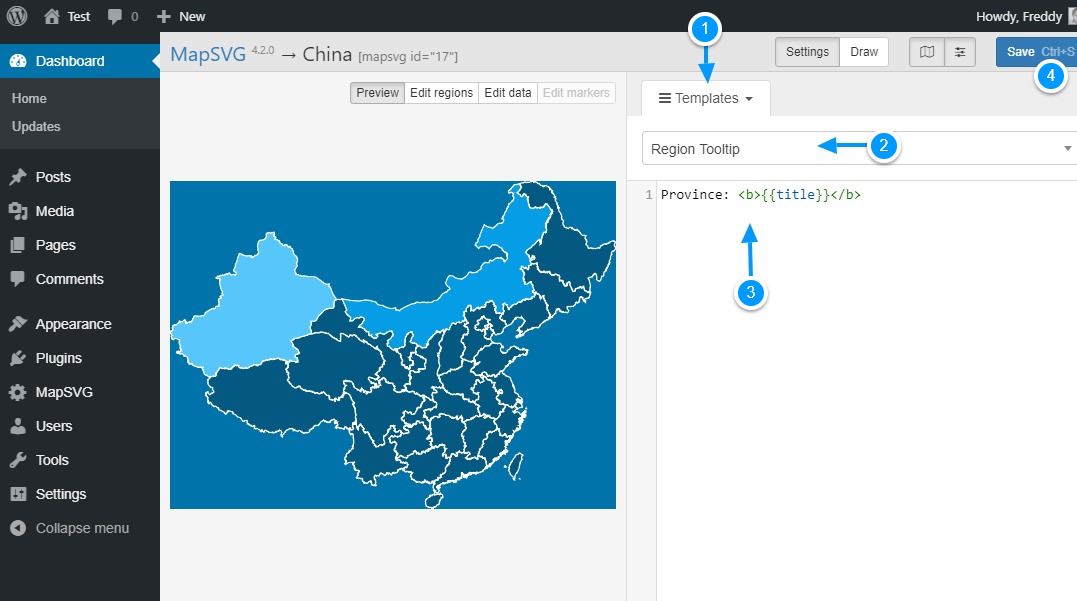
Next, add the following code in the templates editor and hit the Save Ctrl + S button as shown above.
Province: {{title}}The above code is simple HTML with Handlebars tags. If you'd like to show just the title of your region, you use the {{title}} tag. You can define your own custom fields too as you will learn in a moment. But first, let us turn on the tooltips feature.
Navigate to Menu> Settings and turn on the Tooltips feature as we illustrate below.
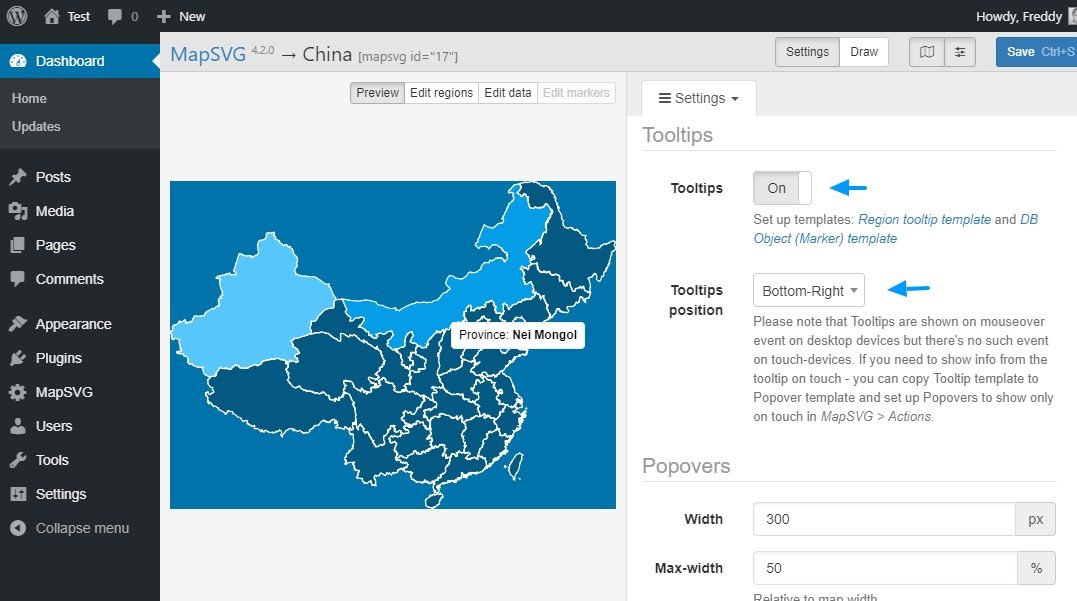
As you can see in the screenshot above, our tooltips are active. Still, I mentioned I will show you how to add custom fields so that you can enrich your tooltips in ways unimaginable. Let's say you would like to add photos and more information to your tooltips. How would you go about it? For that, we call upon the database objects we mentioned earlier.
Adding Custom Fields via Database Objects
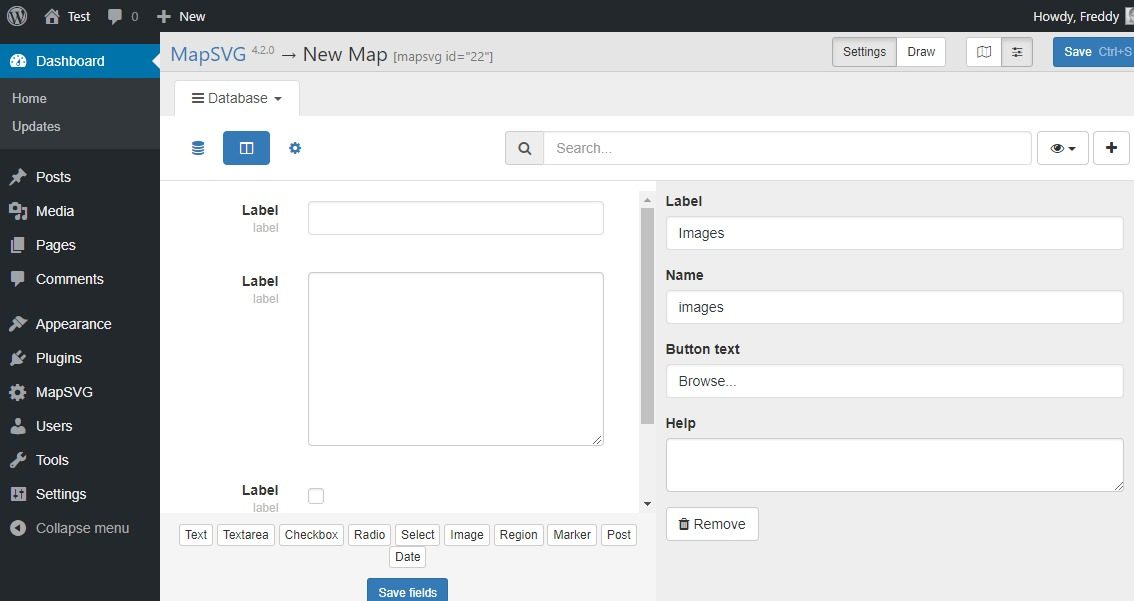
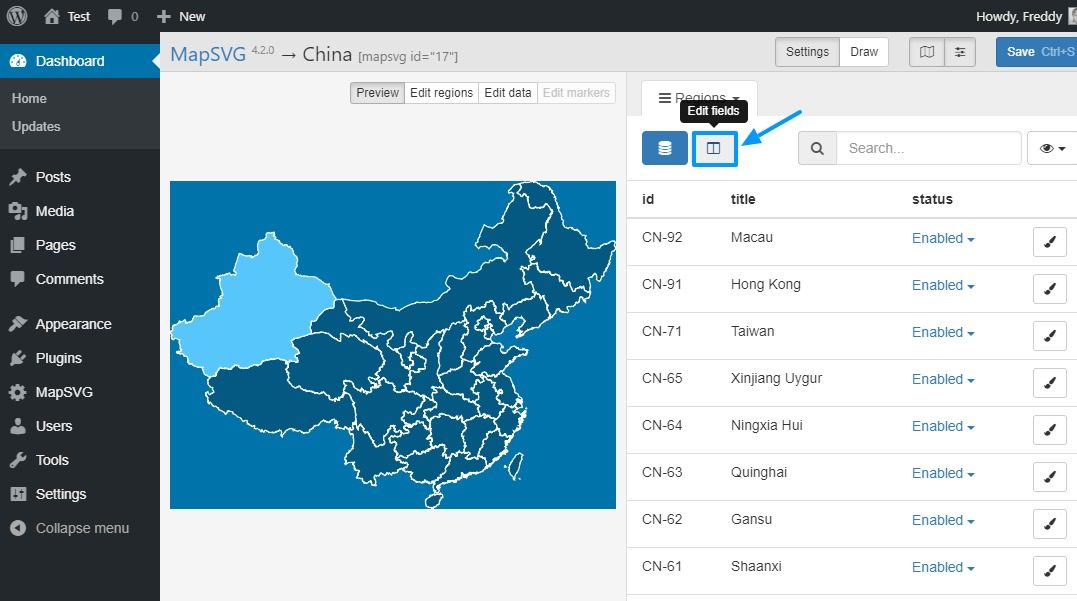
MapSVG allows you to add custom fields to your maps. We already have the {{title}} field, but let's see how we can add more custom fields. You have a choice of custom fields including text, textarea, checkbox, images, and so on. Let us add some images to the Nei Mongol province.
Go to Menu> Regions and click the Edit fields button as we highlight in the image below.
On the next screen, hit the Image button and then the Save fields button as shown below.
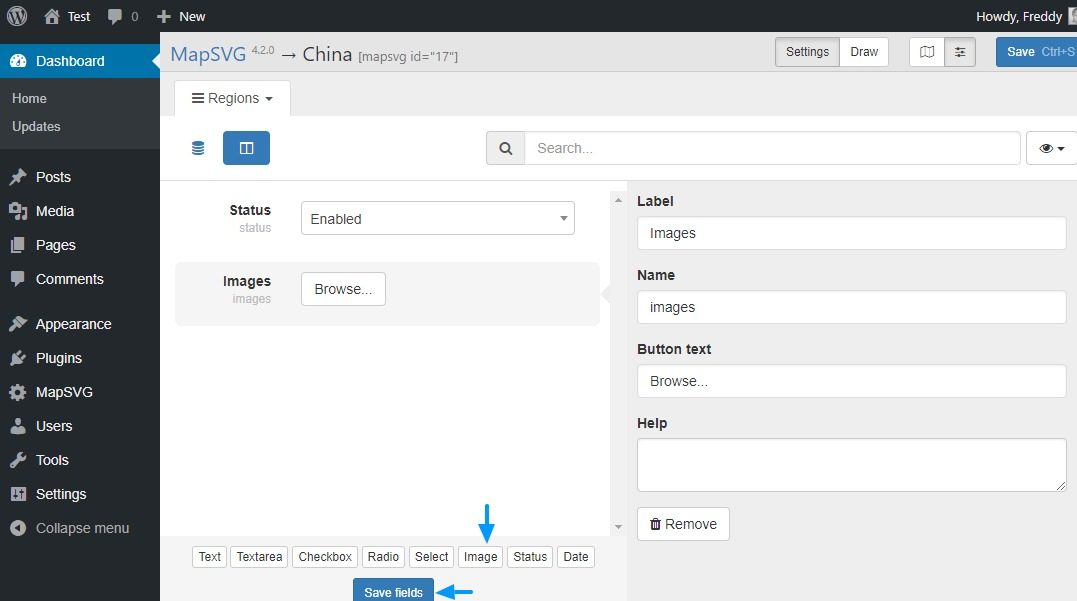
Save your changes by clicking the Save Ctrl + S button. Always remember to save your changes.
Next hit the List button as shown in the image below.
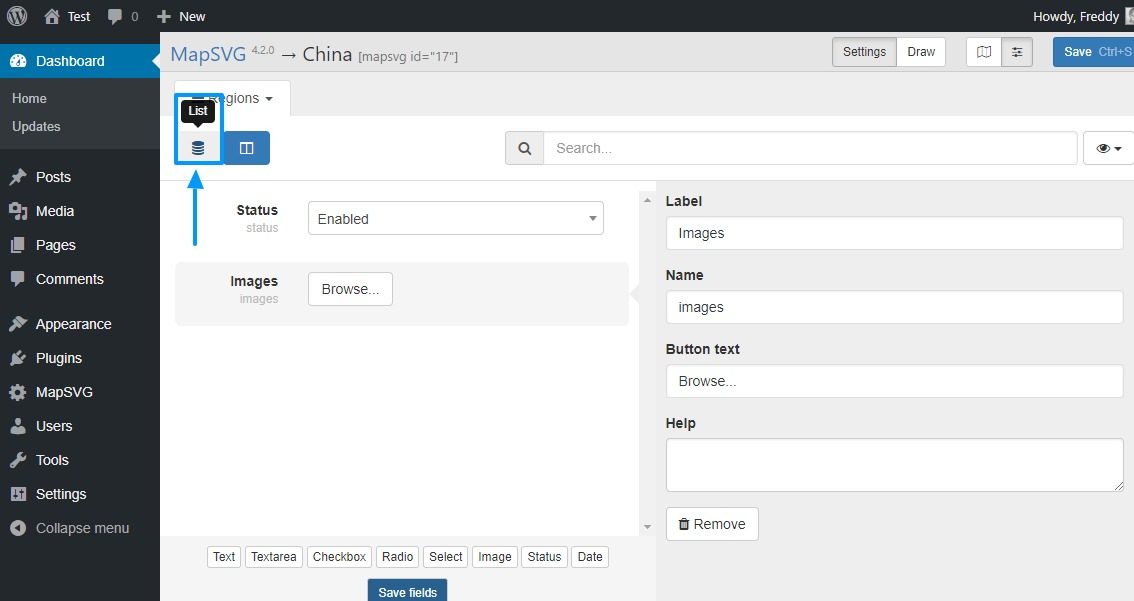
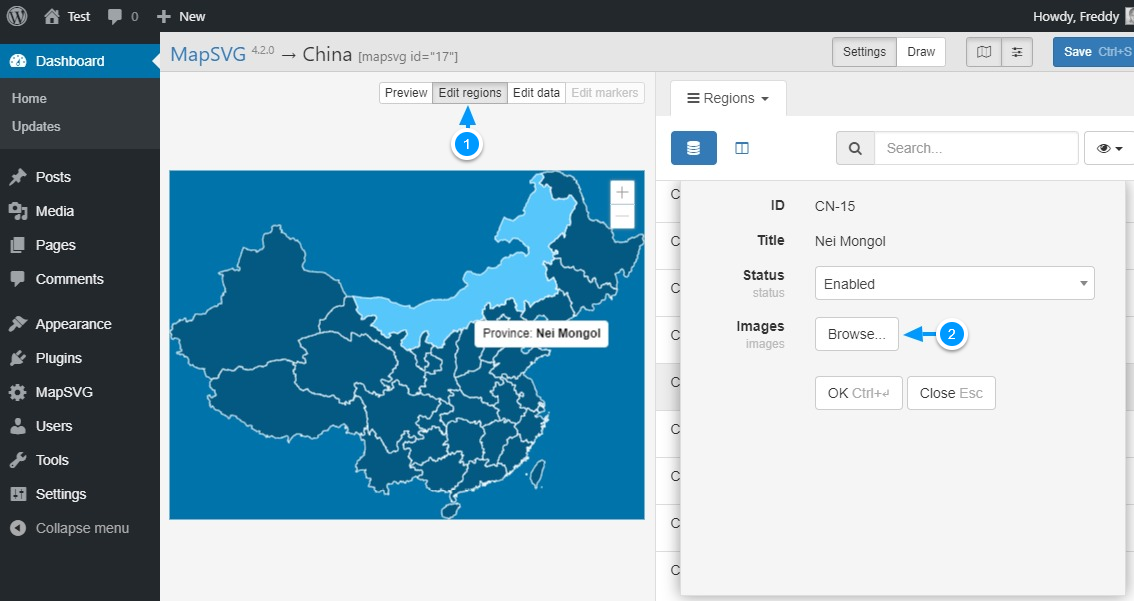
Switch your map to Edit Regions and click on a region (we picked Nei Mongol). You should see your new custom field (Images) to the right. Hit the Browse button. See image below.
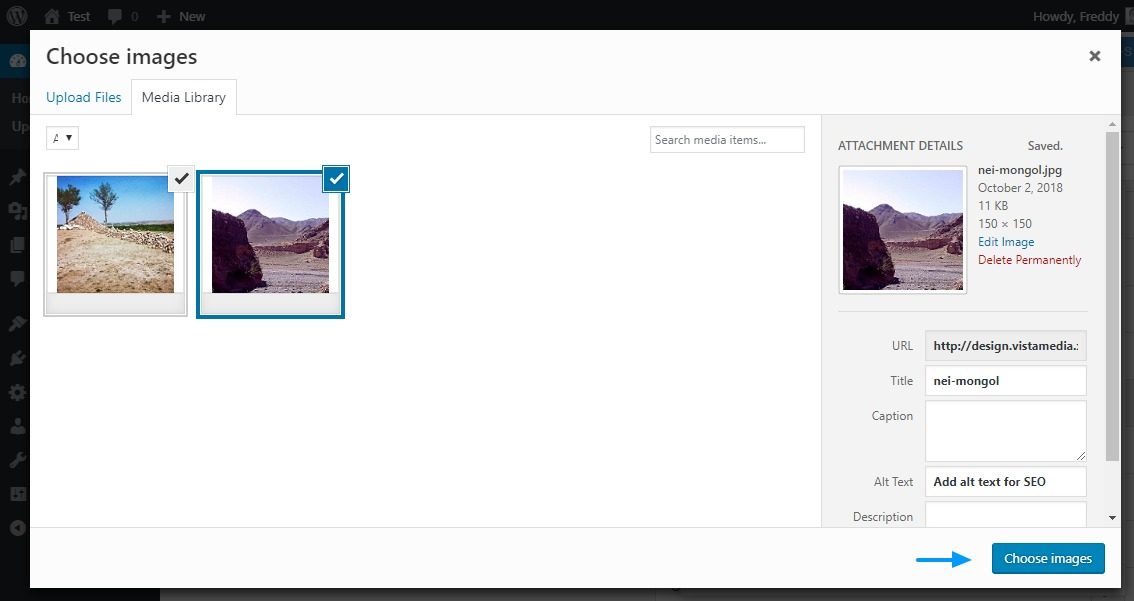
On the next screen, add your images and hit the Choose Images button.
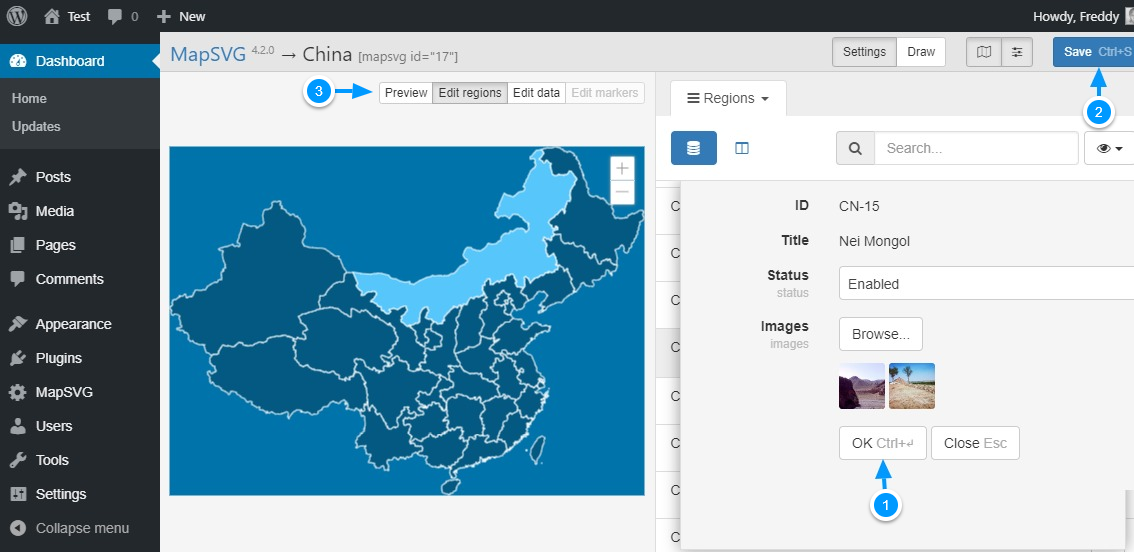
You will be redirected back to the Edit Regions screen where you must click the OK (1) button. Next, click the Save Ctrl + S (2) button and then go back to Preview (3) mode as shown below.
If you try to mouse over Nei Mongol at this point, the images won't appear in the tooltip. Why? Well, we haven't created a template for the images. Let's do that right this minute.
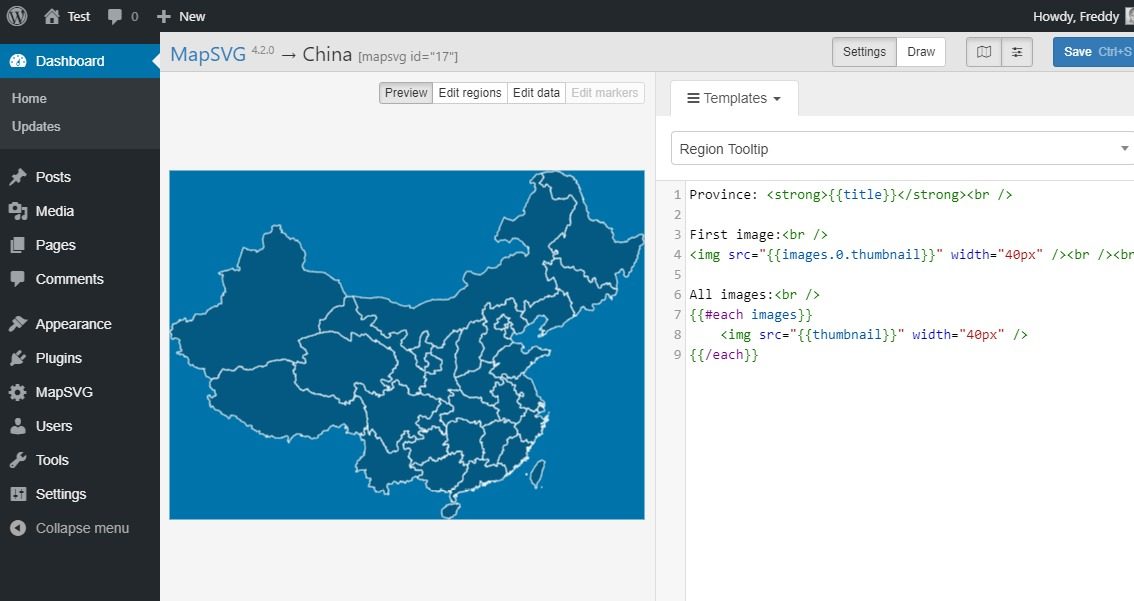
Navigate to Menu> Templates> Region Tooltip and change the code to this:
Province: {{title}}
 First image:


 All images:
 {{#each images}} {{/ each}}
Here is an image for further illustration. Remember to hit the Save button.
Now, try mousing over your selected region (Nei Mongol in our case). Tell me what you see. This is what is on my screen.
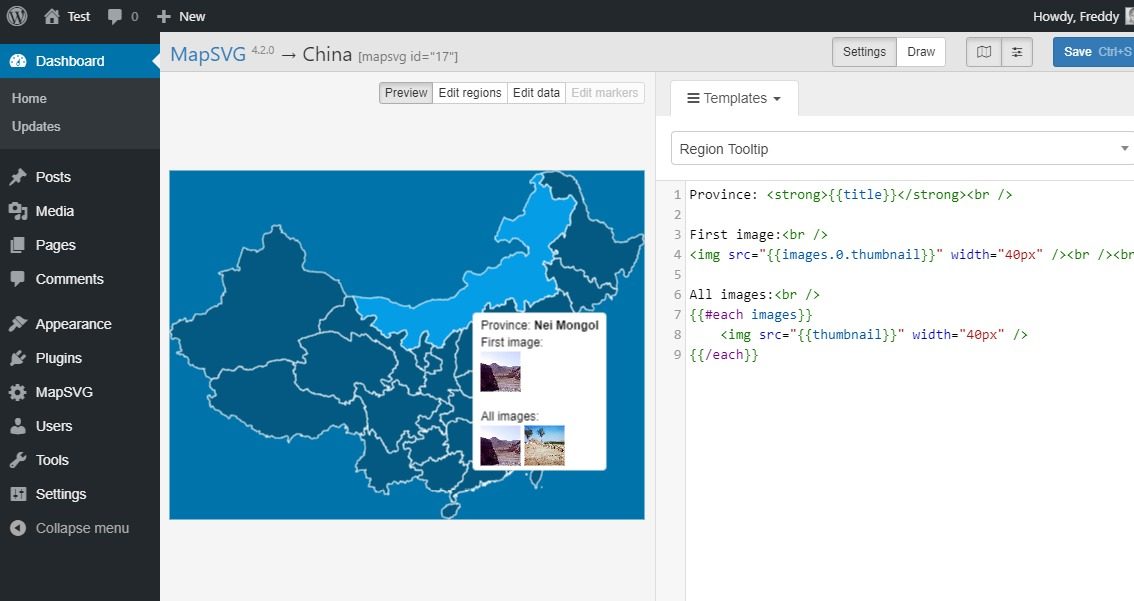
Pretty neat, right? You just learned how to add custom fields to your MapSVG maps. Adding popovers and markers is also as easy as pie. Additionally, as long as you know these basics, you are good to create any interactive map / diagram under the sun.
Working with MapSVG is the stuff of fourth graders, especially since Roman Stepanov offers great support and amazing guidance via tutorials. To display your map on your WordPress site, save your changes and navigate to Pages> Add New.
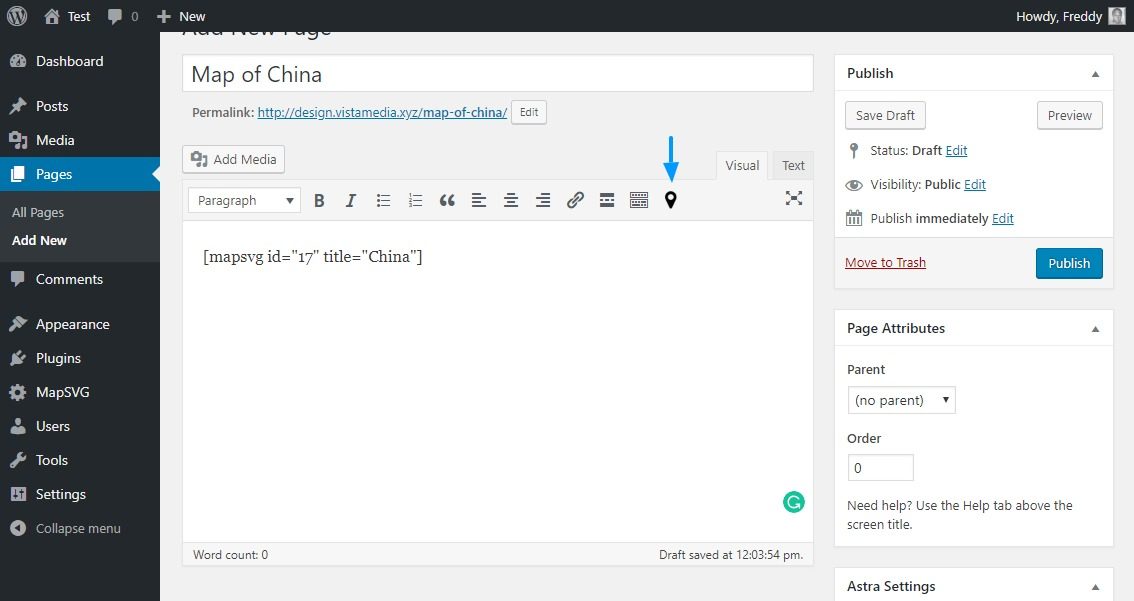
Next, hit the MapSVG button as shown above and choose your map. This adds the shortcode [mapsvg id = ”17 ″ title =” China ”] to your WordPress page. By any means, feel free to add the map anywhere on your site using the shortcode. Don't worry, maps you create with MapSVG are 100% responsive meaning they will look great across multiple devices.
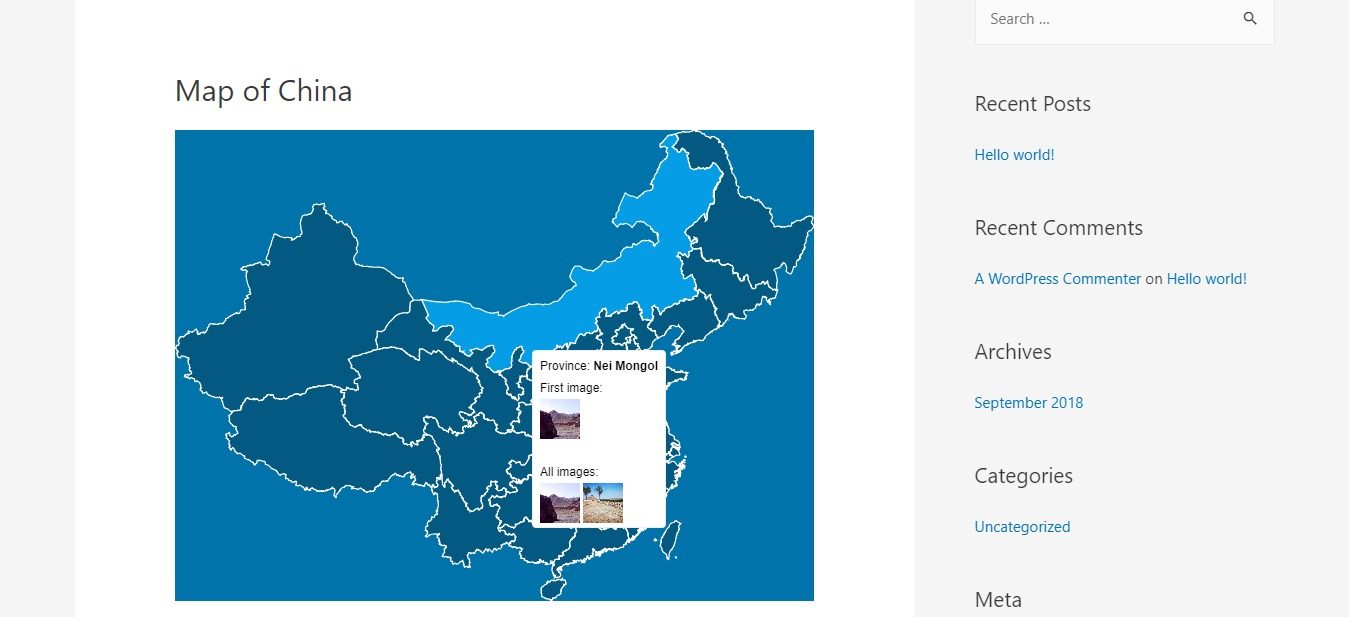
Next, hit publish and see the results on the frontend.
Conclusion
We would be here all day if we went through each feature there is, but I encourage you to get your own copy of the MapSVG WordPress map plugin and give it a test drive. Between you and me, it is the only WordPress map plugin you will ever need.
Do you have a question or suggestion? Please don't hesitate to reach out via the comment section below. Cheers!