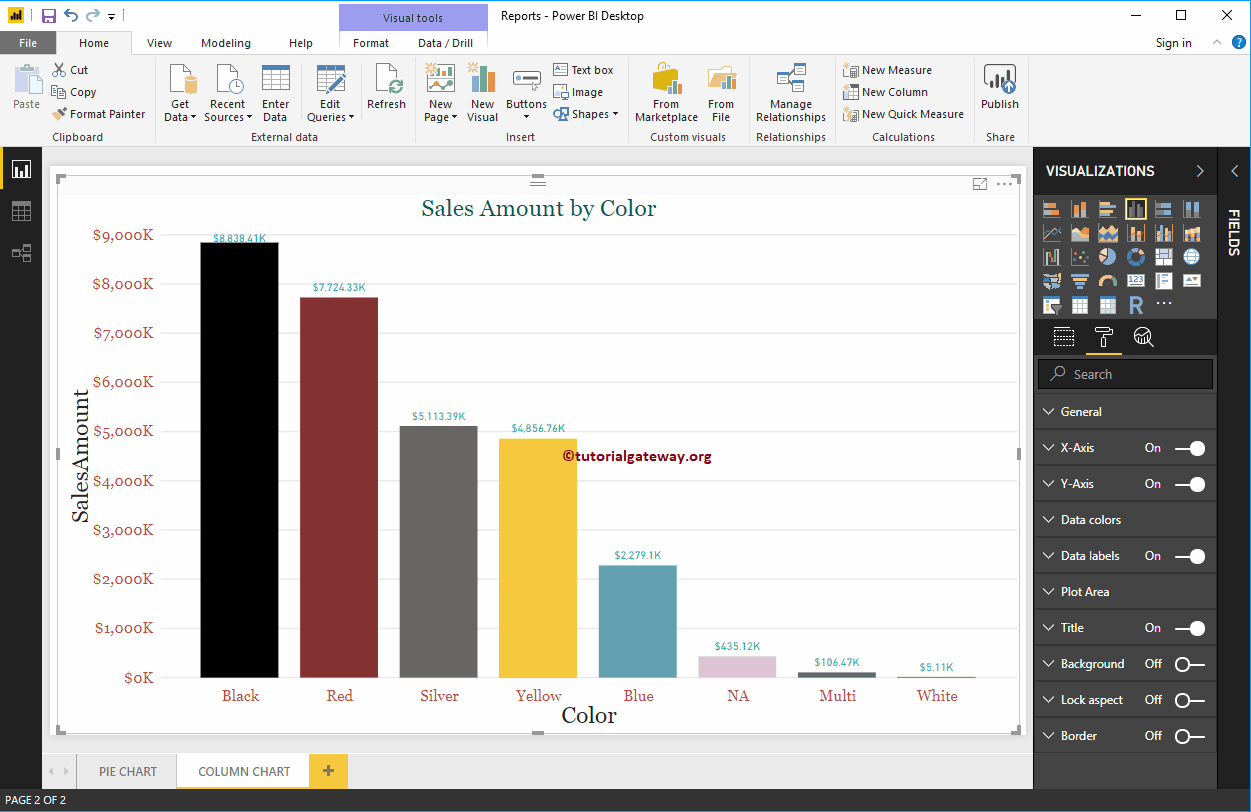
The Power BI column chart is very useful for visually comparing categorical data. For example, if we want to compare Sales by product group or Color, we can use…
The Power BI column chart is very useful for visually comparing categorical data. For example, if we want to compare Sales by product group or Color, we can use…
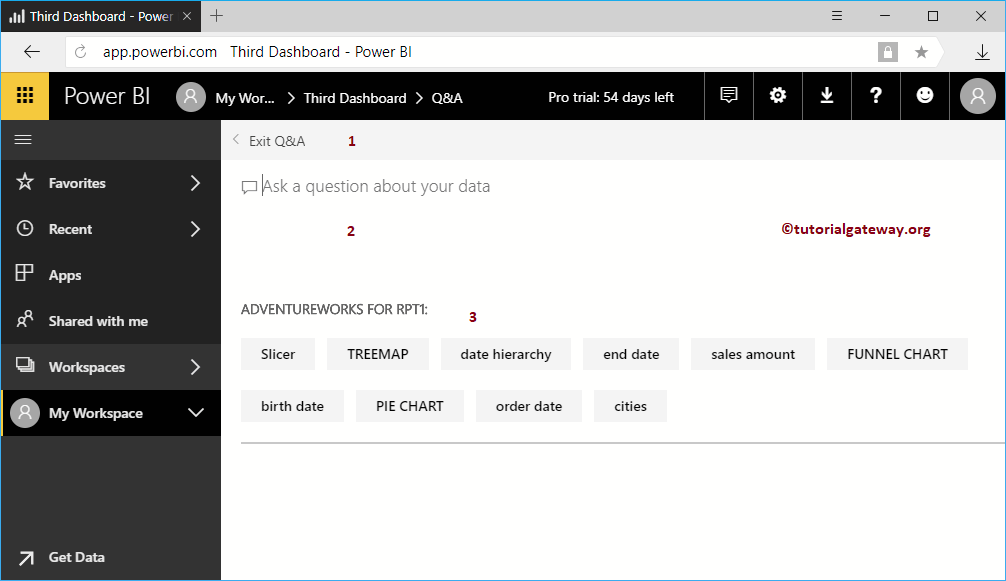
Power BI Q&A helps you ask business questions or perform data analysis with natural language. In this case, we show you the uses of Power BI Q&A with a…
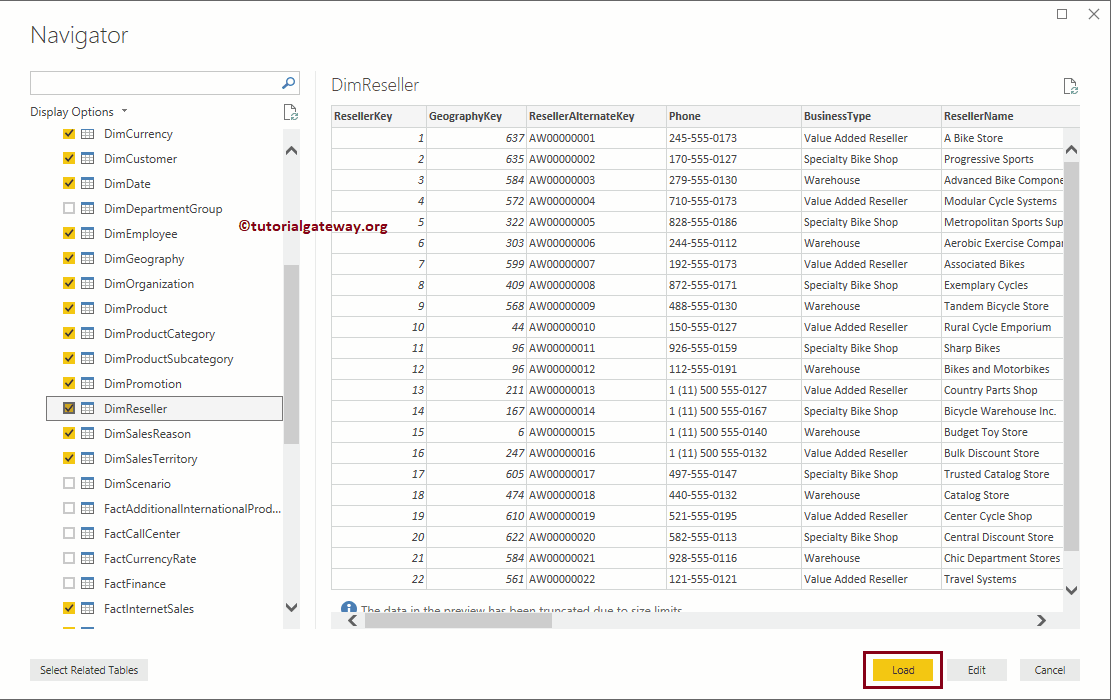
Let's see the step by step approach to connect Power BI to SQL Server database. In addition to this Connect Power BI to SQL Server, how to use queries…
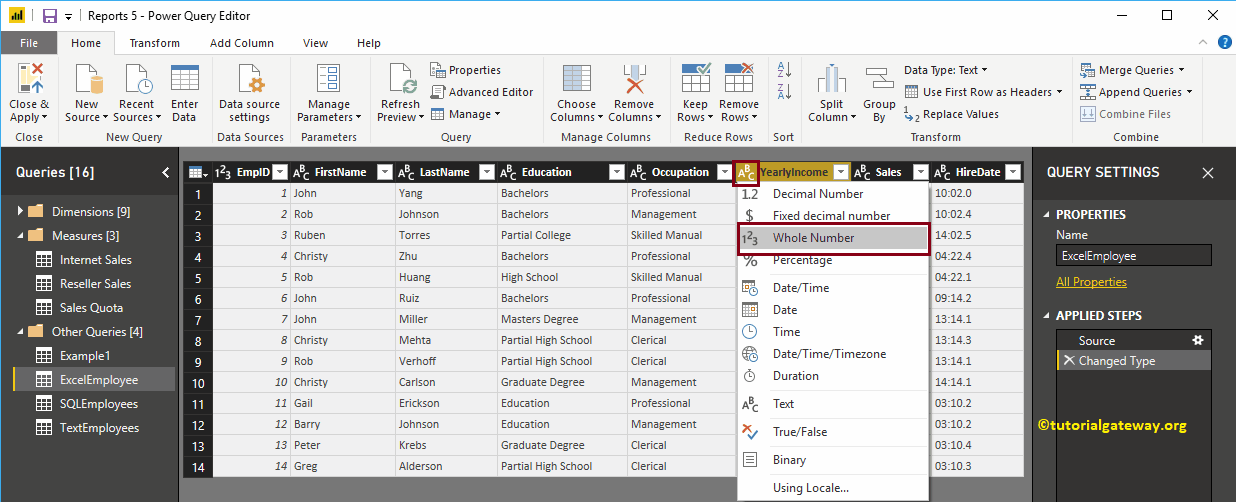
Generally, when you load a table from any data source, Power BI automatically detects the data type of a column. However, there may be some situations where…
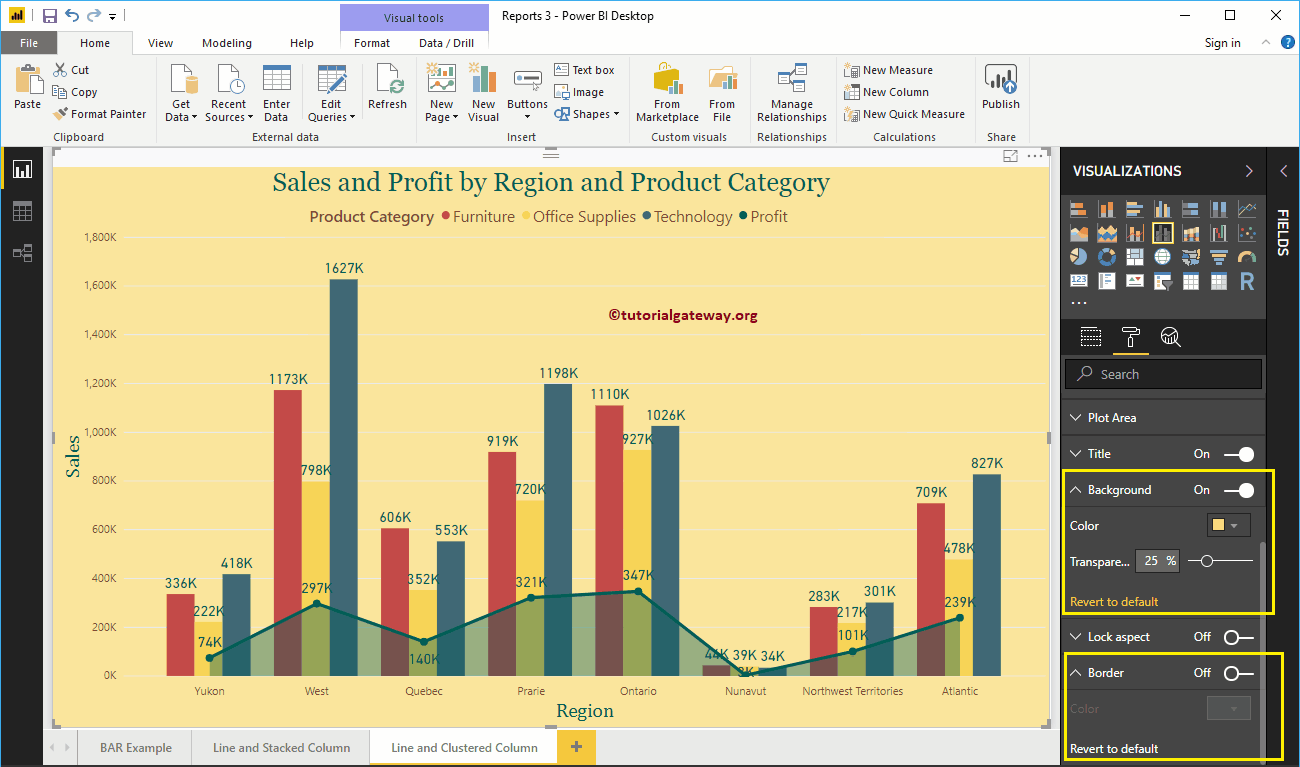
How to format Power BI Clustered Column and Line Chart with example? Formatting the Power BI Clustered Column and Line Chart includes…
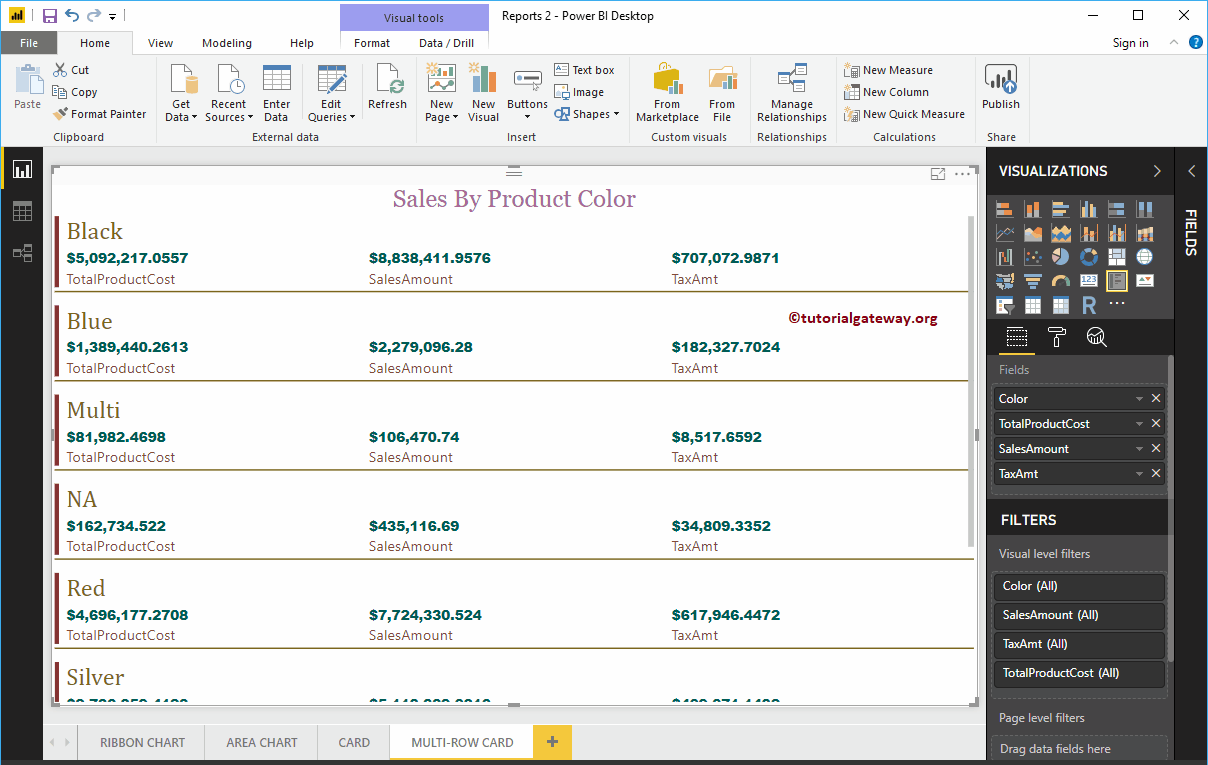
The Power BI multi-row card is useful for displaying data in a group (or section) format. Let me show you how to create a card…
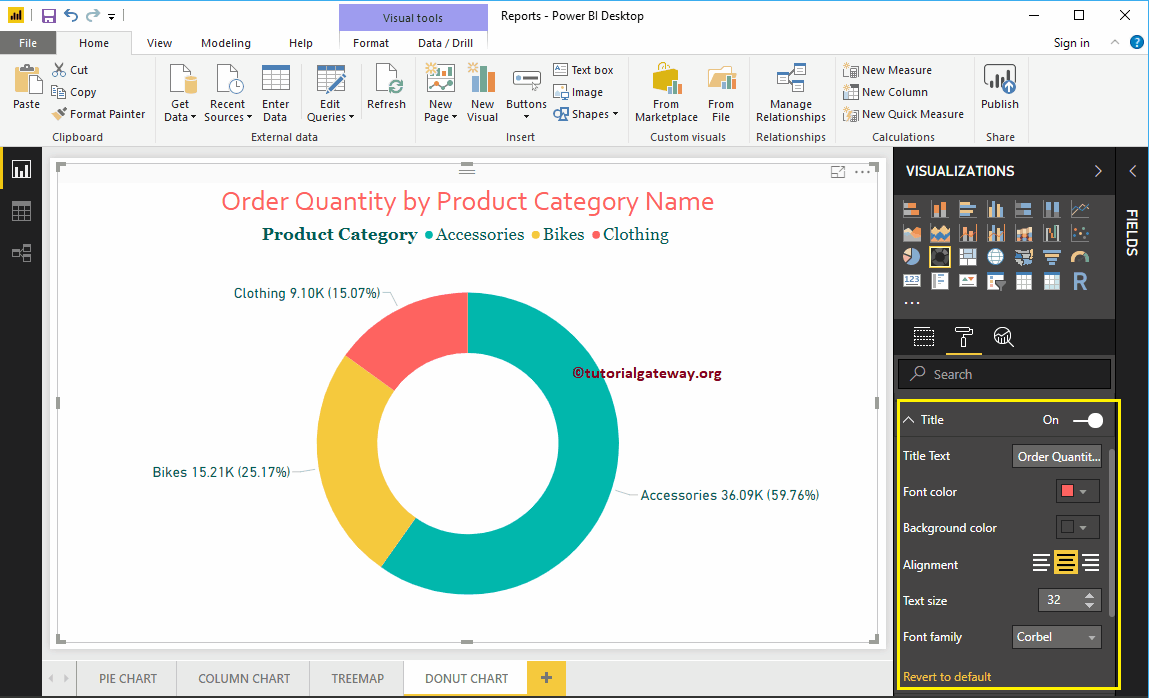
How to format donut chart in Power BI with an example? Donut chart format includes enable legend, position legend, title position,…
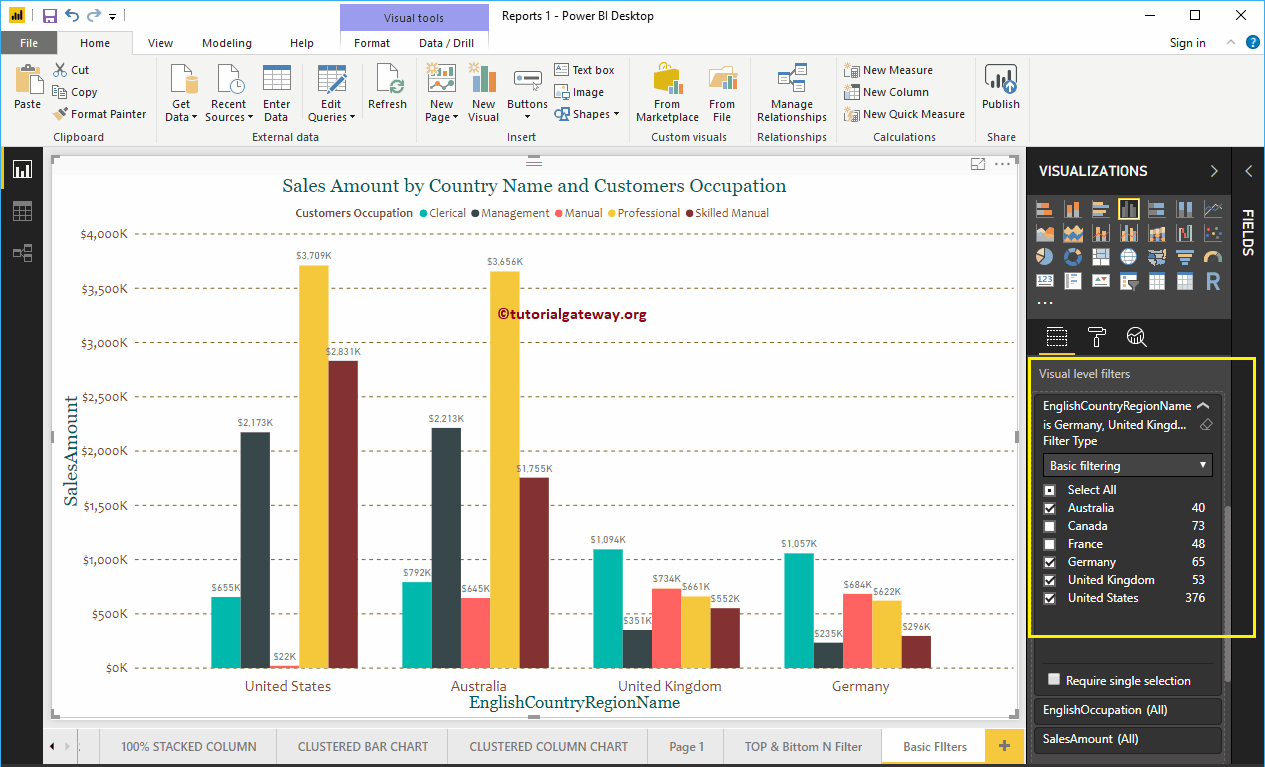
Power BI filters are useful for narrowing down data based on requirements. For example, using basic Power BI filters, we can exclude a product from the screen…
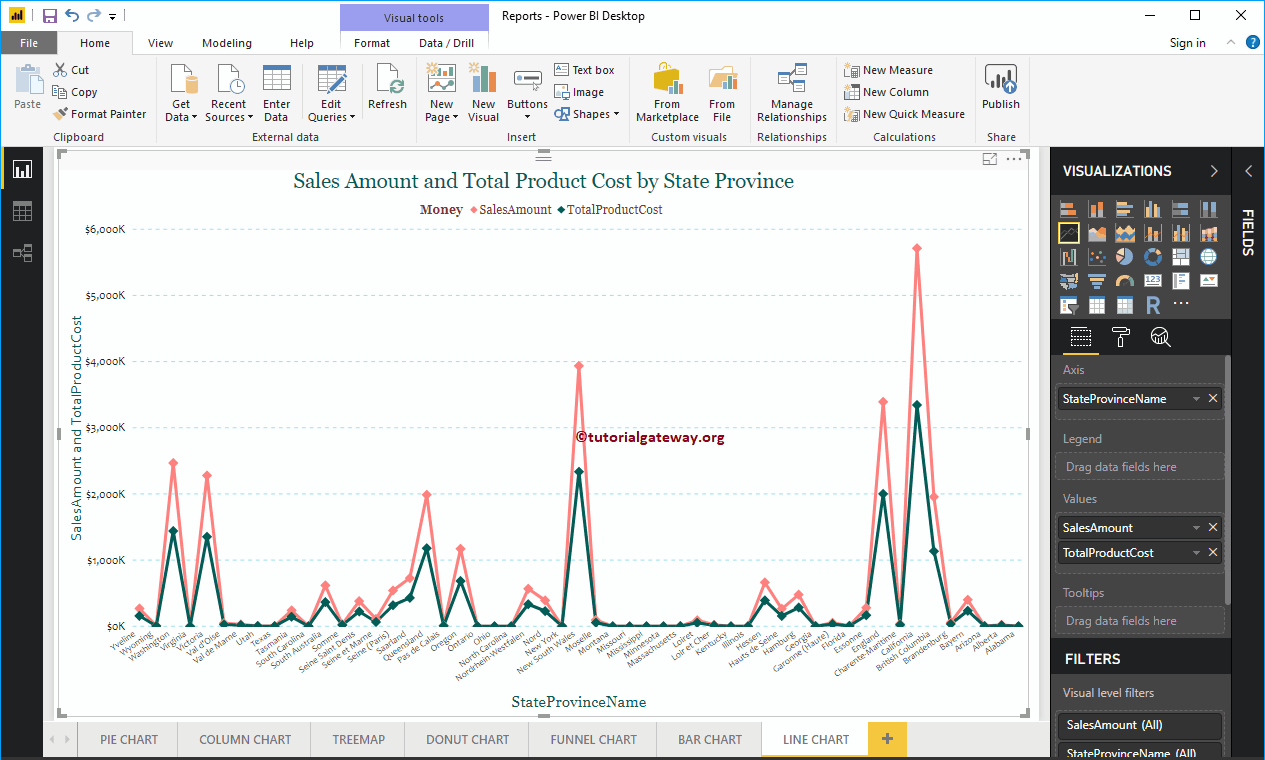
The Power BI line chart is useful for visualizing trends. For example, you can use this to create a sales trend, a temperate trend, etc. Let me show you…
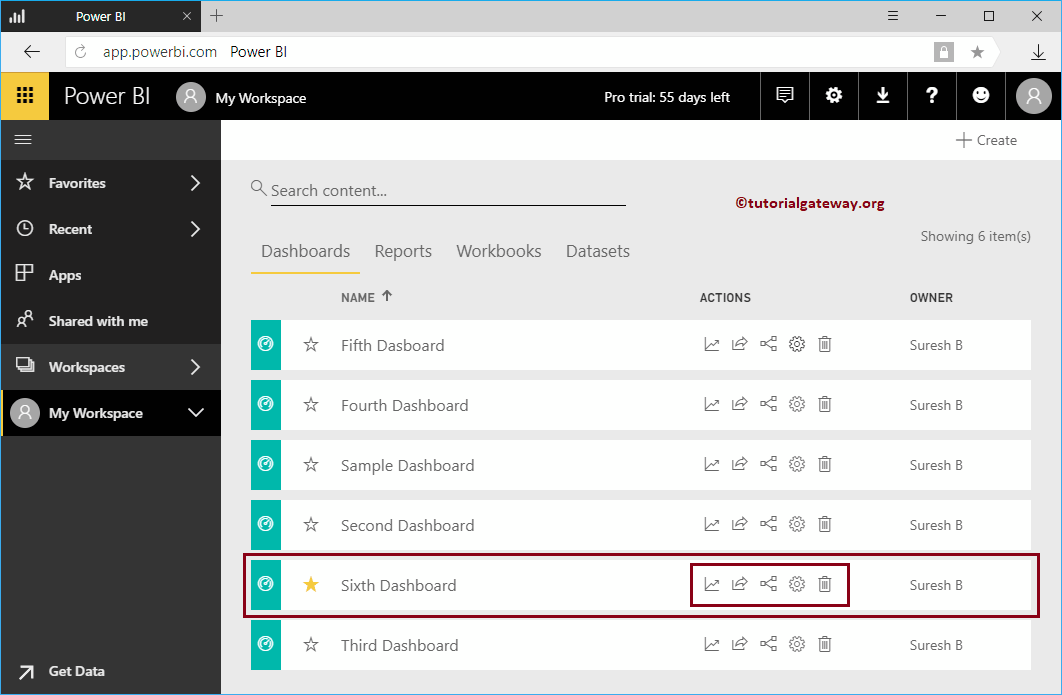
Let me walk you through Power BI dashboard actions and their uses. Before you start exploring the list of dashboard actions in Power BI, let me show you the dashboards…


© 2024 R Digital Marketing.