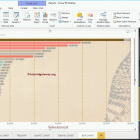
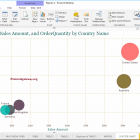
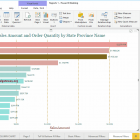
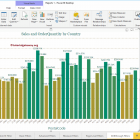
Stacked column and line chart in Power BI

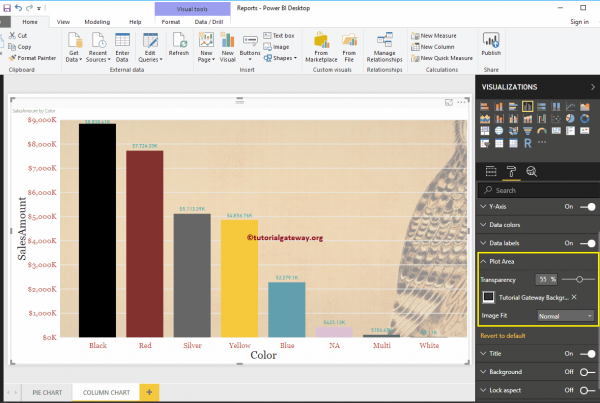
The stacked column and line chart in Power BI helps you visualize multiple dimensions and measures. Let me show you how to create a stacked column and line chart in ...
R Digital Marketing17/07/2022