Guides and tutorials

Power BI

Articles so you can learn to master Power BI. We have more than 300 guides and tutorials on the most important business management tool of the moment. In this blog we are going to focus on the most productive facet of the application with dashboards that are for professional, personal and educational use.

connect-power-bi-to-multiple-excel-sheets-5-3315242-8879513-png
Power BI

Connect Power BI to multiple Excel sheets

In this article, we show you how to connect Power BI to multiple Excel sheets and how to use the data present in those Excel sheets. To demonstrate the connection of ...
pin-workbooks-to-power-bi-dashboard-5-3425265-7334094-png
Power BI

Pin workbooks to the Power BI dashboard

Let me show you the step-by-step approach to pinning workbooks to the Power BI dashboard with a practical example. Before you start anchoring your workbooks,…
show-empty-records-in-a-power-bi-report-3-6245630-7569804-png
Power BI

How to display empty records in a Power BI report

In this section, we show you how to display empty records in a Power BI report with an example. While creating a Power BI report, Power Bi automatically hides the…
power-bi-filters-on-measures-10-7705776-1142969-png
Power BI
Power BI filters on measures
create-power-bi-workspace-5-1235957-6424777-png
Power BI
How to create a Power BI workspace
download-and-install-power-bi-desktop-1-9124588-9152395-png
Power BI
Download and install Power BI Desktop
power-bi-dashboard-actions-2-5008872-1000886-png
Power BI
Power BI dashboard actions
format-donut-chart-in-power-bi-9-7397848-7407247-png
Power BI
Format the donut chart in Power BI
image-3-1651670-8881987-png
Power BI
Setting up Postman for use with the Power BI REST API
create-groups-in-power-bi-22-4070016-2912151-png
Power BI
Create groups in Power BI
power-bi-basic-filters-5-1477819-3395388-png
Power BI
Basic Power BI filters
format-stacked-bar-chart-in-power-bi-12-9759864-2616954-png
Power BI
Format a stacked bar chart in Power BI
Power BI
Format line chart in Power BI
combine-multiple-tables-in-power-bi-7-9497816-6256470-png
Power BI
Merge multiple tables in Power BI
remove-or-reorder-columns-in-power-bi-11-7288666-8831466-png
Power BI
Remove or reorder columns in Power BI
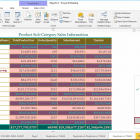
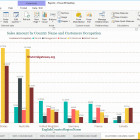
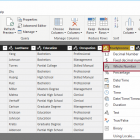
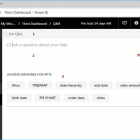
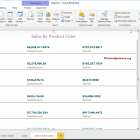
What is Power BI?

Power BI is the collective name for a variety of cloud applications and services that help organizations collect, manage, and analyze data from a variety of sources, through an easy-to-use interface. Power BI gathers and processes data into intelligible information, often using visually appealing and easy-to-process charts and tables.

This allows users to generate and share clear and useful snapshots of what is happening in their business. Power BI connects to a variety of data sources, from basic Excel spreadsheets to databases and applications both in the cloud and on our company's servers.

Power BI is a general term and can refer to a Windows desktop application called Power BI Desktop, a software-as-a-service (SaaS) online service called Power BI service, or Power BI mobile apps available on phones and tablets. Windows, as well as for iOS and Android devices.

Power BI is built on Microsoft Excel, and as such the learning curve from Excel to Power BI is not that steep; Anyone who can use Excel can use Power BI, but Power BI is much more powerful than the spreadsheet.

+ Productivity

Best Free Power BI Articles

Surely you are looking to optimize the delivery of information and reporting in your company or enterprise.How many hours have we spent creating spreadsheets and formulas What do we use in our home or office?

With a good dashboard in Power BI you can save hundreds of hours of work. We want to share with you our selection of tutorials and guides for Power BI.