Guides and tutorials

Power BI

Articles so you can learn to master Power BI. We have more than 300 guides and tutorials on the most important business management tool of the moment. In this blog we are going to focus on the most productive facet of the application with dashboards that are for professional, personal and educational use.

power-bi-dax-aggregate-functions-14-1663614-2780439-png
Power BI

Power BI DAX aggregate functions

How to use DAX aggregate functions in Power BI with examples? Microsoft Power BI DAX provides various aggregate functions, which allows us to perform aggregations such as calculating sum, average, ...
format-power-bi-map-10-2087187-5673876-png
Power BI

Format the Power BI map

How to format the Power BI map with an example? Formatting the Power BI map includes changing the bubble size, color, text of the ...
how-to-sort-a-chart-in-power-bi-6-5716580-1509494-png
Power BI

How to sort a chart in Power BI

How to sort a chart in Power BI with an example? To demonstrate how to sort a chart in Power BI, we'll use the column chart we created earlier. See the article ...
power-bi-dashboard-settings-4-4525268-8049648-png
Power BI
Power BI dashboard settings
add-web-content-to-power-bi-dashboard-3-7023423-8002113-png
Power BI
How to add web content to the Power BI dashboard
column-chart-in-power-bi-9-9855956-2851474-png
Power BI
Column chart in Power BI
power-bi-qa-advanced-5-7173144-4892095-png
Power BI
Power BI Advanced Questions and Answers
format-power-bi-scatter-chart-14-1993037-1125305-png
Power BI
Format the Power BI scatter chart
format-power-bi-ribbon-chart-13-3712456-5905761-png
Power BI
Format the Power BI ribbon chart
power-bi-r-script-6-1417505-6037838-png
Power BI
Power BI R script
add-rename-and-duplicate-pages-in-power-bi-11-7608100-3486785-png
Power BI
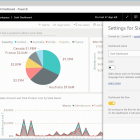
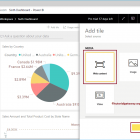
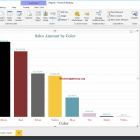
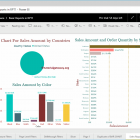
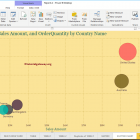
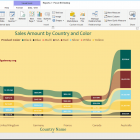
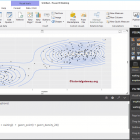
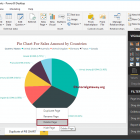
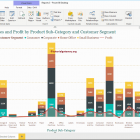
Add rename and duplicate pages in Power BI
line-and-stacked-column-chart-in-power-bi-12-3501298-8100886-png
Power BI
Stacked column and line chart in Power BI
format-power-bi-table-15-7600457-9371935-png
Power BI
Format the Power BI table
power-bi-top-10-filters-7-1639736-8104739-png
Power BI
Top 10 Power BI filters
heat-map-in-power-bi-12-1015074-4078269-png
Power BI
Heatmap in Power BI

What is Power BI?

Power BI is the collective name for a variety of cloud applications and services that help organizations collect, manage, and analyze data from a variety of sources, through an easy-to-use interface. Power BI gathers and processes data into intelligible information, often using visually appealing and easy-to-process charts and tables.

This allows users to generate and share clear and useful snapshots of what is happening in their business. Power BI connects to a variety of data sources, from basic Excel spreadsheets to databases and applications both in the cloud and on our company's servers.

Power BI is a general term and can refer to a Windows desktop application called Power BI Desktop, a software-as-a-service (SaaS) online service called Power BI service, or Power BI mobile apps available on phones and tablets. Windows, as well as for iOS and Android devices.

Power BI is built on Microsoft Excel, and as such the learning curve from Excel to Power BI is not that steep; Anyone who can use Excel can use Power BI, but Power BI is much more powerful than the spreadsheet.

+ Productivity

Best Free Power BI Articles

Surely you are looking to optimize the delivery of information and reporting in your company or enterprise.How many hours have we spent creating spreadsheets and formulas What do we use in our home or office?

With a good dashboard in Power BI you can save hundreds of hours of work. We want to share with you our selection of tutorials and guides for Power BI.