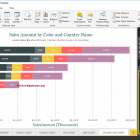
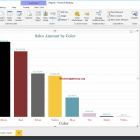
Clustered column chart in Power BI
![clustered-column-chart-in-power-bi-8-4227633-5241239-png]()


The clustered column chart in Power BI is used to display vertical bars from multiple data regions (measures) in a single metric. Let me show you how to create a chart ...
R Digital Marketing12/08/2022