
Leverage A/B testing to evaluate the impact of site speed on your business metrics.
Fast load times
Over the last few years it has been well established that site speed performance
is a significant part of the user experience and that improving it benefits
different business metrics such as conversion rates and bounce rates. Multiple
articles and case studies have been published to back this up, including
Cloudflare’s How Website Performance Affects Conversion
Rates,
Deloitte’s Milliseconds Make
Millions,
and Shopping for Speed on eBay.com, to name a
few.
Even though the case for speed is clear, many companies still struggle with
prioritizing work that will improve their site speed since they do not know
exactly how it affects their users and as a result their business.
In the absence of data, it is easy to delay site speed work and focus on other
tasks. A common scenario is having some people in the company recognize the
importance of site speed and yet not be able to build a case for it and convince
multiple stakeholders to invest accordingly.
This article provides high-level guidance on how to leverage A/B testing to
evaluate the impact of site speed on business metrics therefore enabling more
effective decision-making on the matter.
Step 1: Pick a page to A/B test
Your aim is to test the hypothesis that page speed relates to your business
metrics. For simplicity’s sake, you can initially limit yourself to identifying
a single page for analysis. Future work can expand to multiple pages of the same
type to verify findings, and then to other areas of the site. Some suggestions
for where to start are provided at the bottom of this step. Several requirements
drive the page selection process:
-
The A/B test should only be run on the devices of mobile users. Globally,
the partner sites we assist see an average of more than
50%
(and growing!) of their traffic coming from mobile, but this can increase
significantly based on
region
and
vertical.
Mobile devices are more sensitive to slower websites due to processing and
memory constraints and less stable networks. Also, on-the-go usage patterns
mean expectations for speed are higher. -
The page you choose for testing should be an important part of your
conversion funnel. Every site has a different purpose, so every site tracks
different success metrics. These metrics are usually related to a user
journey which is analyzed using a funnel. For example, users on an
e-commerce website will have to navigate through a home page, category
pages, product pages, and a checkout page to complete a purchase. If you’re
optimizing for conversions, one of those pages would be a good candidate. -
The page should have a singular purpose. Unless your site has a very
specific mission, it’s usually best to avoid using the homepage for your
test. Many commercial sites’ homepages are portals to a wide variety of
functionality that will make your analysis noisy. For example, if you’re
optimizing for pageviews per session on a news site, it might be best to
exclude the non-commercial portions of the site and focus on monetized
sections and articles. -
The page chosen should get enough traffic so that you don’t have to wait
long before getting a statistically significant result. -
The selected page should be relatively slow. In fact, the slower the better.
This not only means that you will likely have an easier time improving the
page, it also means that the data should be much clearer. You can do a quick
scan through your Google Analytics Speed
Report or Search
Console Core Web Vitals
report to see which
of your pages are slowest. -
The page should be relatively stable. Don’t update pages (anything that
would impact business metrics) until the test is complete. The fewer
external factors there are to consider, the cleaner the analysis will be.
Using the above as a guide it should be a bit more clear which pages are good
candidates for your test. Ad landing pages are also a good choice, because
you’re likely to have built-in business metrics, A/B testing, and analysis at
your disposal. In case you’re still unsure, here are some ideas per vertical:
- Content Websites: sections, articles
- Storefronts: category pages, product pages
- Media Players: video discovery/search pages, video play page
- Services & Discovery (travel, rental cars, service registration, etc.):
initial form-entry page
Step 2: Measure performance
There are two general ways to measure metrics: in the lab and in the
field. We
personally have found measuring metrics in the field (also known as Real User
Monitoring (RUM)) to be more useful because it reflects the experience of real
users. Examples of libraries and services that can help you report RUM data
include Perfume, Firebase Performance
Monitoring, and Google Analytics
Events.
There are many metrics to choose from
because they aim to capture different aspects of the user experience. Remember
that your goal is to eventually determine if there’s a direct correlation
between your speed and business metrics, so it might be useful to track a few
speed metrics in order to determine which one has the strongest correlation with
your business success. In general we recommend starting with the Core Web
Vitals. The
web-vitals.js library can help you
measure some of the Core Web Vitals in the field, although note that browser
support isn’t 100%.
Beyond the Core Web Vitals, the Other Web Vitals
are also worth checking out. You can also define custom
metrics, such as «Time To
First Ad Click».
Step 3: Create speed performance variants
In this stage you will implement changes to create a faster version of the page
to be tested against the current version.
A couple of things to keep in mind:
- Avoid making any changes to the UI or UX. Aside from one page being faster
than the other, changes must be invisible to users. - Measuring is also a key aspect of this stage. While developing, lab testing
tools such as Lighthouse should be used to indicate the effect your changes
have on performance. Keep in mind that changes to one metric can often
influence another. Once the pages are live, stick to RUM for a more accurate
evaluation.
Creating performance variants can be done in different ways. For the purpose of
the test, you would want to do so as simply as possible. Below are a few
options.
Create a faster page
- Use a tool like Squoosh to manually optimize the
images on your test page - Use DevTools code
coverage
to manually eliminate unused JavaScript or CSS just for that one page - Efficiently load third-party
scripts - Use a tool like Critical to break
out and inline critical CSS - Remove non-critical JavaScript code that does not impact the user experience
and which you can do without for the purpose of the test (for example,
certain third-party libraries) - Implement native lazy loading which isn’t supported
by all browsers but may still improve performance significantly where
supported - Remove non-critical analytics tags or load them asynchronously
Additional optimizations to consider can be found at Fast load times
and Frontend Performance
Checklist.
You can also use PageSpeed
Insights to run
Lighthouse, which identifies opportunities to improve performance.
Slow down the page
This may be the easiest way to create variants and can be achieved by adding a
simple script, slowing down server response times, loading larger images, etc.
The Financial Times opted for this option when testing how performance impacted
their business metrics: see A faster
FT.com.
Speed up page load
For cases where the test page (let’s say a product detail page) is mostly linked
out from a different page (let’s say the homepage),
prefetching or
prerendering
the product page directly from the homepage for the test group will speed up the
subsequent load of the page. Note that in this case the A/B test split (step 4)
is done on the homepage. In addition, all of this may slow down the first page
so be sure to measure that and take it under consideration when analyzing the
test results (step 5).
Step 4: Create an A/B test
Once you have two versions of the same page where one is faster than the other,
the next step is to split traffic to measure impact. In general there are many
techniques and tools to perform A/B tests, but be aware that not all methods are
well suited to measure speed performance impact.
If you’re using an A/B testing tool like
Optimizely or
Optimize we strongly recommend
setting up a server-side test instead of a client-side test, as client side A/B
testing often works by hiding page content until the experiment is loaded, which
would mean the A/B testing itself would skew the metrics you wanted to measure.
If you can only do client-side testing, consider setting up the experiment on a
different page and changing the link outs to your test page to split the
traffic. This way the test page itself isn’t dragged down by the client-side
test.
Example of AB testing performance changes on a given product detail page (PDP)
via server-side testing:
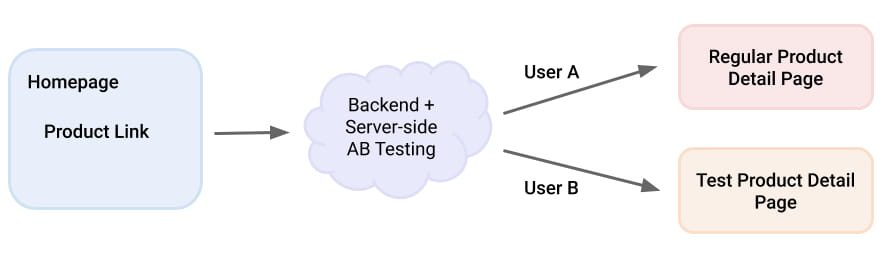
The request goes to the backend, which distributes the users to the two
different versions of the page. While this is in general a good setup, it often
needs IT resources to set up the server-side split.
Here is an example of a client side testing setup, using the prior page (the
homepage in the diagram below) to run the testing JavaScript:
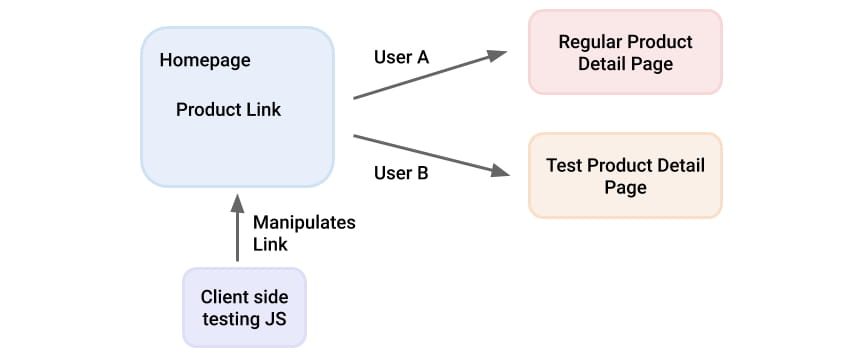
The testing JavaScript manipulates the outgoing link to give the two test groups
of users links to the two versions of the PDP in question. This is easy to setup
and maintain through common A/B testing tools like Optimizely or Optimize and
does not influence the performance test because the testing JavaScript runs on a
different page.
Alternatively, you can pick two pages which behave and perform very similarly
(for example, for two very similar products). Apply your changes to one of them
and then compare the difference in metrics over time. This will mean you’re not
conducting a proper A/B test, yet it can still be quite insightful.
In case your test page is used as a landing page for ad campaigns, it can be
handy to use your ad network’s built-in A/B testing tools, like Facebook Ads
Split Test or Google
Ads Drafts &
Experiments. If
that’s not an option, you can use two campaigns with the same setup, and set
different landing pages as targets.
Step 5: Analyze A/B test
After you’ve run your test for long enough and have enough data to feel
confident about the results, it’s time to put it all together and run an
analysis. How you do that really depends on how the test has run, so let’s go
through the options.
If your test was run on ad landing pages using the above-mentioned tools,
analysis should be as straightforward as reading a result. If you’re using
Google’s Drafts & Experiments, take a look at the comparison using the
ScoreCard.
Platforms like Optimizely or Optimize also offer easy
ways to interpret the
results and determine how much of an impact speed has on your pages.
If you’re using Google Analytics or a similar tool, you will have to pull
together the report yourself. Luckily, Google Analytics makes it pretty easy to
build custom
reports, so that’s
where you should start. If you’ve sent speed data to Google Analytics using a
custom dimension, check out the Reporting
guide to
learn how to set those up and include them in your custom reports. Make sure
your report covers the date of the experiment and is configured to display both
variants. What should go in this report?
- Primarily, you need to include the business metrics that you most care
about: conversions, page views, ads viewed, conversion rate, e-commerce
metrics, click-through rate, etc. - Additionally, other standard page metrics that also make a good case for
improving site speed are bounce rate, average session duration, and exit
percentage.
You may also need to filter for mobile and make sure to exclude bots and other
non-user
traffic.
More advanced analysis would also filter by region, networks, devices, traffic
source, and user profiles and types, such as new users versus repeat visitors.
Each group of users may be more or less sensitive to slower speeds and
identifying these is also quite helpful.
Data Studio or
other data visualization tools make it easy to integrate various data sources
including Google Analytics. This makes it easy to conduct analysis, and also
create dashboards that are shareable with the many stakeholders involved in
running a modern website for further buy-in. For example, the Guardian created
an automated alert
system
that warned the editorial team when recently published content crossed their
page size or speed thresholds and was likely to result in unsatisfied users.
Step 6: Draw conclusions and decide on next steps
Once you have data that connects performance and business metrics, you can
examine the results and start to draw conclusions.
If you can clearly see a correlation between improving performance and improving
business metrics, summarize the results and report them across the company. Now
that you can talk about speed performance in a «business language» you are more
likely to grab the attention of different stakeholders and place site speed
performance on everyone’s radar. The next step is to set performance
budgets based on the results, and plan out
work to meet those budgets. Since you know the value such work will provide,
you’ll be able to prioritize accordingly.
If you can’t identify a correlation, take a look at the caveats below and assess
whether similar tests should be run elsewhere on the site (for example, through
the entire purchase funnel or on a different type of page).
Caveats
There might be several reasons for not finding significant correlation between
site speed metrics and business metrics:
- The page chosen does not have enough influence on the business metrics
you’re examining. For example, a faster product page may not have a big
effect on conversion rates if the checkout page is very unfriendly or slow.
Consider looking at more relevant metrics such as bounce rates,
add-to-basket rates or any other metric that is more directly connected to
the page you’re testing. - The difference in speed is not significant enough between the two versions.
This should be evaluated according to the RUM metrics you’re measuring. - There’s a fault with the A/B testing mechanism. Traffic might not be
distributed properly or analytics not reported correctly. In order to rule
this out, consider running an A/A test where you test the same version of a
page using the same testing mechanism and ensure there’s no difference in
results when doing so. - Site speed really doesn’t influence your business metrics. This is rare but
can occur in cases where your target market is less sensitive to speed (e.g.
the site is mostly accessed from powerful devices on a strong network) or
user demand is very high and choice is limited (e.g. a ticketing service
that exclusively sells tickets for high-demand shows). Note that this does
not mean that a faster site will not improve user experience and as a result
affect brand
reputation.
Conclusion
While it is tempting to launch speed optimizations across the entire site, it is
usually more beneficial in the long run to first understand what it means to
your users and your company to have a faster website. It is the difference
between saying «we improved FCP by 1.5 seconds» and «we improved FCP by 1.5
seconds and that improved our conversion rates by 5%». This will allow you to
prioritize further work, get buy-in from different stakeholders and make site
speed performance a company-wide
effort.