New metrics, Performance score update, new audits, and more.
Today we’re releasing Lighthouse 6.0!
Lighthouse is an automated website auditing tool that
helps developers with opportunities and diagnostics to improve the user experience of their sites.
It’s available in Chrome DevTools, npm (as a Node module and a CLI), or as a browser extension (in
Chrome and
Firefox). It powers many Google
services, including web.dev/measure and PageSpeed
Insights.
Lighthouse 6.0 is available immediately on npm and in Chrome
Canary. Other Google services that leverage Lighthouse will
get the update by the end of the month. It will land in Chrome Stable in Chrome 84 (mid-July).
To try the Lighthouse Node CLI, use the following commands:
npm install -g lighthouse
lighthouse https://www.example.com --view
This version of Lighthouse comes with a large number of changes that are
listed in the 6.0 changelog. We’ll cover
the highlights in this article.
New metrics
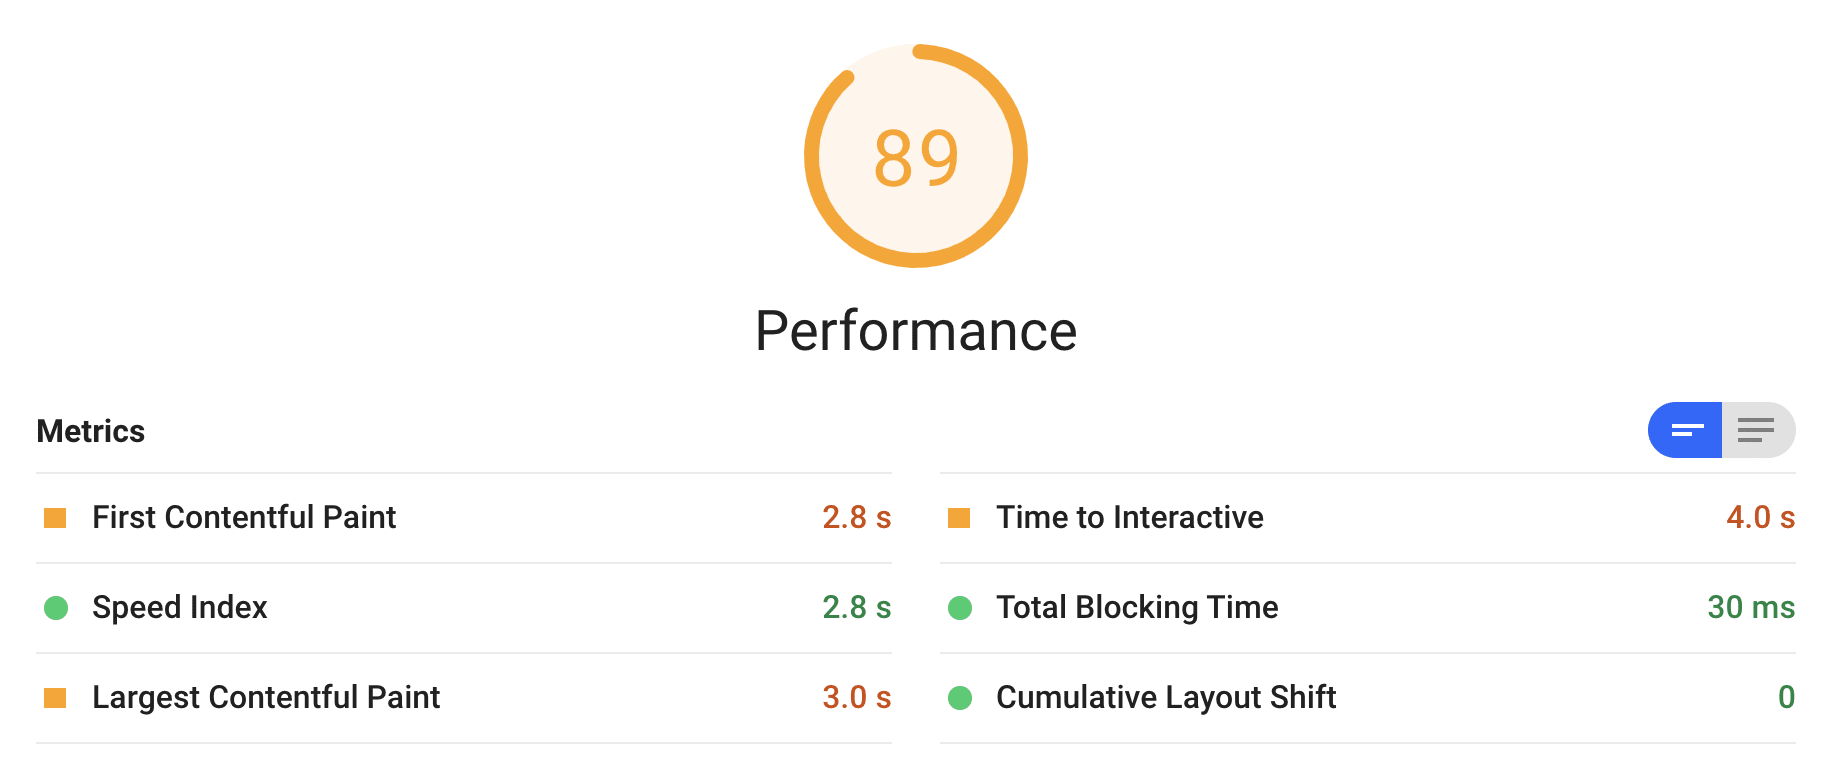
Lighthouse 6.0 introduces three new metrics to the report. Two of these new metrics–Largest
Contentful Paint (LCP) and Cumulative Layout Shift (CLS)–are lab implementations of Core Web
Vitals.
Largest Contentful Paint (LCP)
Largest Contentful Paint (LCP) is a measurement of perceived loading
experience. It marks the point during page load when the primary–or «largest»–content has loaded and
is visible to the user. LCP is an important complement to First Contentful Paint (FCP) which only
captures the very beginning of the loading experience. LCP provides a signal to developers about how
quickly a user is actually able to see the content of a page. An LCP score below 2.5 seconds is
considered ‘Good.’
For more information, watch this deep-dive on LCP by Paul Irish.
Cumulative Layout Shift (CLS)
Cumulative Layout Shift (CLS) is a measurement of visual stability. It
quantifies how much a page’s content visually shifts around. A low CLS score is a signal to
developers that their users aren’t experiencing undue content shifts; a CLS score below 0.10 is
considered ‘Good.’
CLS in a lab environment is measured through the end of page load. Whereas in the field, you can
measure CLS up to the first user interaction or including all user input.
For more information, watch this deep-dive on CLS by Annie Sullivan.
Total Blocking Time (TBT)
Total Blocking Time (TBT) quantifies load responsiveness, measuring the
total amount of time when the main thread was blocked long enough to prevent input responsiveness.
TBT measures the total amount of time between First Contentful Paint (FCP) and Time to Interactive
(TTI). It is a companion metric to TTI and it brings more nuance to quantifying main thread activity
that blocks a user’s ability to interact with your page.
Additionally, TBT correlates well with the field metric First Input Delay
(FID), which is a Core Web Vital.
Performance score update
The performance score in Lighthouse is calculated from a
weighted blend of multiple metrics to summarize a page’s speed. The 6.0 performance score formula
follows.
| Phase | Metric Name | Metric Weight |
|---|---|---|
| Early (15%) | First Contentful Paint (FCP) | 15% |
| Mid (40%) | Speed Index (SI) | 15% |
| Largest Contentful Paint (LCP) | 25% | |
| Late (15%) | Time To Interactive (TTI) | 15% |
| Main Thread (25%) | Total Blocking Time (TBT) | 25% |
| Predictability (5%) | Cumulative Layout Shift (CLS) | 5% |
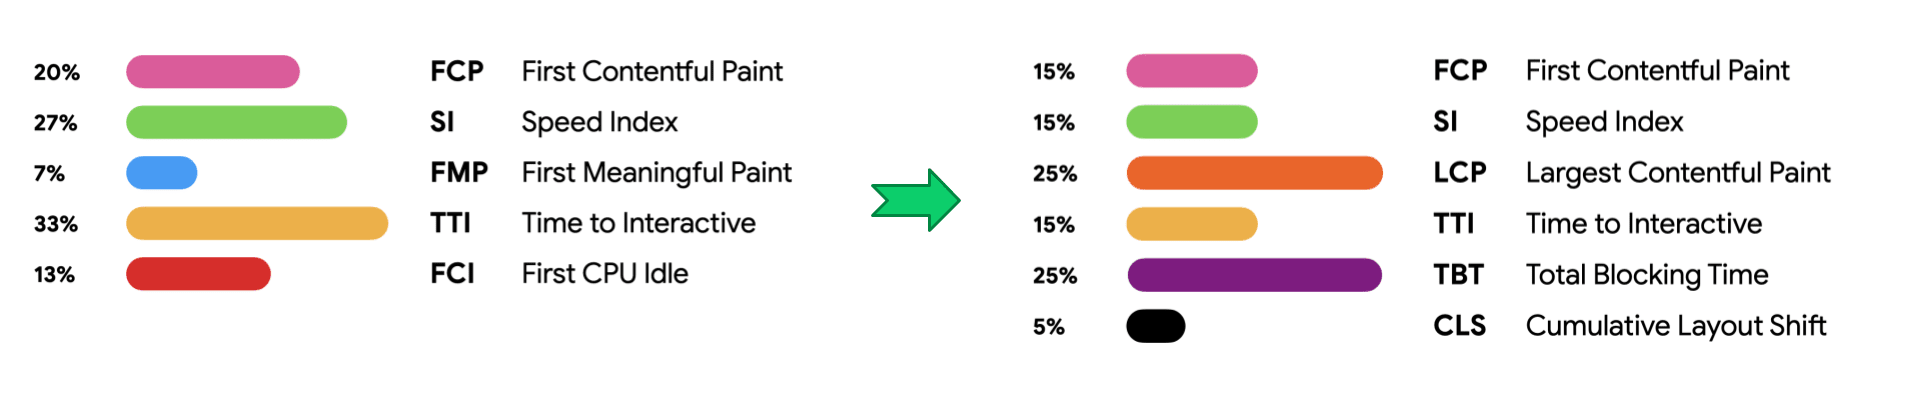
While three new metrics have been added, three old ones have been removed: First Meaningful Paint,
First CPU Idle, and Max Potential FID. The weights of remaining metrics have been modified to
emphasize main thread interactivity and layout predictability.
For comparison, here is version 5 scoring:
| Phase | Metric Name | Weight |
|---|---|---|
| Early (23%) | First Contentful Paint (FCP) | 23% |
| Mid (34%) | Speed Index (SI) | 27% |
| First Meaningful Paint (FMP) | 7% | |
| Finished (46%) | Time to Interactive (TTI) | 33% |
| First CPU Idle (FCI) | 13% | |
| Main Thread | Max Potential FID | 0% |
Some highlights of scoring changes between Lighthouse versions 5 and 6:
- TTI’s weight has been reduced from 33% to 15%. This was in direct response to user
feedback about TTI variability, as well as inconsistencies in metric optimizations leading to
improvements in user experience. TTI is still a useful signal for when a page is fully
interactive, however with TBT as a
complement–variability is reduced.
With this scoring change, we hope developers are more effectively encouraged to optimize for
user interactivity. - FCP’s weight has been reduced from 23% to 15%. Measuring only when the first pixel is
painted (FCP) didn’t give us a complete picture. Combining it with measuring when users are able
to see what they most likely care about (LCP) better reflects the loading experience. - Max Potential FID has been deprecated. It is no longer shown in the report, but is
still available in the JSON. It is now recommended to look at TBT to quantify your interactivity
instead of mpFID. - First Meaningful Paint has been deprecated. This metric was too variant and had no viable
path to standardization as the implementation is specific to Chrome rendering internals. While
some teams do find the FMP timing to be worthwhile on their site, the metric will not receive
additional improvements. - First CPU Idle has been deprecated because it’s not distinct enough from TTI. TBT and TTI
are the go-to metrics for interactivity now. - CLS’s weight is relatively low, though we expect to increase it in a future major version.
Shifts in scores
How do these changes affect the scores of real sites? We have published an
analysis
of the score changes using two datasets: a general set of
sites and a
set of static sites
built with Eleventy. In summary, ~20% of sites see noticeably higher
scores, ~30% have hardly any change, and ~50% see a decrease of at least five points.
The score changes can be broken down into three primary components:
- score weight changes
- bug fixes to underlying metric implementations
- individual score curve changes
Score weight changes and the introduction of three new metrics drove a majority of overall score
changes. New metrics that developers have yet to optimize for carry significant weight in the version 6
performance score. While the average performance score of the test corpus in version 5 was around 50, the average scores on the new Total Blocking Time and Largest Contentful Paint metrics were around 30. Together those two metrics account for 50% of the weight in the Lighthouse version 6 performance score, so naturally a large percentage of sites saw decreases.
Bug fixes to the underlying metric computation can result in different scores. This affects
relatively few sites but can have sizable impact in certain situations. Overall, about 8% of sites
experienced a score improvement due to metric implementation changes and about 4% of sites saw a score
decrease due to metric implementation changes. Approximately 88% of sites were unaffected by these fixes.
Individual score curve changes also impacted the overall score shifts although very slightly. We
periodically ensure that the score curve aligns with the observed metrics in the HTTPArchive
dataset. Excluding sites affected by major implementation changes, minor
adjustments to the score curve for individual metrics improved the scores of about 3% of sites and
decreased the scores of about 4% of sites. Approximately 93% of sites were unaffected by this change.
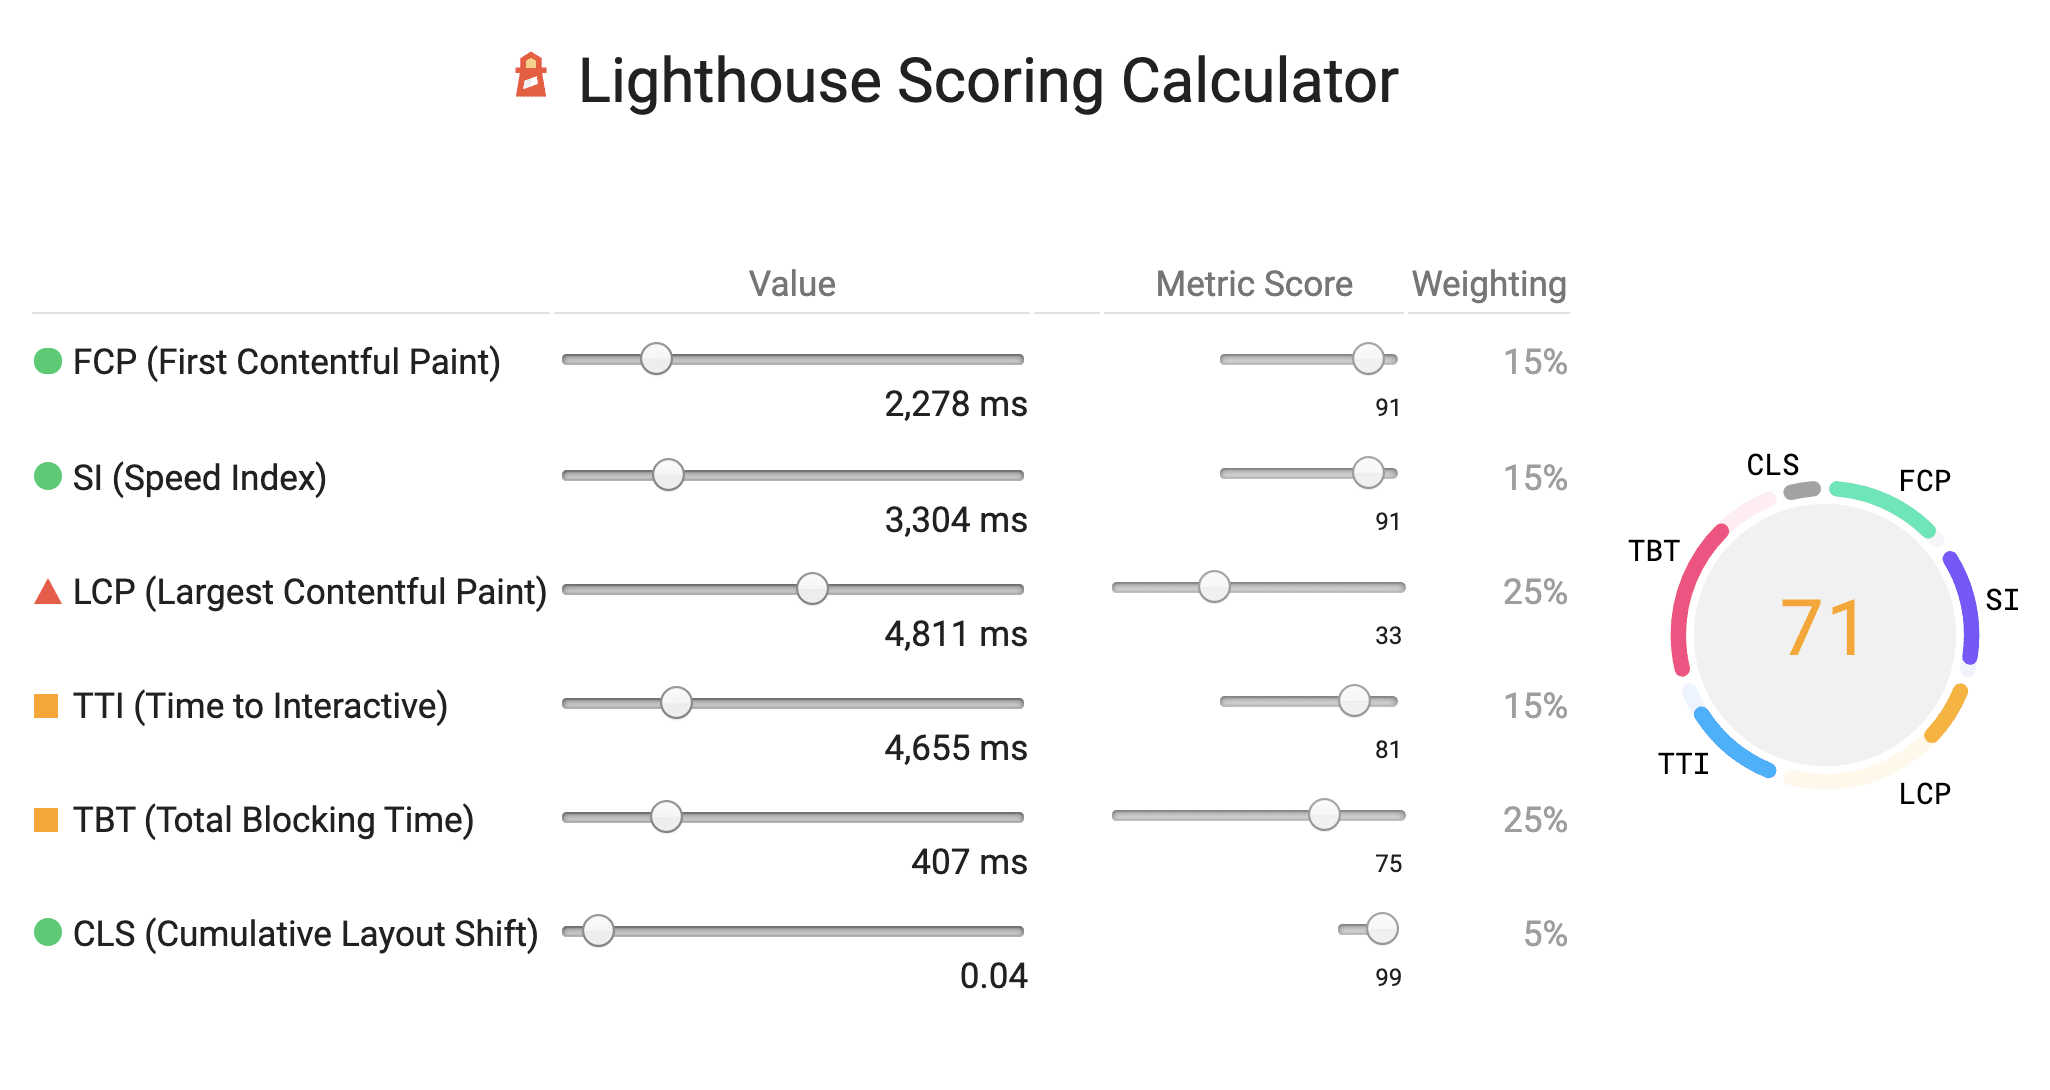
Scoring calculator
We’ve published a scoring calculator to help
you explore performance scoring. The calculator also gives you a comparison between Lighthouse version 5 and
6 scores. When you run an audit with Lighthouse 6.0, the report comes with a link to the calculator
with your results populated.
New audits
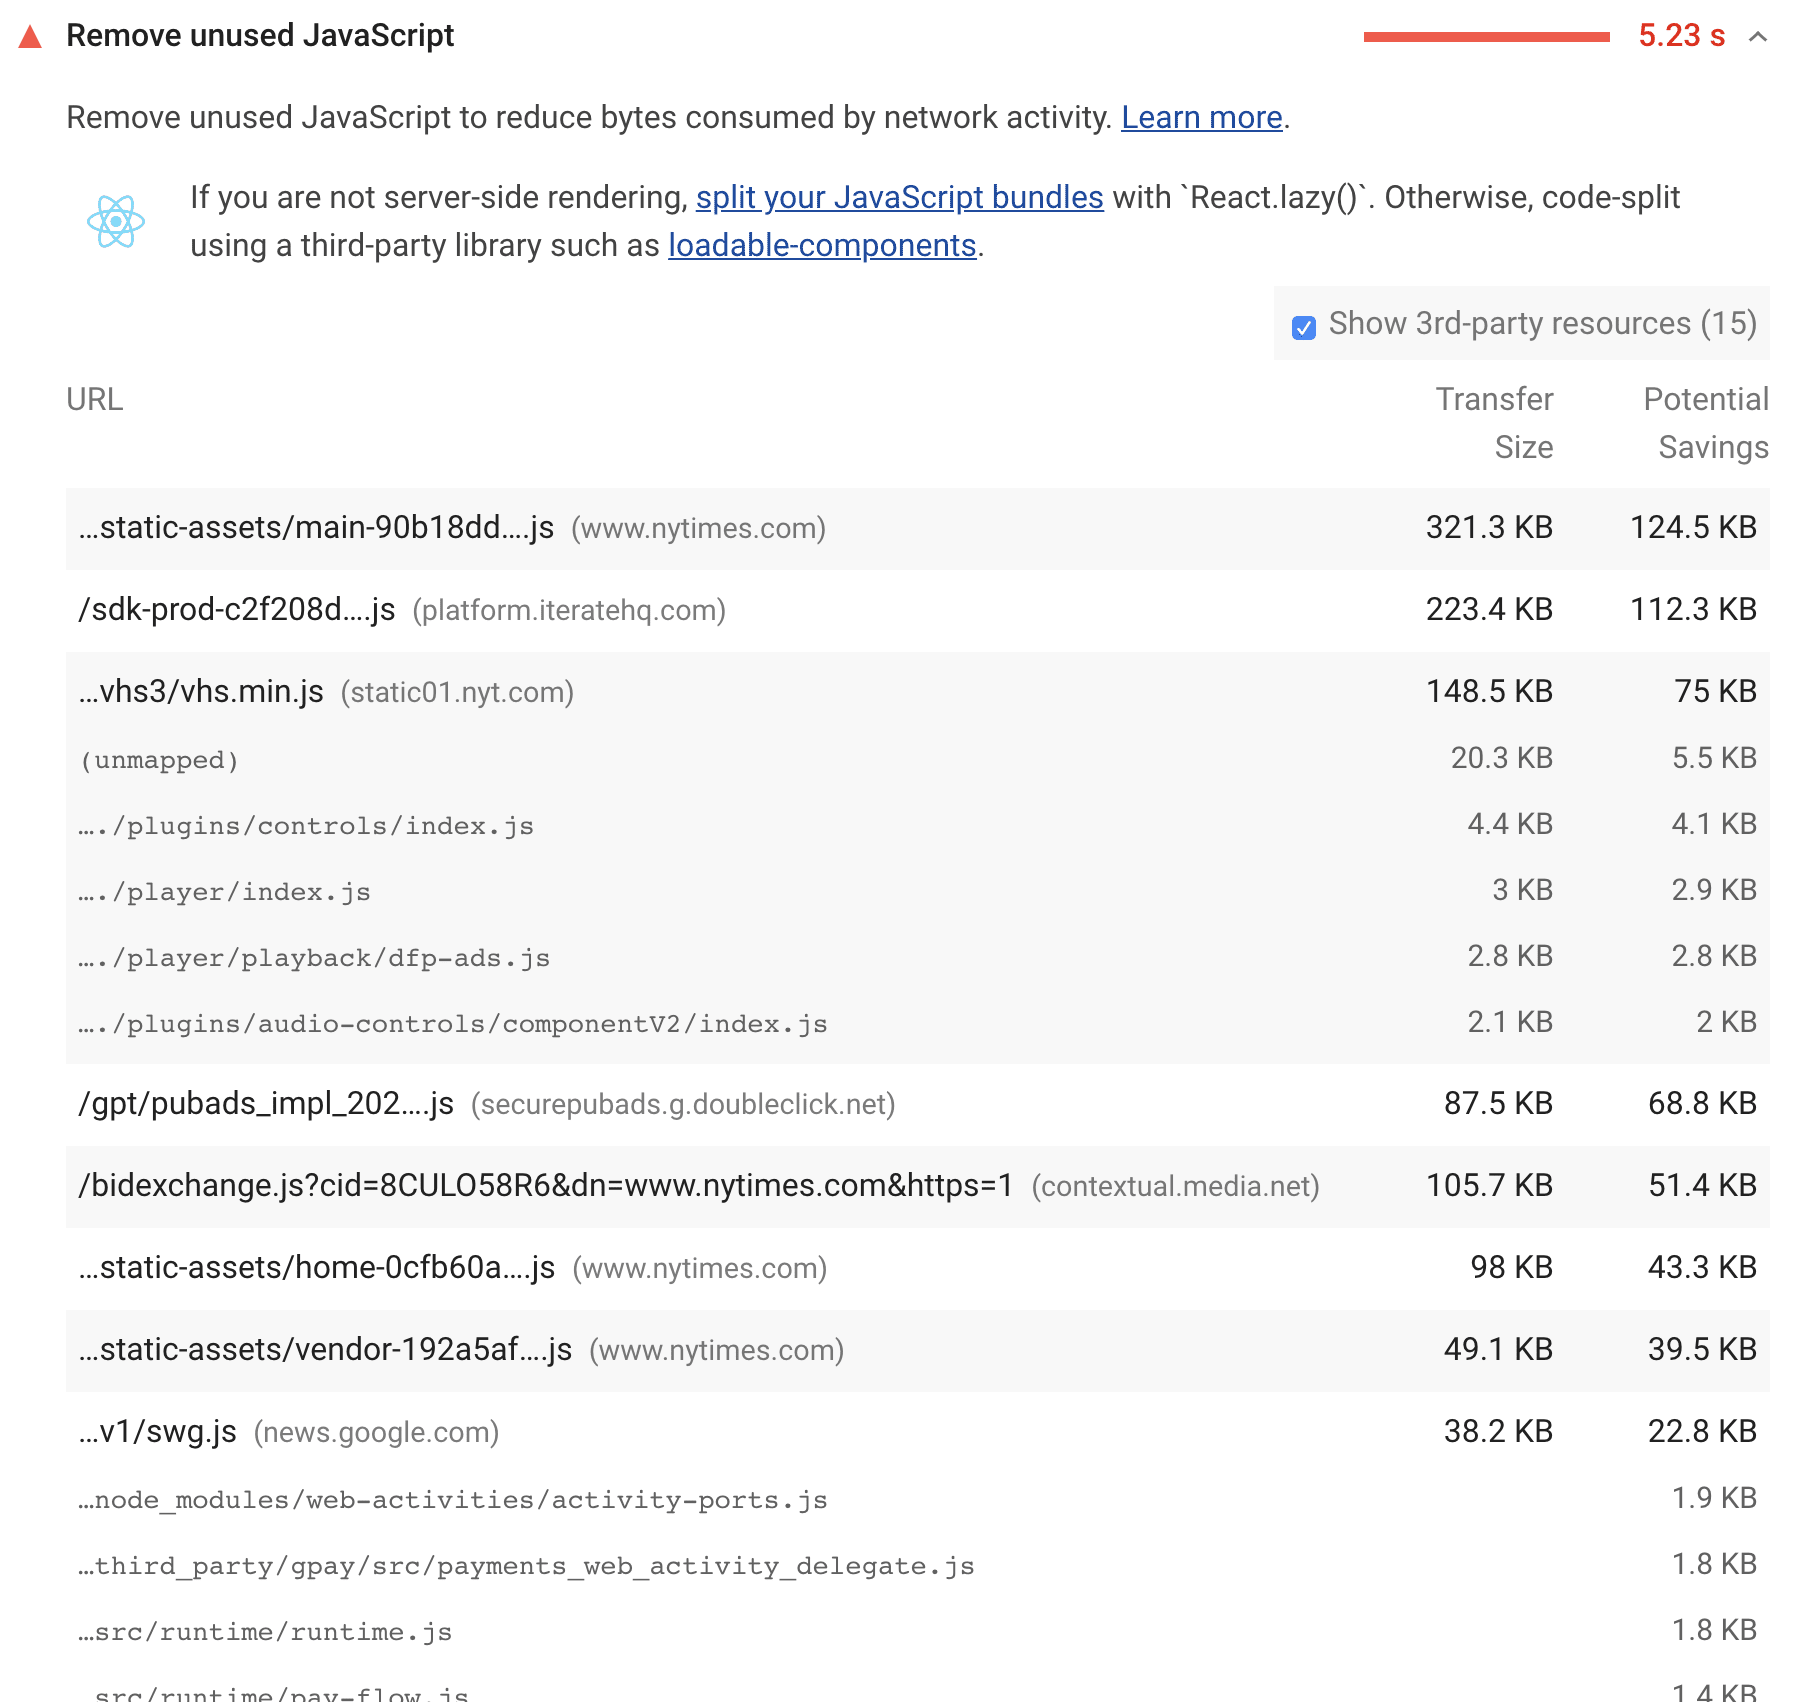
Unused JavaScript
We are leveraging DevTools code
coverage in a new audit: Unused
JavaScript.
This audit isn’t entirely new: it was added in
mid-2017, but
because of the performance overhead it was disabled by default to keep the Lighthouse as fast as
possible. Collecting this coverage data is far more efficient now, so we feel comfortable enabling
it by default.
Accessibility audits
Lighthouse uses the wonderful axe-core library to power the
accessibility category. In Lighthouse 6.0, we’ve added the following audits:
Maskable icon
Maskable icons is a new icon format that makes icons for your PWA
look great across all types of devices. To help your PWA look as good as possible, we’ve introduced
a new audit to check if your manifest.json supports this new format.
Charset declaration
The meta charset element declares what character encoding should be used
to interpret an HTML document. If this element is missing, or if it is declared late in the
document, browsers employ a number of heuristics to guess which encoding should be used. If a
browser guesses incorrectly, and a late meta charset element is found, the parser generally throws
out all the work done so far and starts over, leading to poor experiences for the user. This new
audit verifies the page has a valid character encoding and it’s defined early and up front.
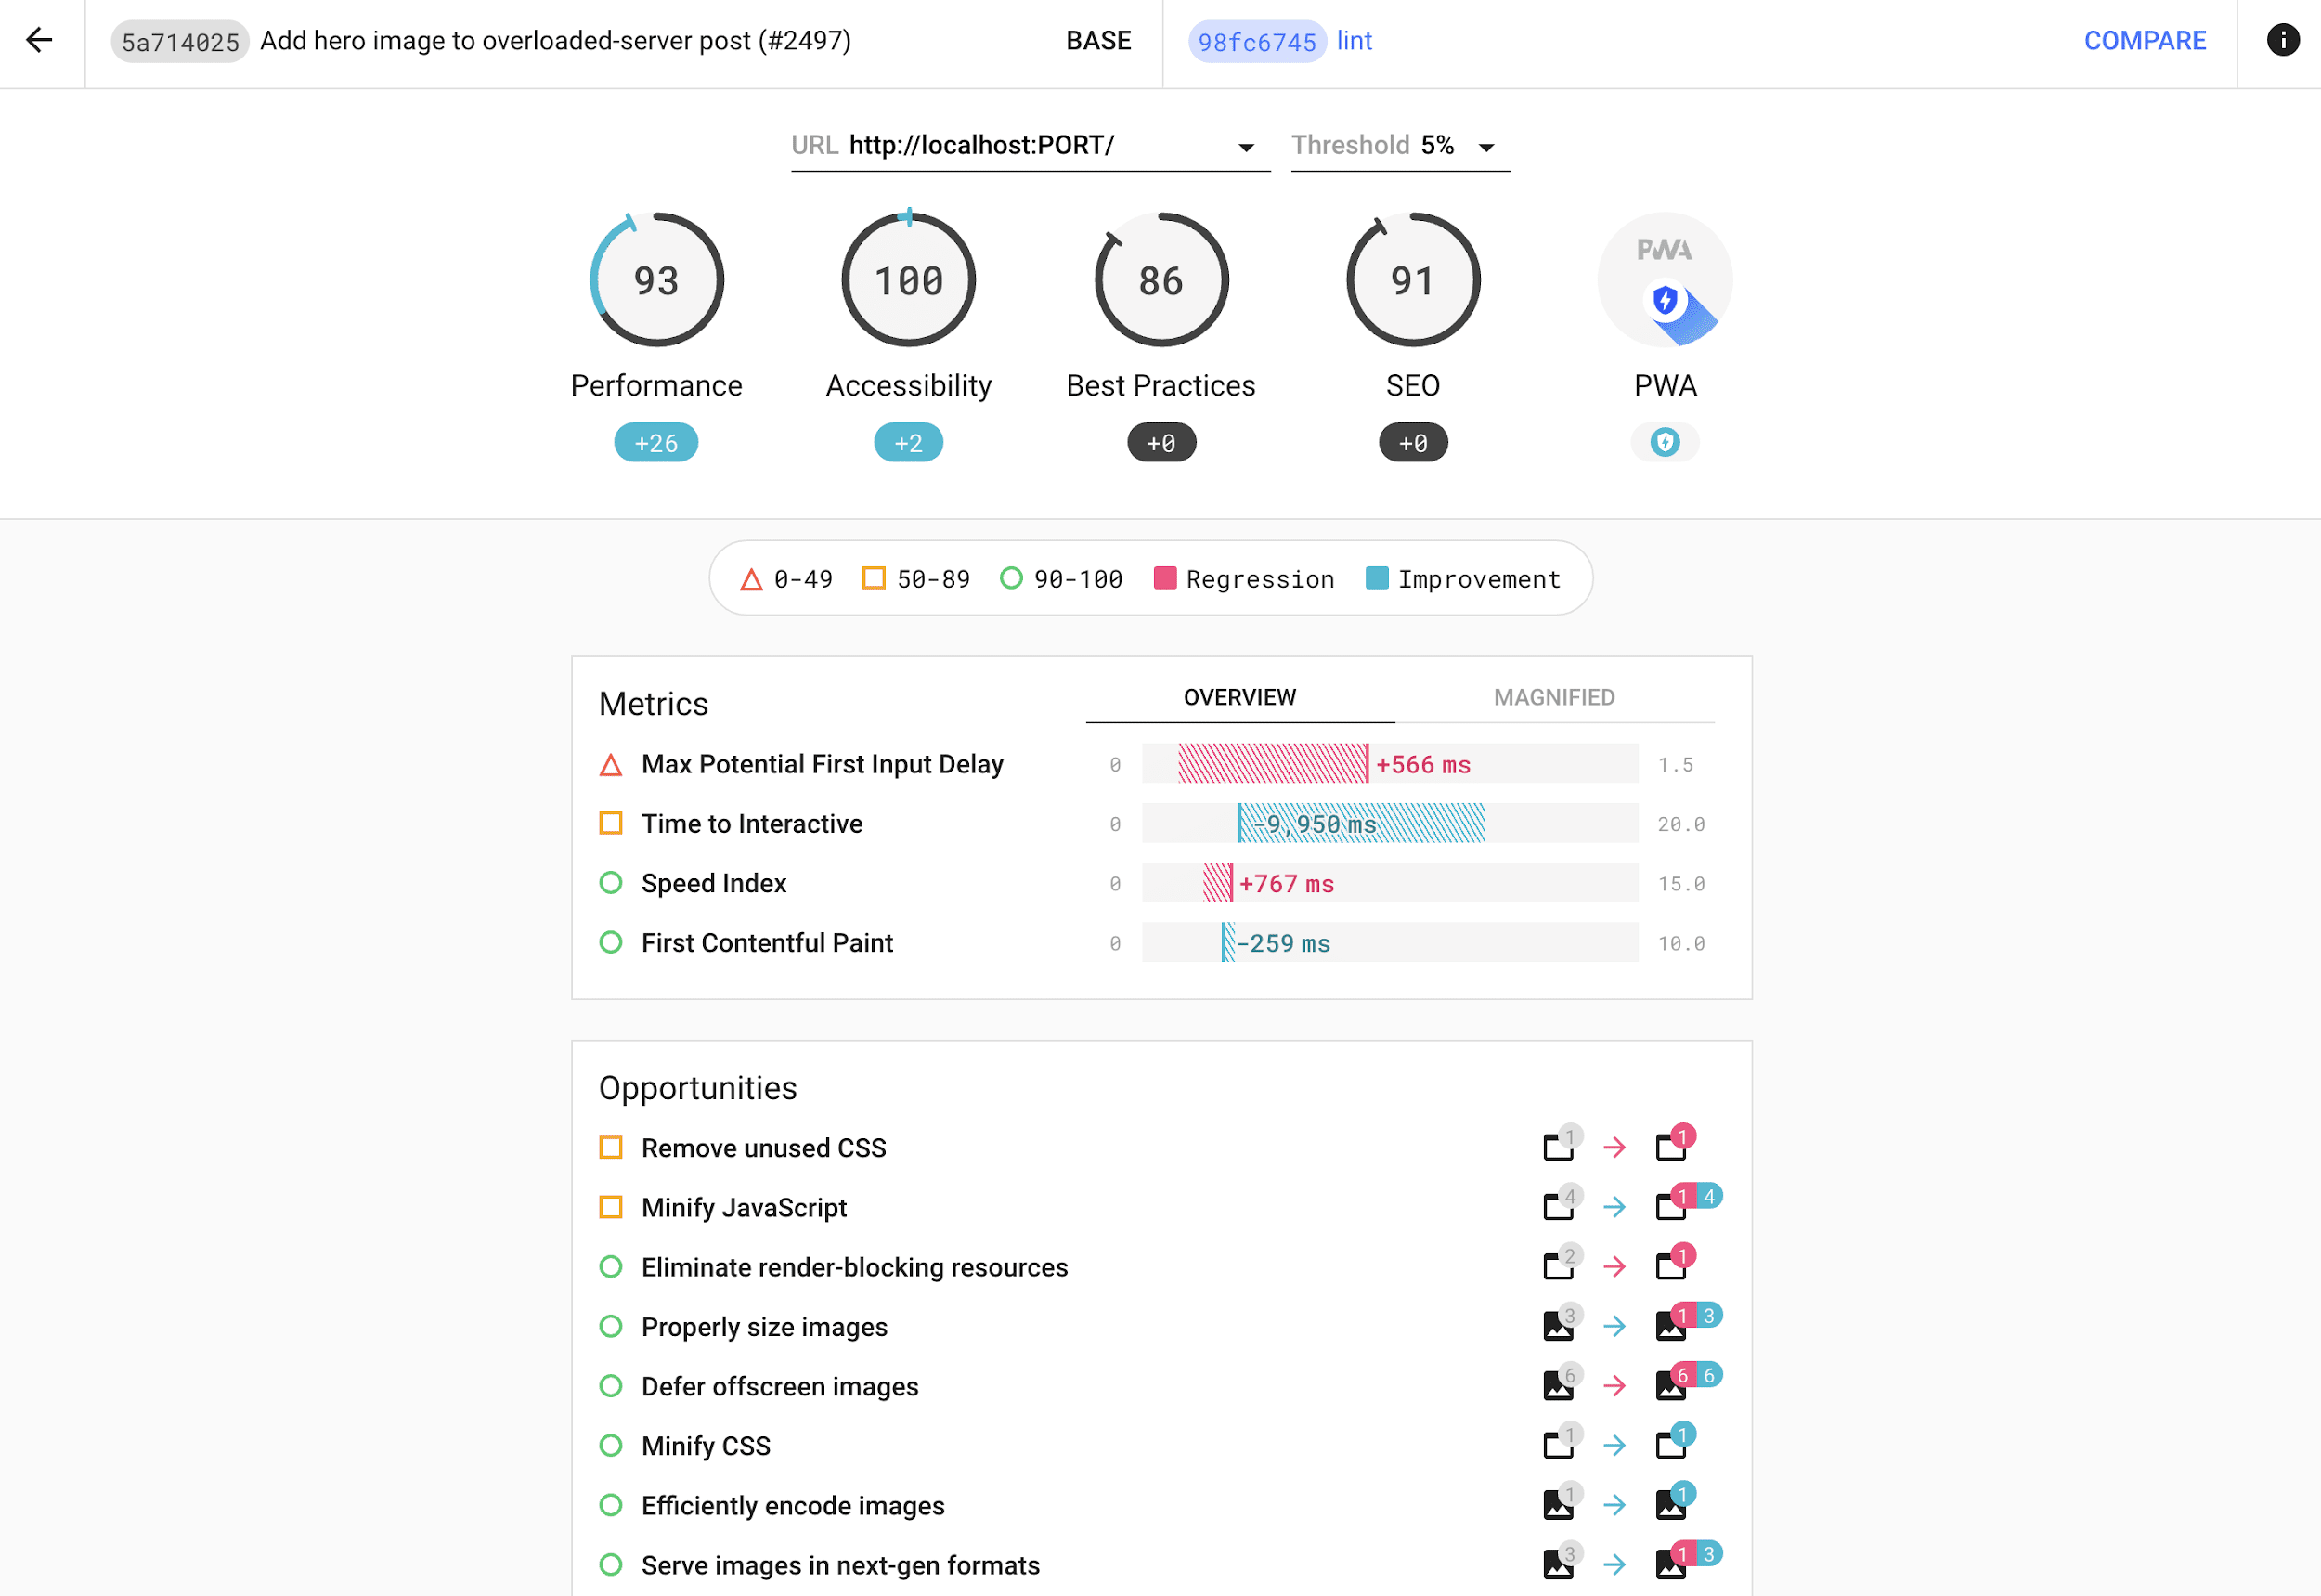
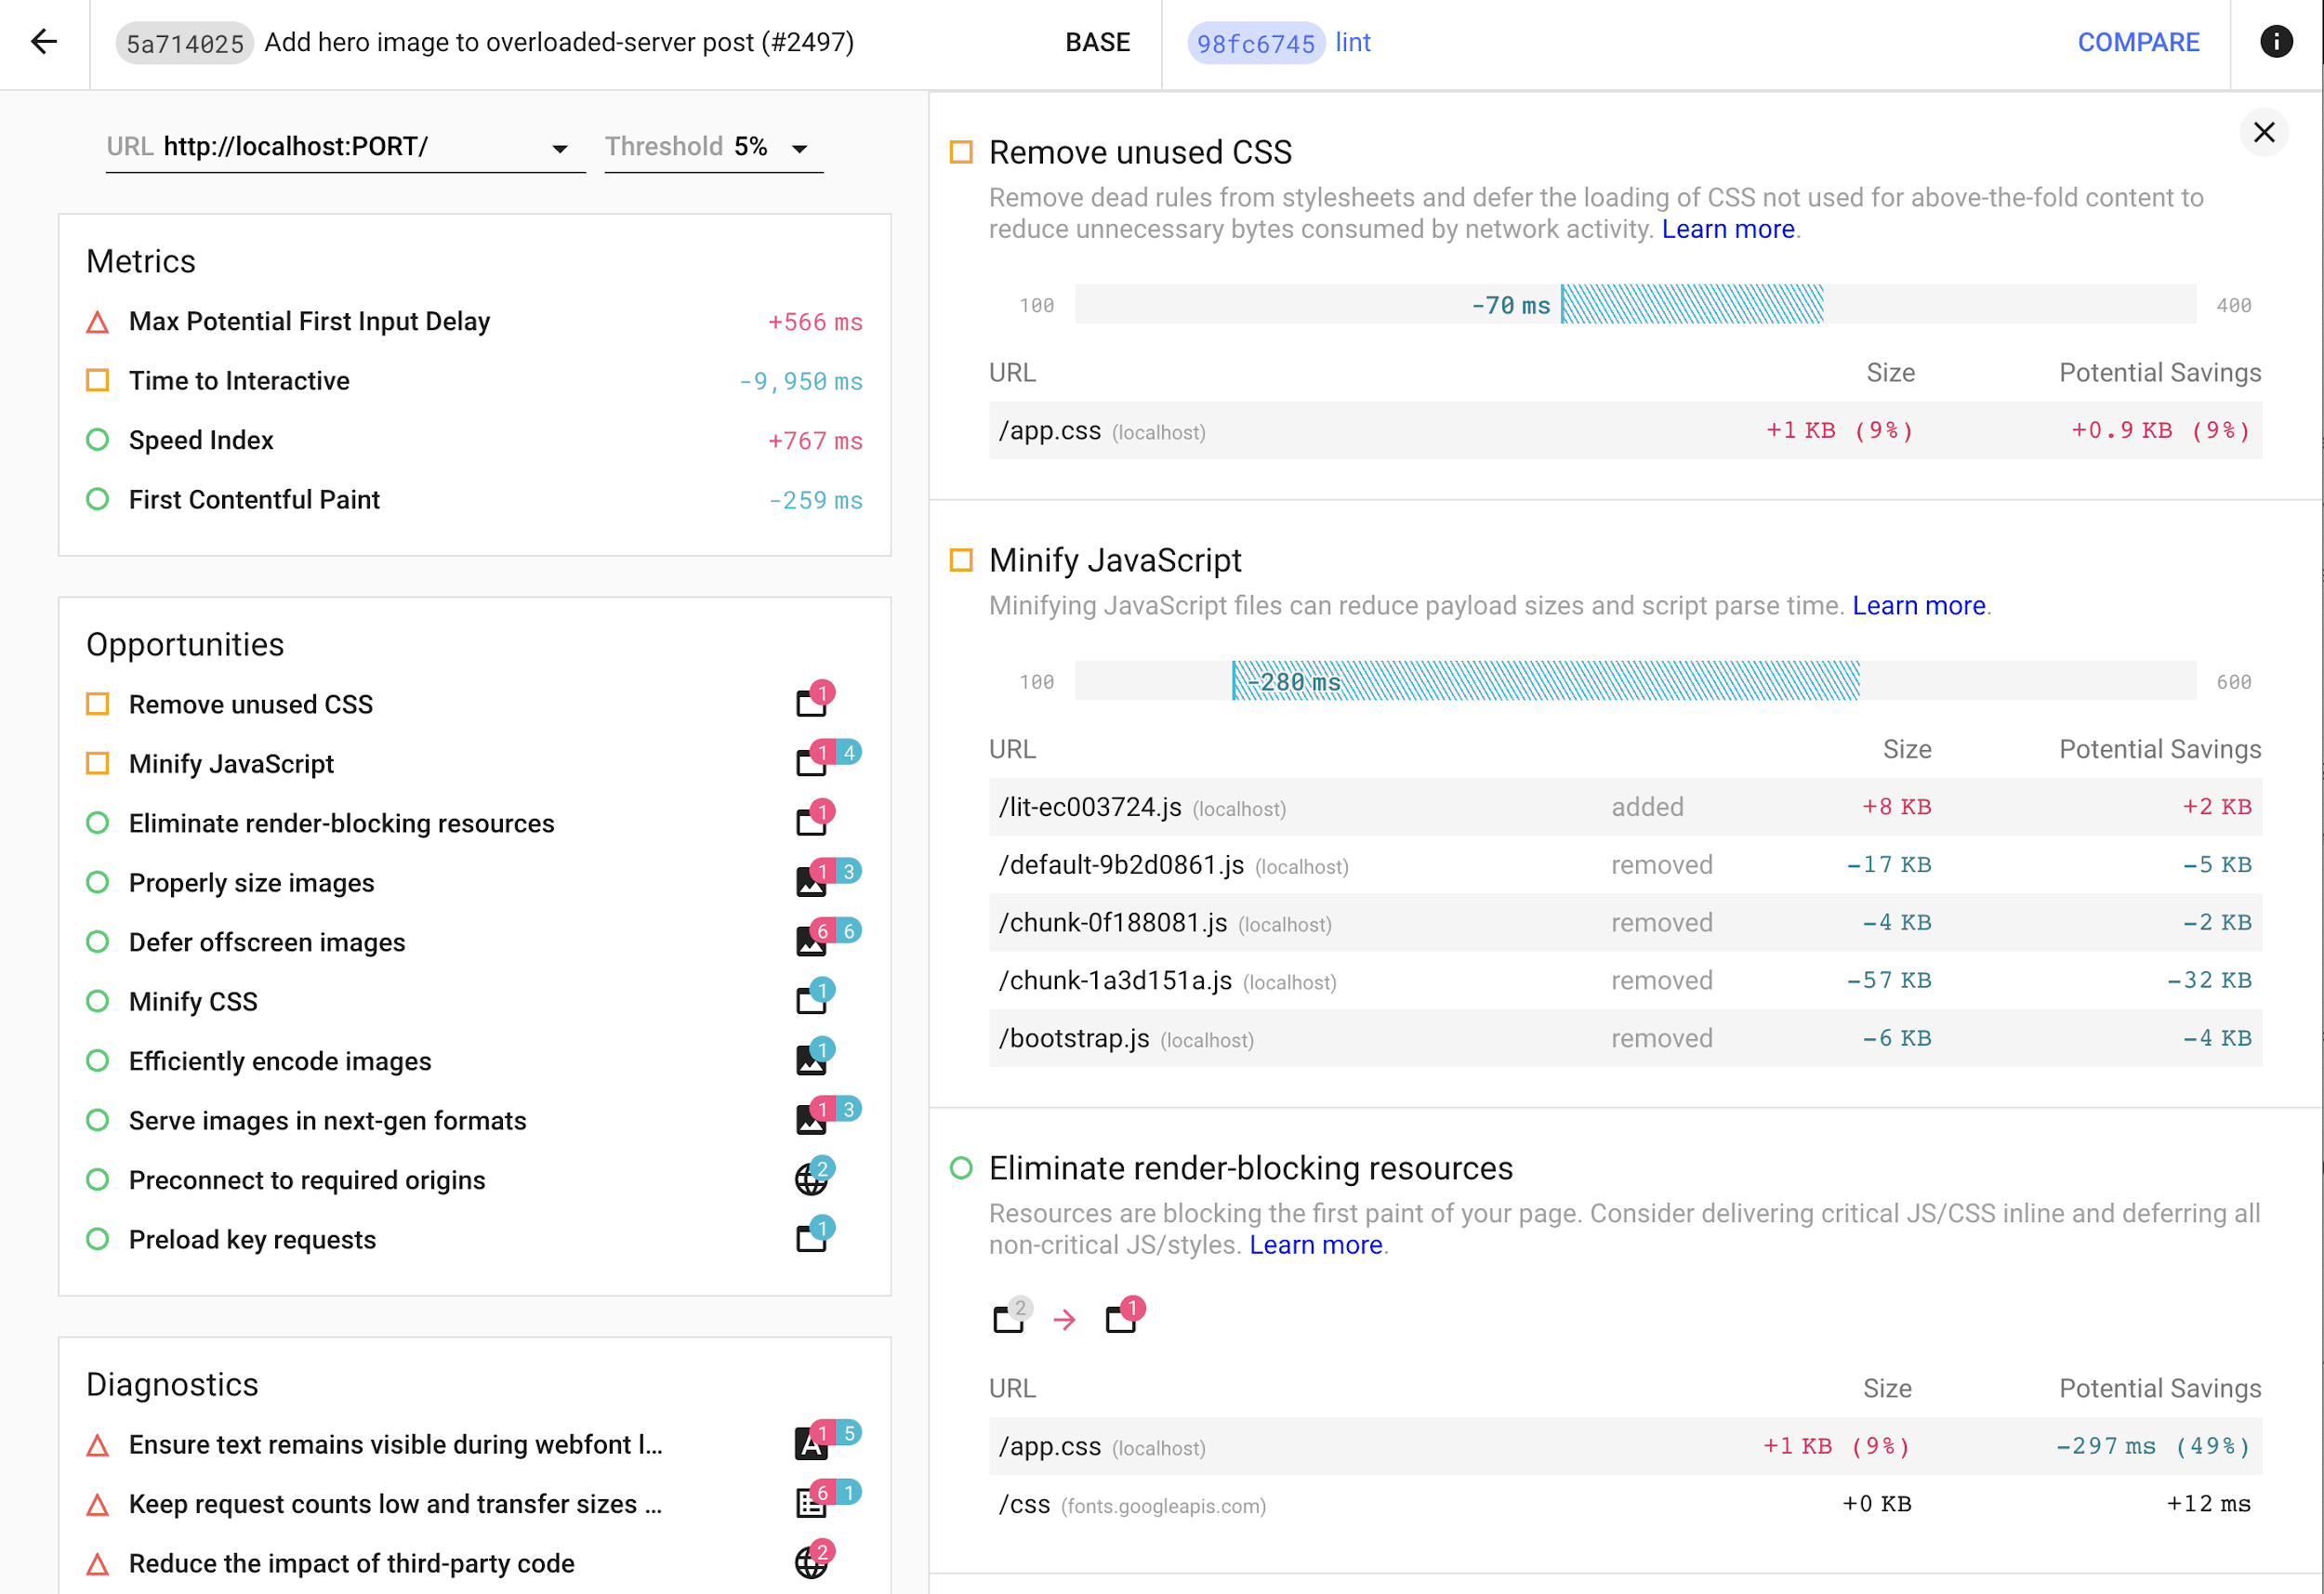
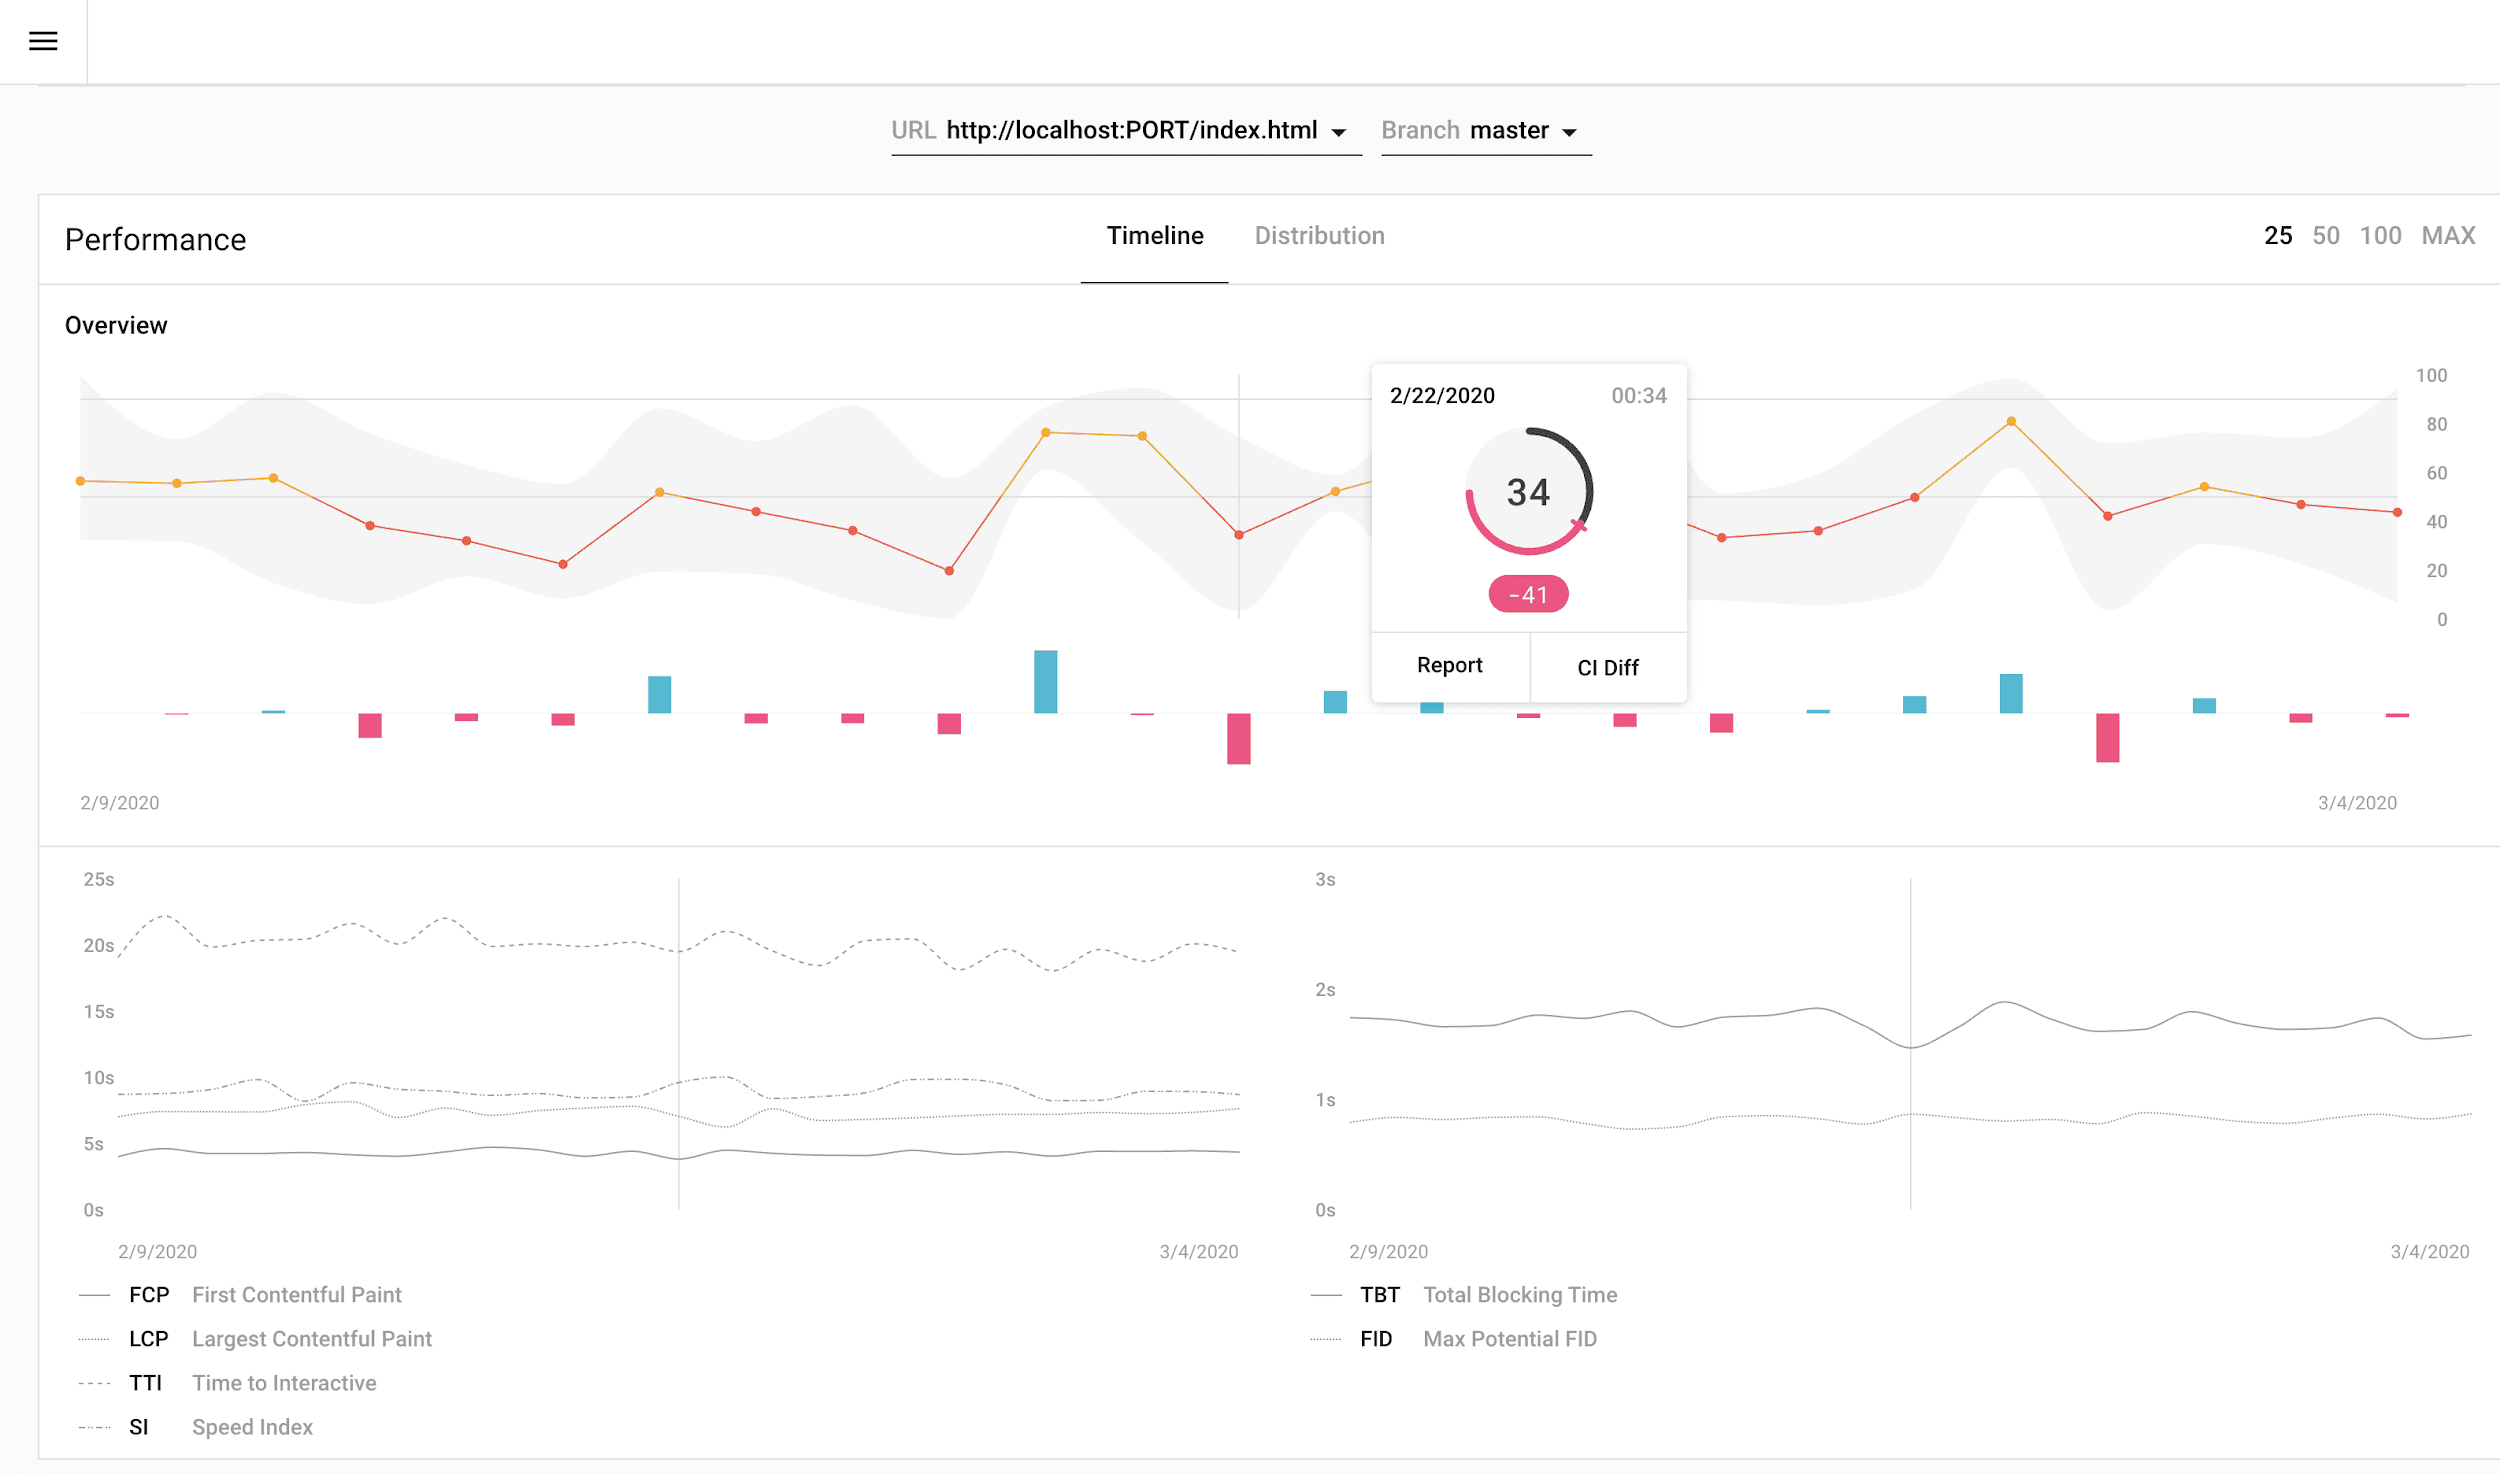
Lighthouse CI
At CDS last November
we announced Lighthouse CI, the open source Node
CLI and server that tracks Lighthouse results on every commit in your continuous integration
pipeline, and we’ve come a long way since the alpha release. Lighthouse CI now has support
for numerous CI providers including Travis, Circle, GitLab, and Github Actions. Ready-to-deploy
docker images make setup a
breeze, and a comprehensive dashboard redesign now reveals trends across every category and metric
in Lighthouse for detailed analysis.
Start using Lighthouse CI on your project today by following our
getting started guide.
We’ve renamed the Audits panel to the Lighthouse panel. Enough said!
Depending on your DevTools window size, the panel is probably behind the » button. You can drag
the tab to change the order.
To quickly reveal the panel with the Command
menu:
- Press
Control+Shift+J(orCommand+Option+Jon Mac) to open DevTools. - Press
Control+Shift+P(orCommand+Shift+Pon Mac) to
open the Command menu. - Start typing «Lighthouse».
- Press
Enter.
Mobile emulation
Lighthouse follows a mobile-first mindset. Performance problems are more apparent under typical
mobile conditions, but developers often don’t test in these conditions. This is why the default
configuration in Lighthouse applies mobile emulation. The emulation consists of:
- Simulated slow network and CPU conditions (via a simulation engine called
Lantern). - Device screen emulation (the same found in Chrome DevTools).
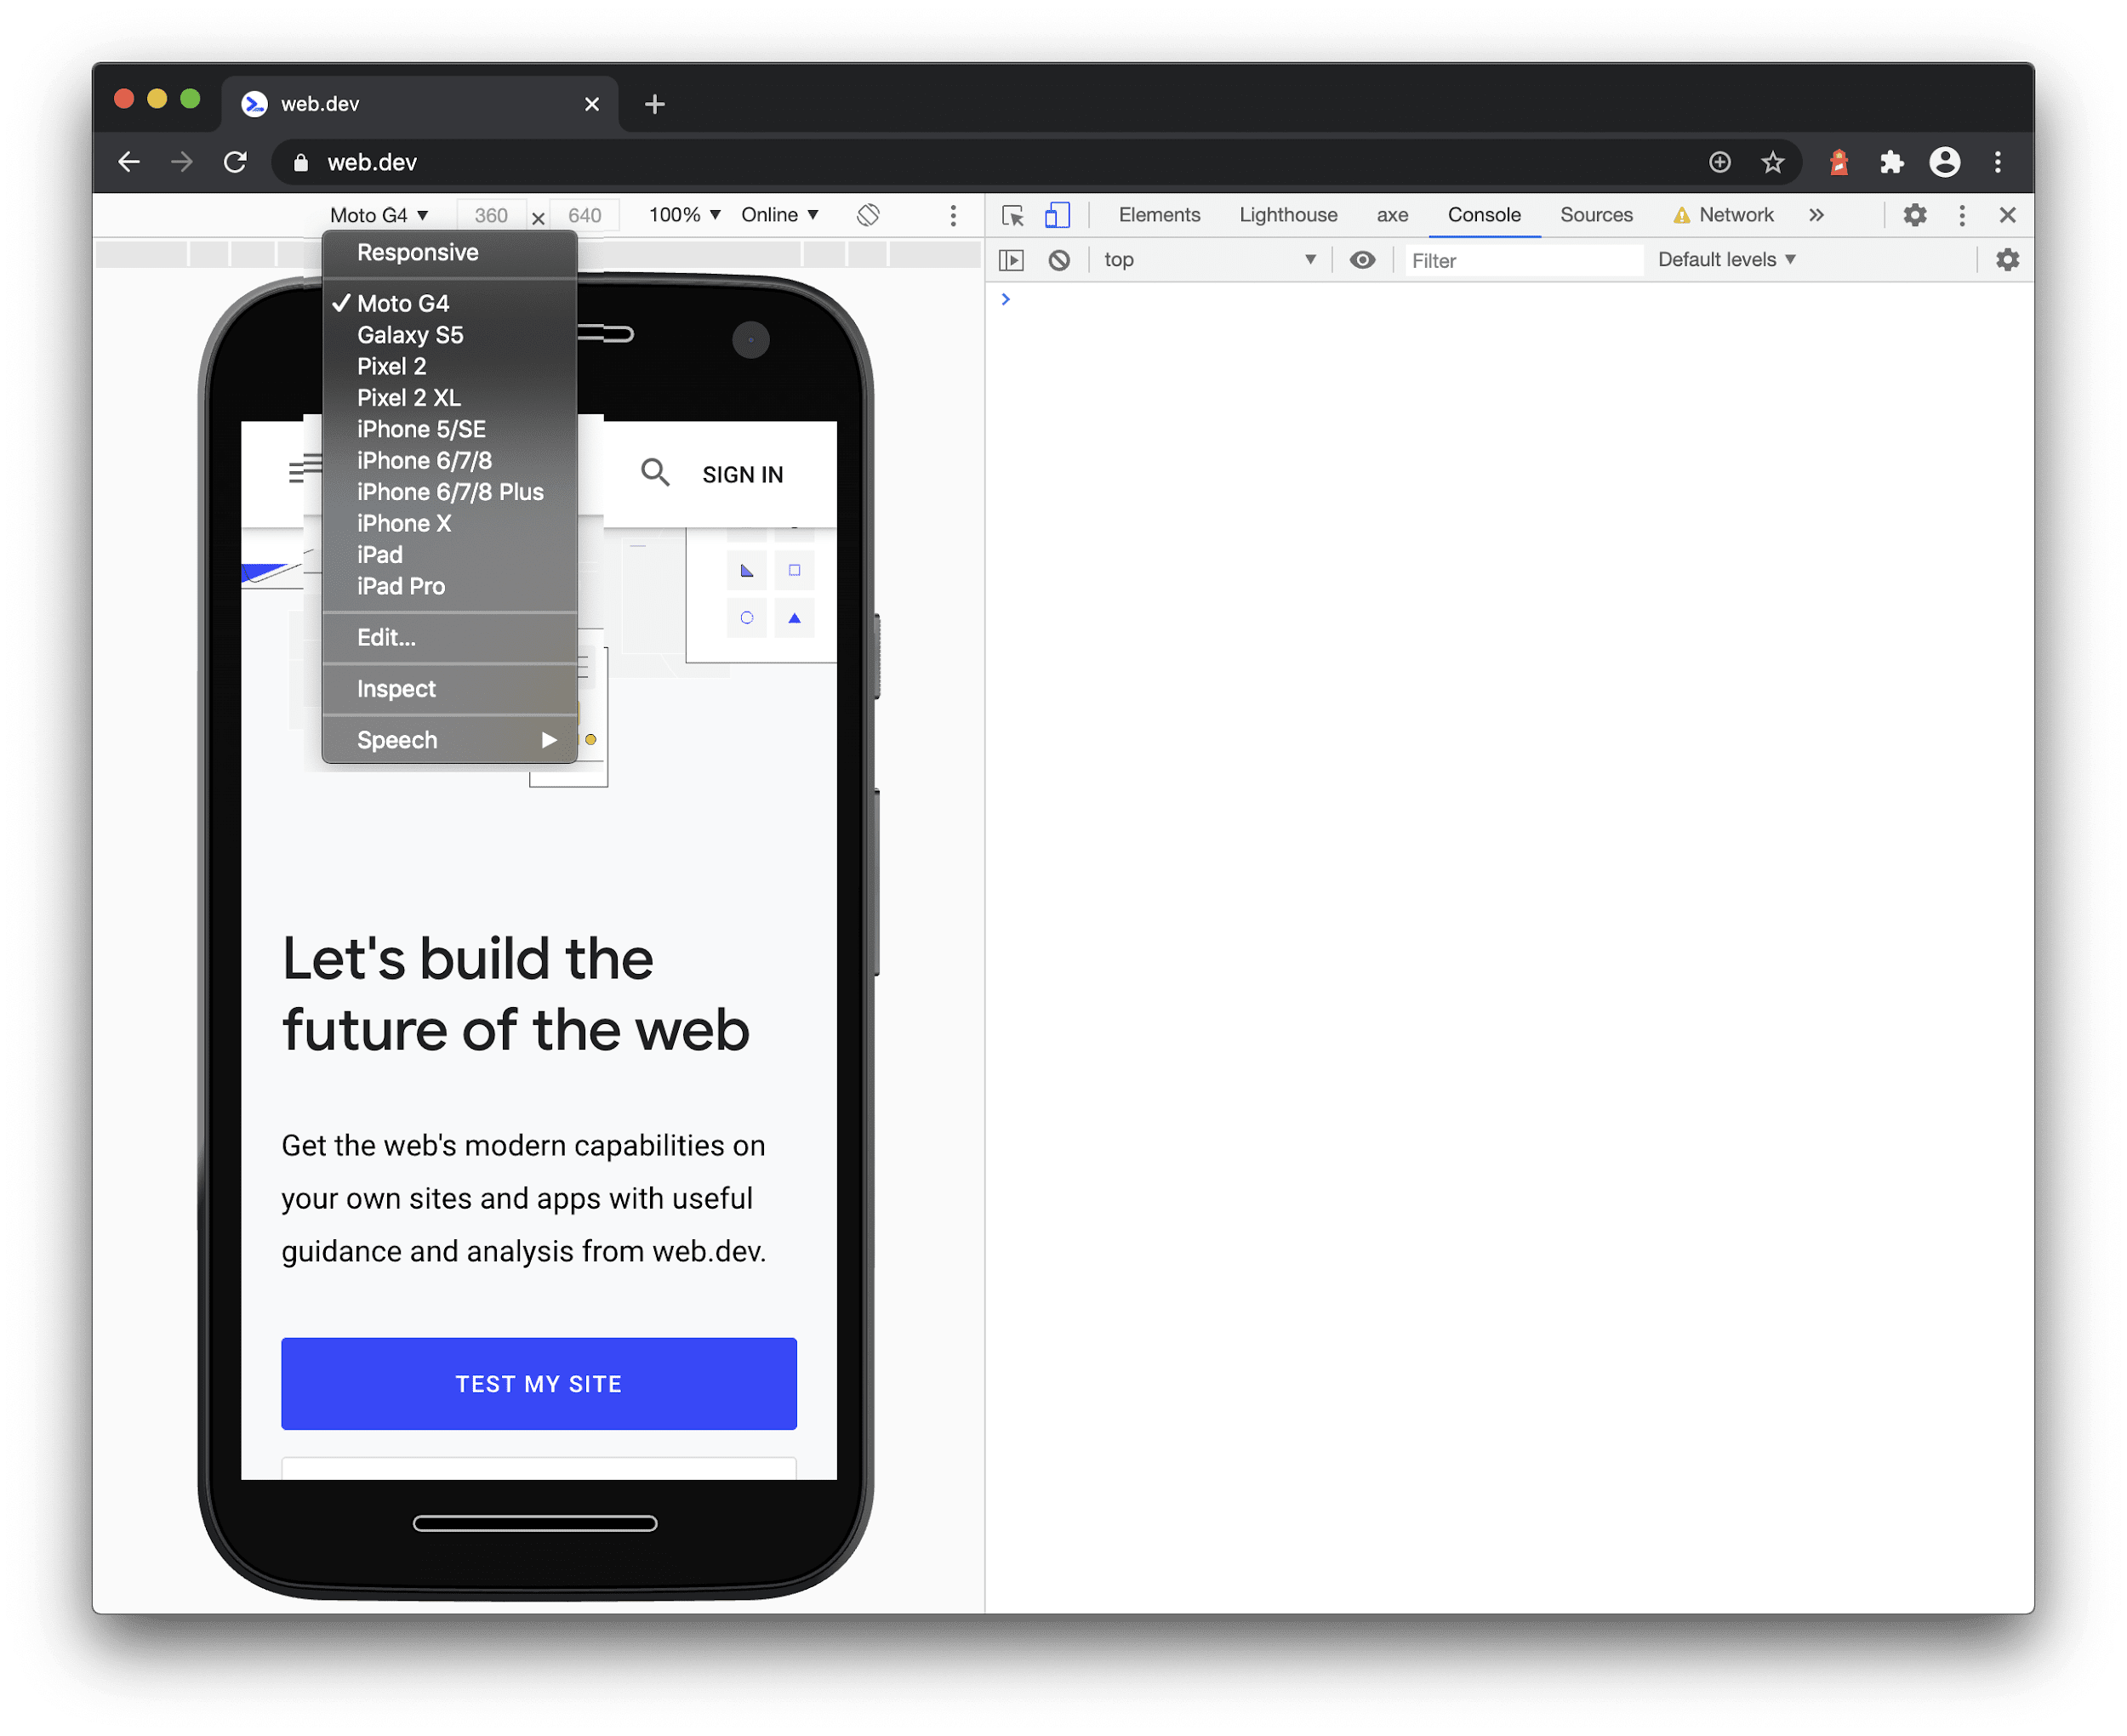
Since the beginning, Lighthouse has used Nexus 5X as its reference device. In recent years, most
performance engineers have been using Moto G4 for testing purposes. Now Lighthouse is following suit
and has changed its reference device to Moto G4. In practice, this change is not very noticeable,
but here are all the changes detectable by a webpage:
- Screen size is changed from 412×660 px to 360×640 px.
- The user agent string is changed slightly, the device portion that was previously
Nexus 5 Build/MRA58N
will now beMoto G (4).
As of Chrome 81, Moto G4 is also available in the Chrome DevTools device emulation list.
Browser extension
The
Chrome extension for Lighthouse
has been a convenient way to run Lighthouse locally. Unfortunately, it was complicated to support.
We felt that because the Chrome DevTools Lighthouse panel is a better experience (the report
integrates with other panels), we could reduce our engineering overhead by simplifying the Chrome
extension.
Instead of running Lighthouse locally, the extension now uses the PageSpeed Insights
API. We recognize that this will
not be a sufficient replacement for some of our users. These are the key differences:
- PageSpeed Insights is unable to audit non-public websites, since it is run via a remote
server and not your local Chrome instance. If you need to audit a non-public website, use
the DevTools Lighthouse panel, or the Node CLI. - PageSpeed Insights is not guaranteed to use the latest Lighthouse release. If you want to use
the latest release, use the Node CLI. The browser extension will get the update ~1-2 weeks after release. - PageSpeed Insights is a Google API, using it constitutes accepting the Google API Terms of
Service. If you do not wish to or cannot accept the terms of service, use the DevTools Lighthouse panel,
or the Node CLI.
The good news is that simplifying the product story allowed us to focus on other engineering
problems. As a result, we released the Lighthouse Firefox
extension!
Budgets
Lighthouse 5.0 introduced performance budgets which
supported adding thresholds for
how much of each resource type
(such as scripts, images, or css) a page can serve.
Lighthouse 6.0 adds
support for budgeting metrics,
so now you can set thresholds for specific metrics such as FCP. For now, budgets are only available
to the Node CLI and Lighthouse CI.
Source location links
Some of the issues that Lighthouse finds about a page can be traced back to a specific line of
source code and the report will state the exact file and line that’s relevant. To make this easy to
explore in DevTools, clicking on the locations specified in the report will open the relevant files
in the Sources panel.
On the horizon
Lighthouse has begun experimenting with collecting source maps to power new features, such as:
- Detecting duplicate modules in JavaScript bundles.
- Detecting excessive polyfills or transforms in code sent to modern browsers.
- Augmenting the Unused JavaScript audit to provide module-level granularity.
- Treemap visualizations highlighting the modules that require action.
- Displaying the original source code for report items with a «source location».
These features will be enabled by default in a future version of Lighthouse. For now, you can view
Lighthouse’s experimental audits with the following CLI flag:
lighthouse https://web.dev --view --preset experimentalThank you!
We thank you for using Lighthouse and providing feedback. Your feedback helps us improve Lighthouse
and we hope Lighthouse 6.0 will make it easier for you to improve the performance of your
websites.
What can you do next?
- Open Chrome Canary and give the Lighthouse panel a go.
- Use the Node CLI:
npm install -g lighthouse && lighthouse https://yoursite.com --view. - Get Lighthouse CI running with
your project. - Review the Lighthouse audit documentation.
- Have fun making the web better!
We’re passionate about the web and we love working with the developer community to build tooling to
help improve the web. Lighthouse is an open source project and we extend a huge thanks to all the
contributors helping out with everything from typo fixes to documentation refactors to brand new
audits.
Interested in contributing?
Swing by the Lighthouse GitHub repo.