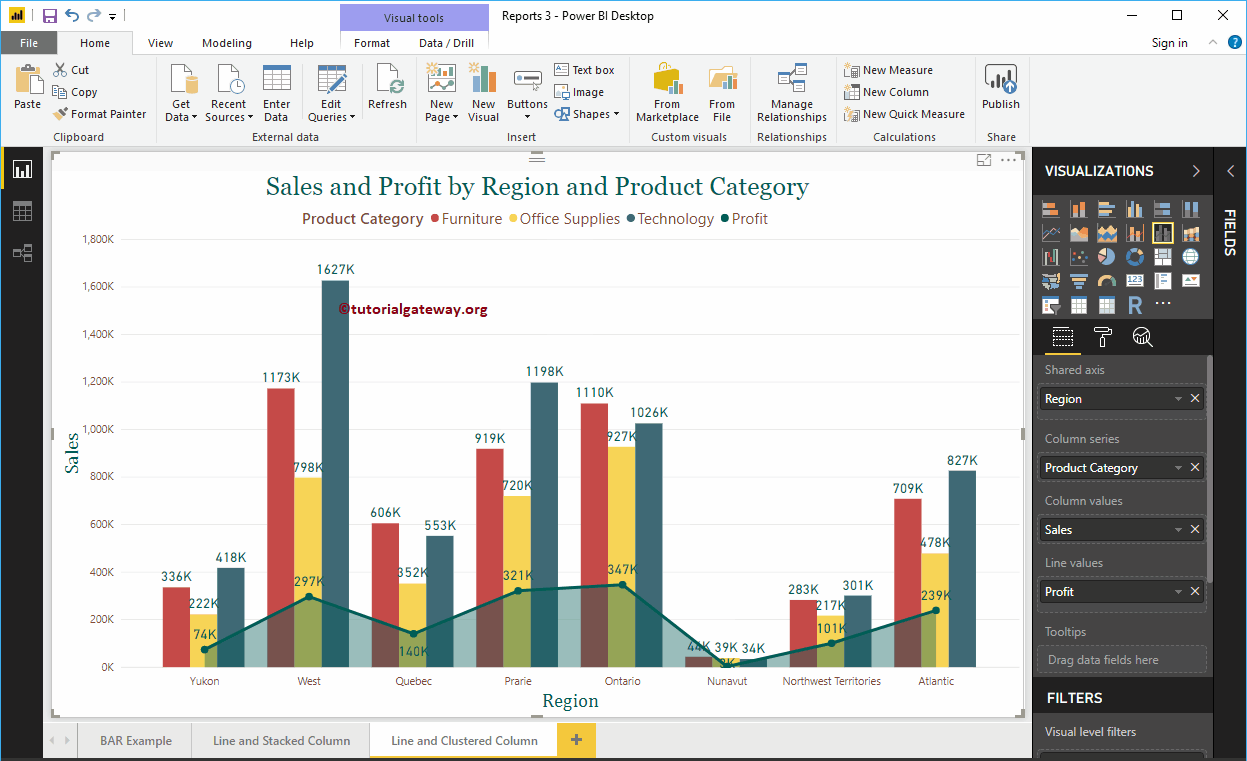
The clustered column and line chart in Power BI is useful for visualizing multiple dimensions and measures. Let me show you how to create a clustered column chart and of ...
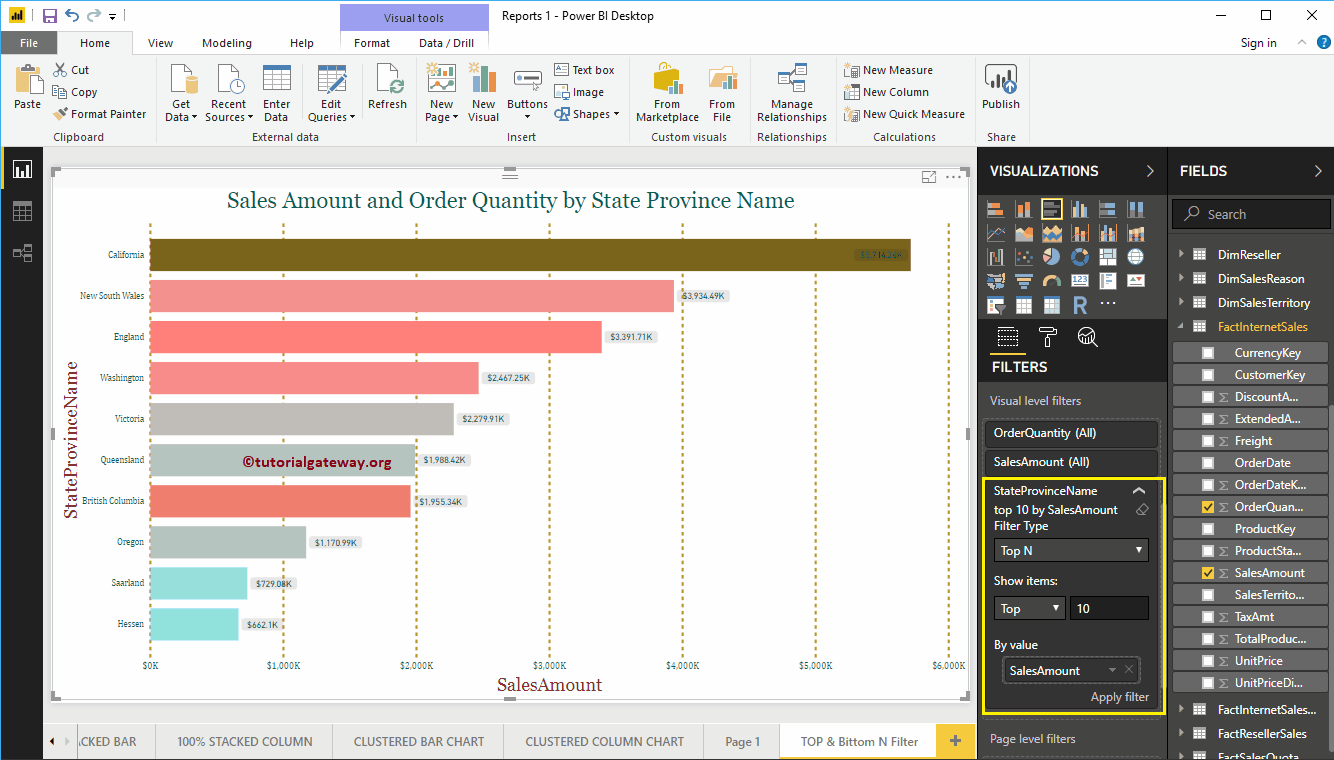
Power BI's Top N filters are useful for displaying the best performing records, and the Bottom N filters are useful for displaying the lowest… records.
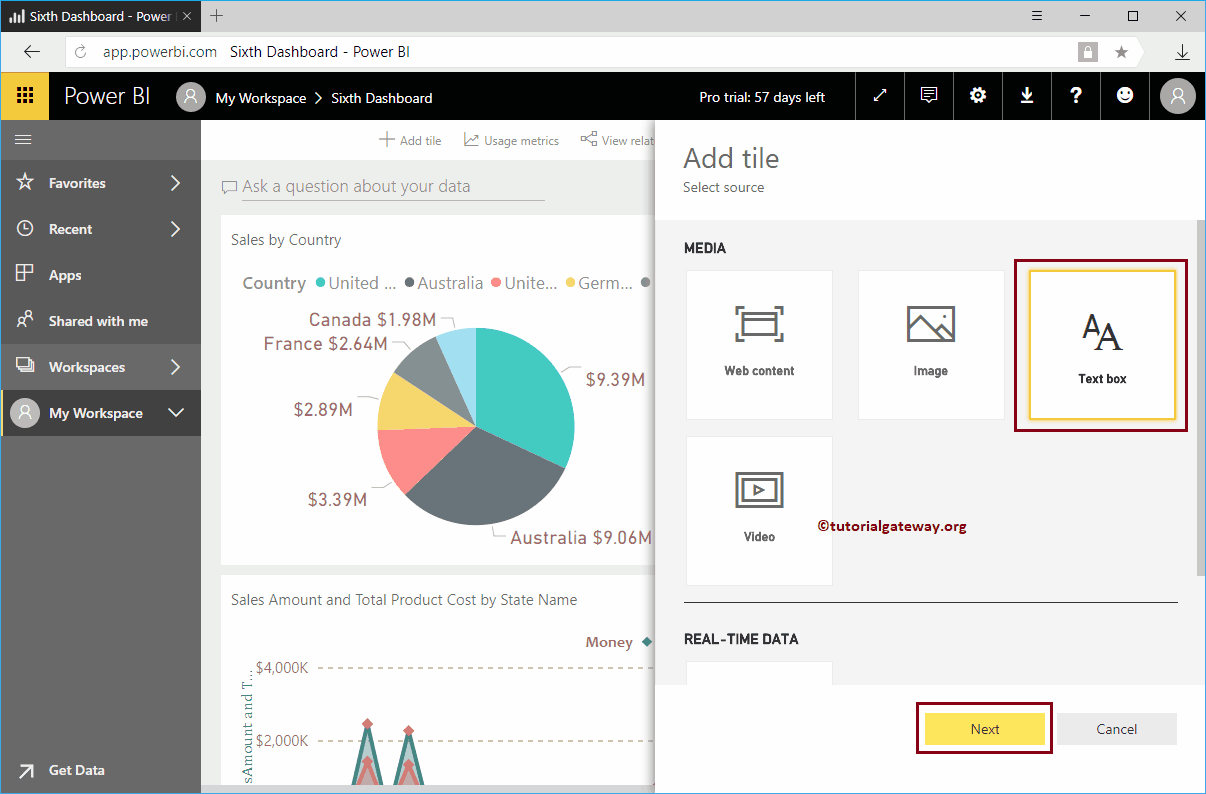
How to add a title to the Power BI dashboard with an example? For this demo of Add Title to Power BI Dashboard, we'll be using the sixth dashboard. How to add a ...
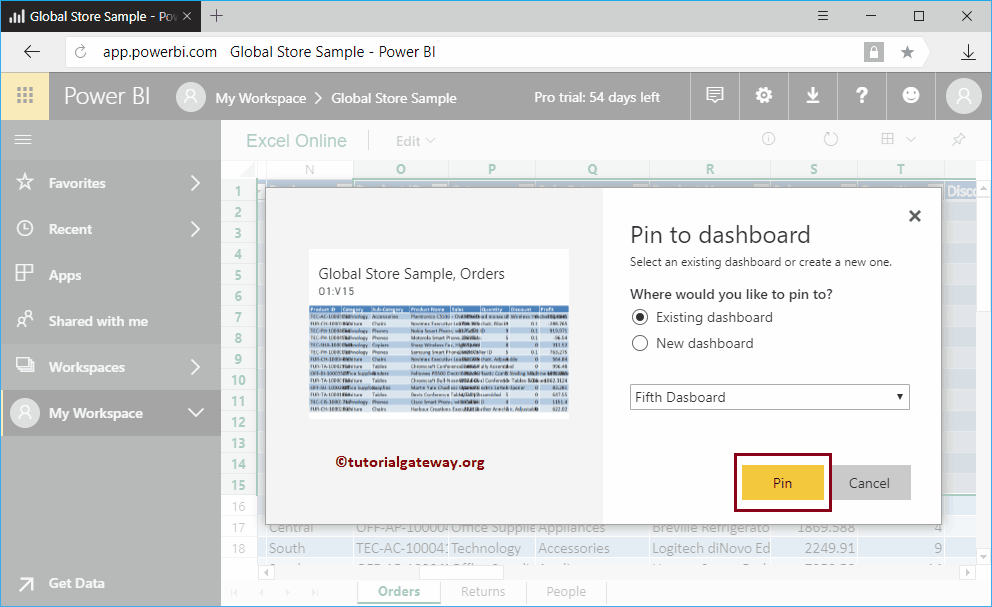
Let me show you the step-by-step approach to pinning workbooks to the Power BI dashboard with a practical example. Before you start anchoring your workbooks,…
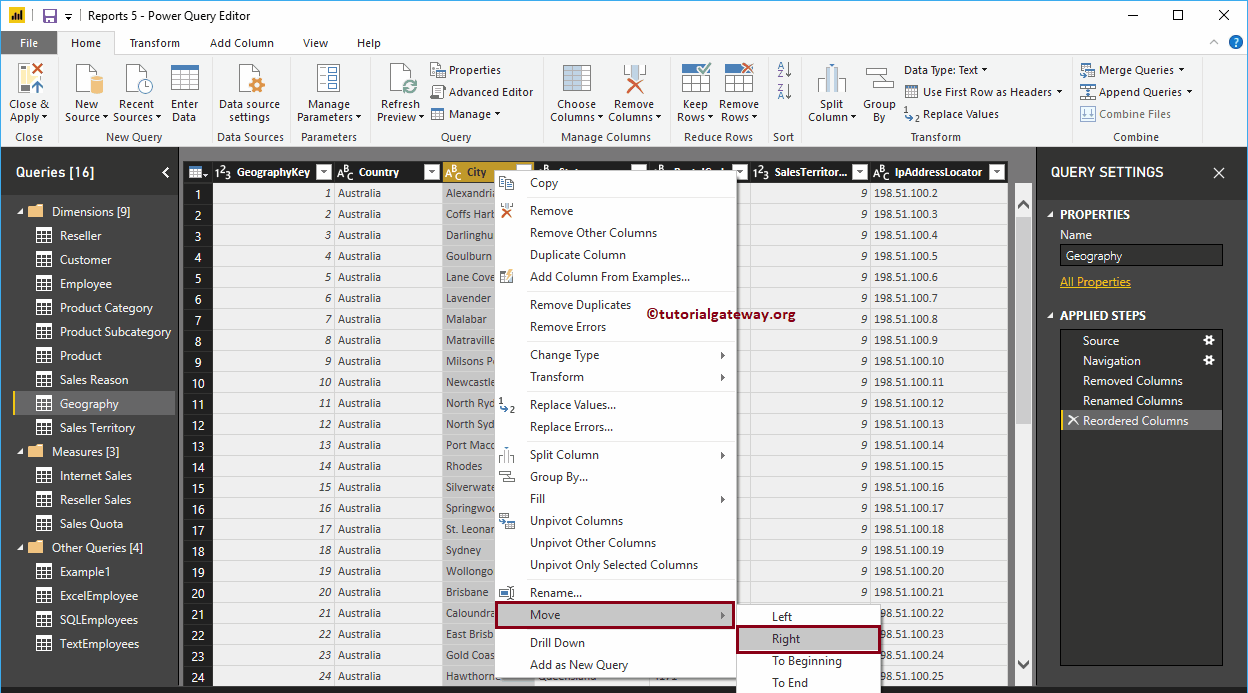
Generally, the data we get from the source may have few columns that may not be necessary for the purpose of the analysis. Let me show you the steps to remove or ...
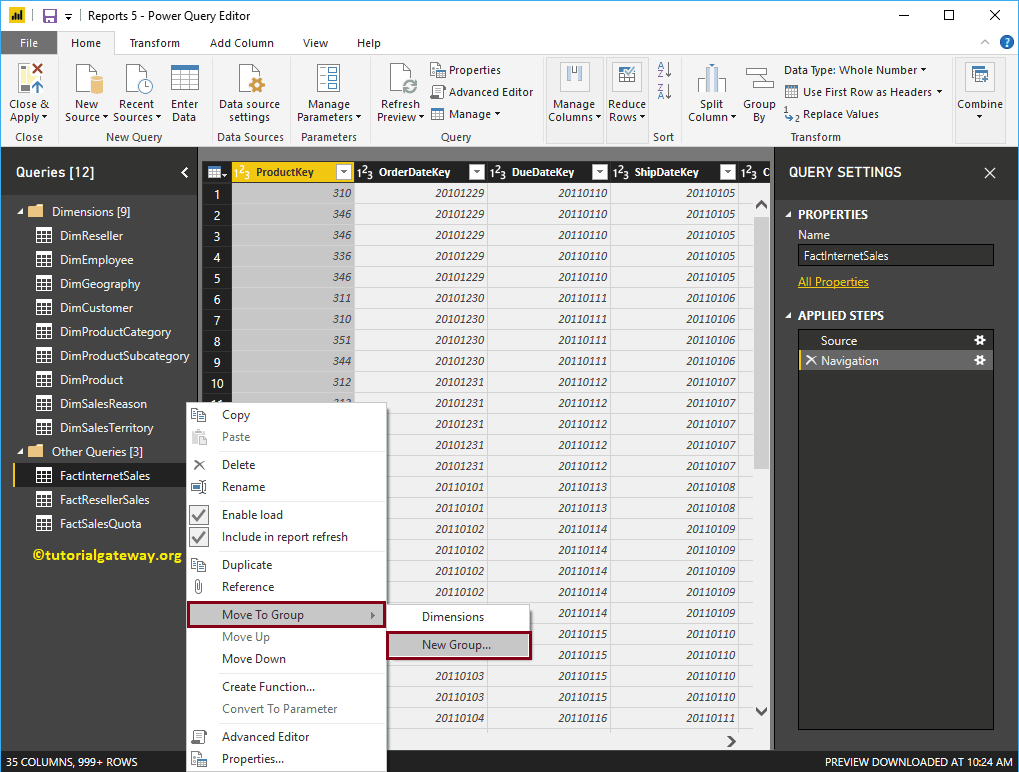
This article shows the steps to create query groups in Power BI with an example. In general, the tables we load from source are arranged alphabetically. Without…
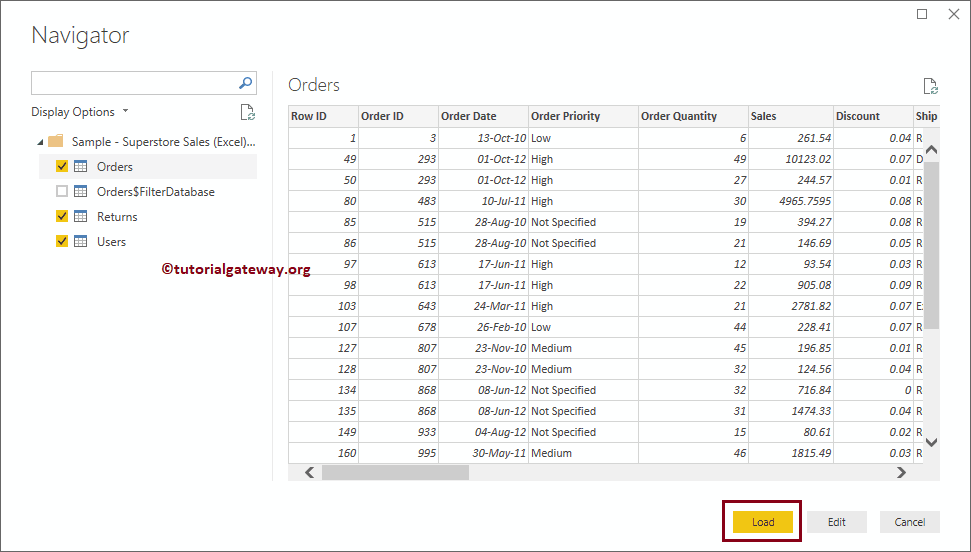
In this article, we show you how to connect Power BI to multiple Excel sheets and how to use the data present in those Excel sheets. To demonstrate the connection of ...
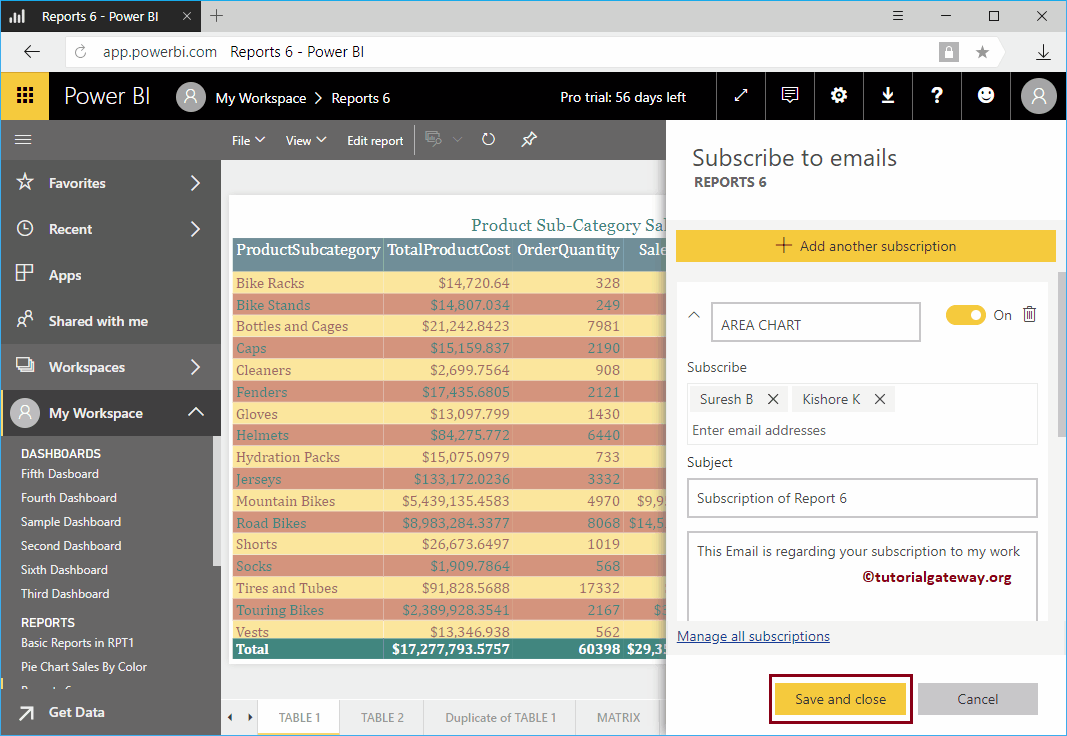
Let me show you the procedure to subscribe the Power BI report with a practical example. Before you begin the Power BI email report subscription process,…