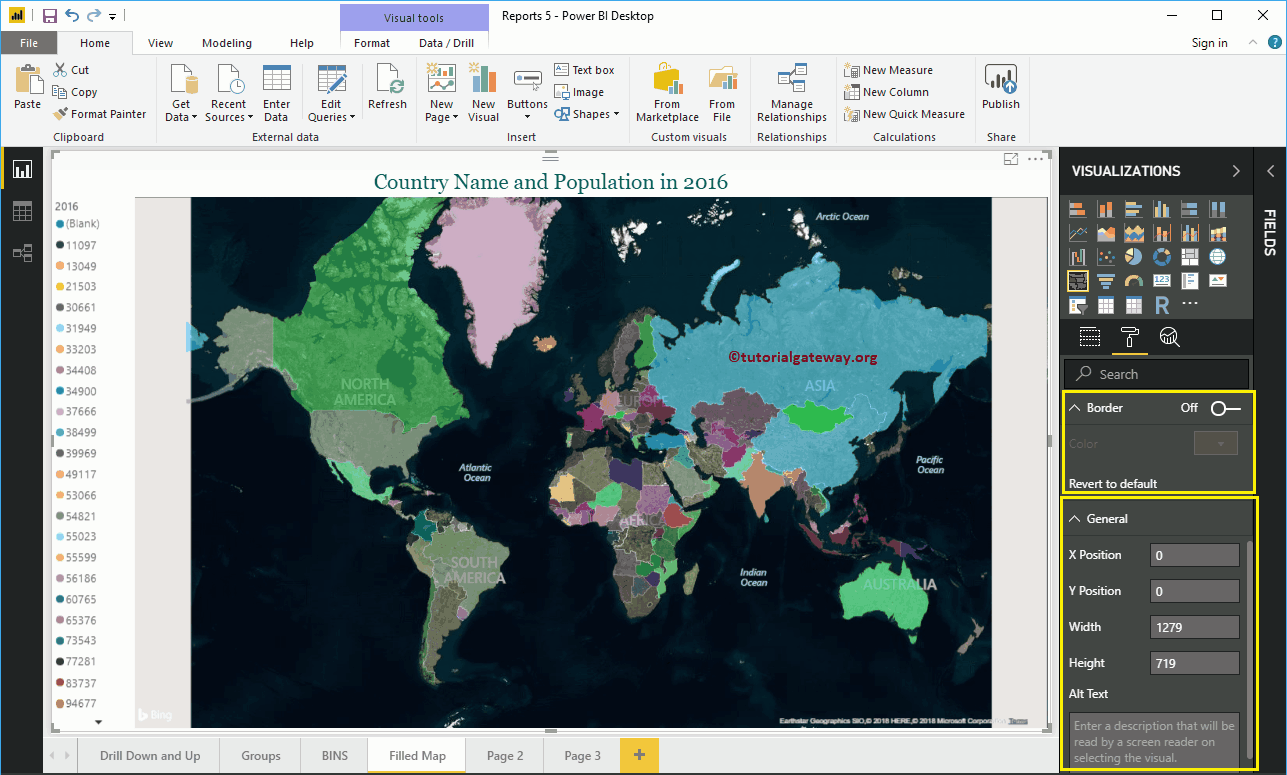
How to format the Power BI filled map with an example? Formatting the filled map in Power BI includes changing the color of the map, the title text ...
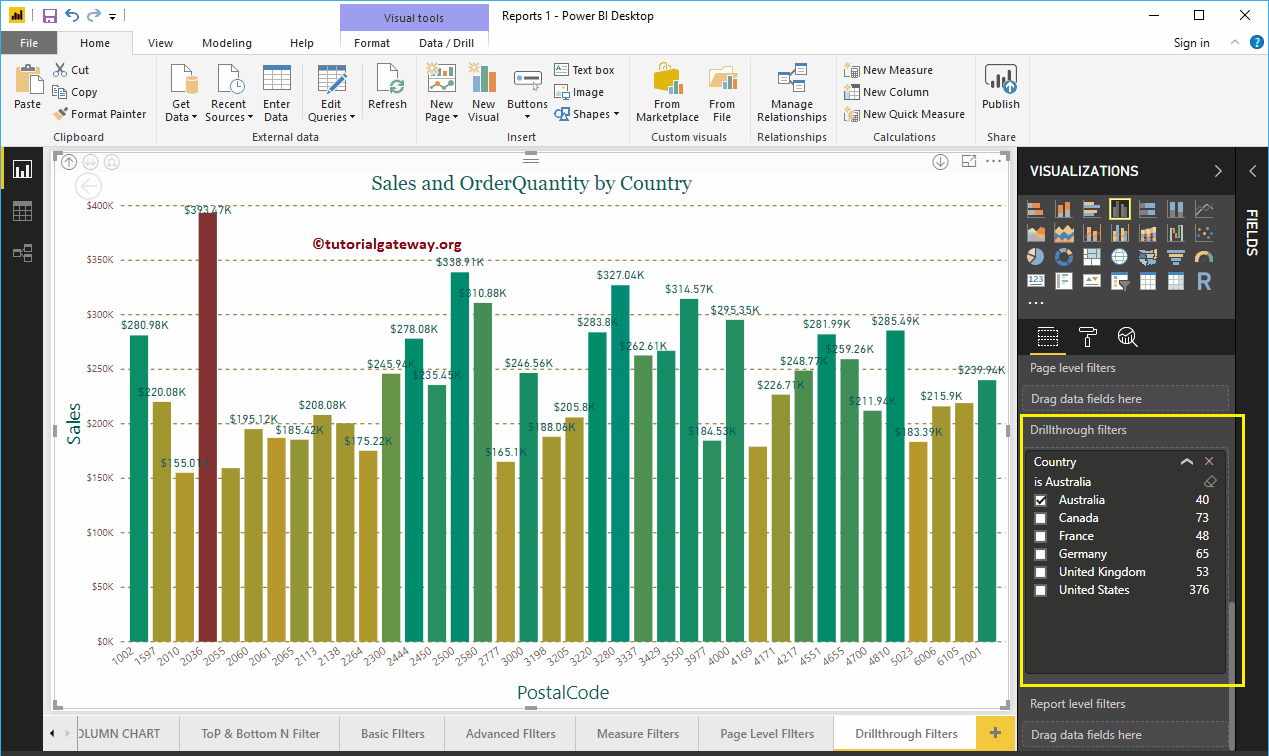
Exploring Power BI Filters are useful for exploring a particular field, or we can say, applying filters on reports at various levels. Let me show you how to create Drill through ...
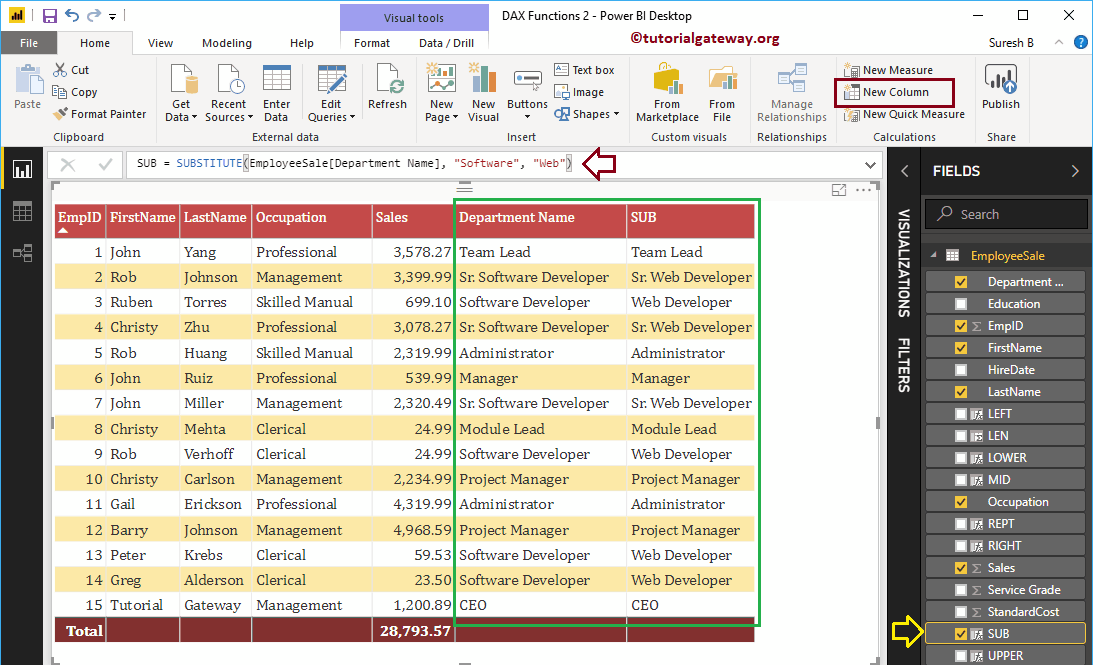
Let me show you how to use Power BI DAX string functions with examples. Microsoft Power BI DAX provides various string functions such as LEN, LEFT, RIGHT, LOWER, UPPER, MID, ...
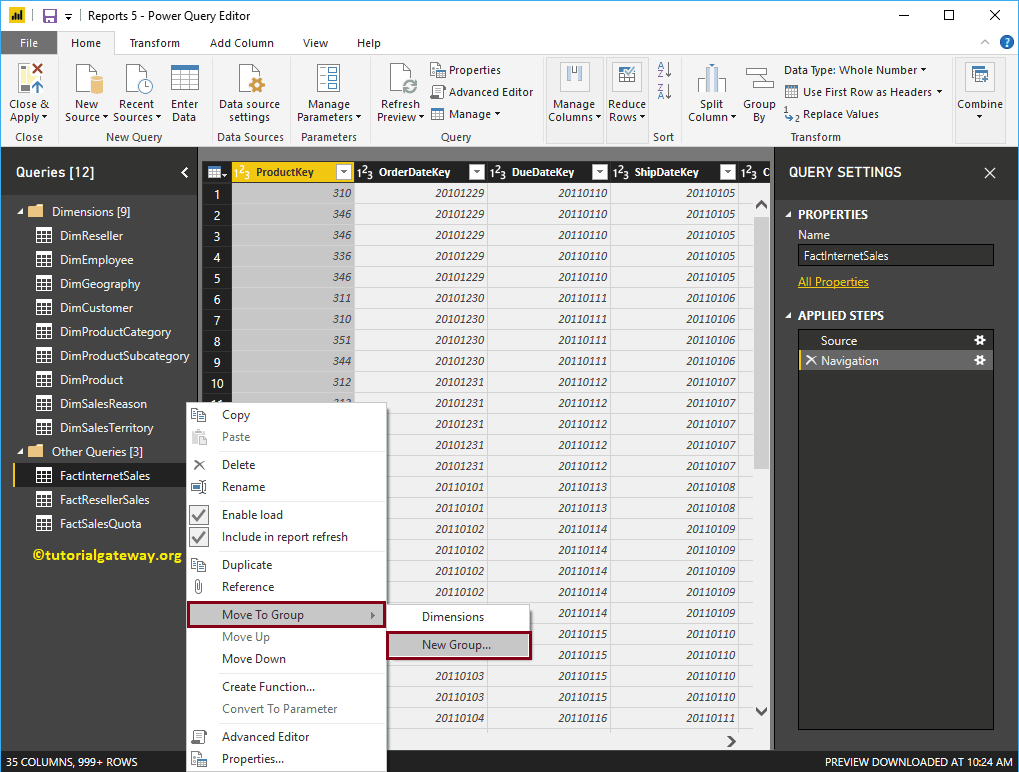
This article shows the steps to create query groups in Power BI with an example. In general, the tables we load from source are arranged alphabetically. Without…
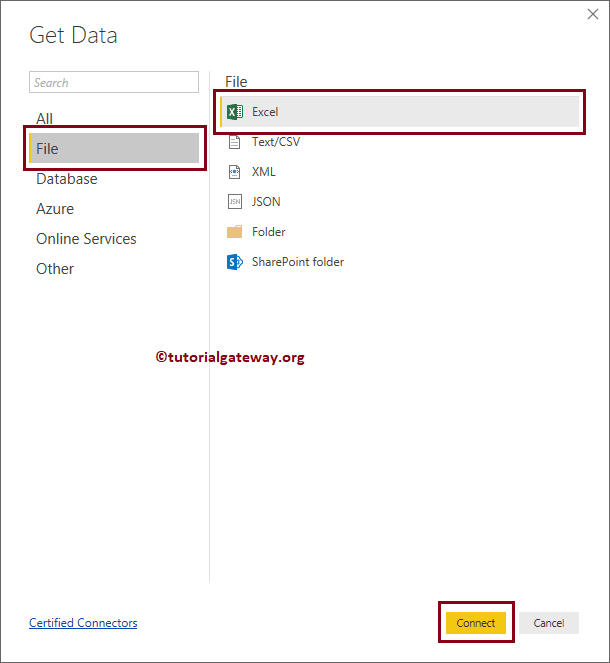
In this section, we show you how to connect Power BI to Excel files and how to get data from Excel to Power BI. To demonstrate how to Get data from Excel to ...
Exploring Power BI Filters are useful for exploring a particular field, or we can say, applying filters on reports at various levels. Let me show you how to create Drill through ...
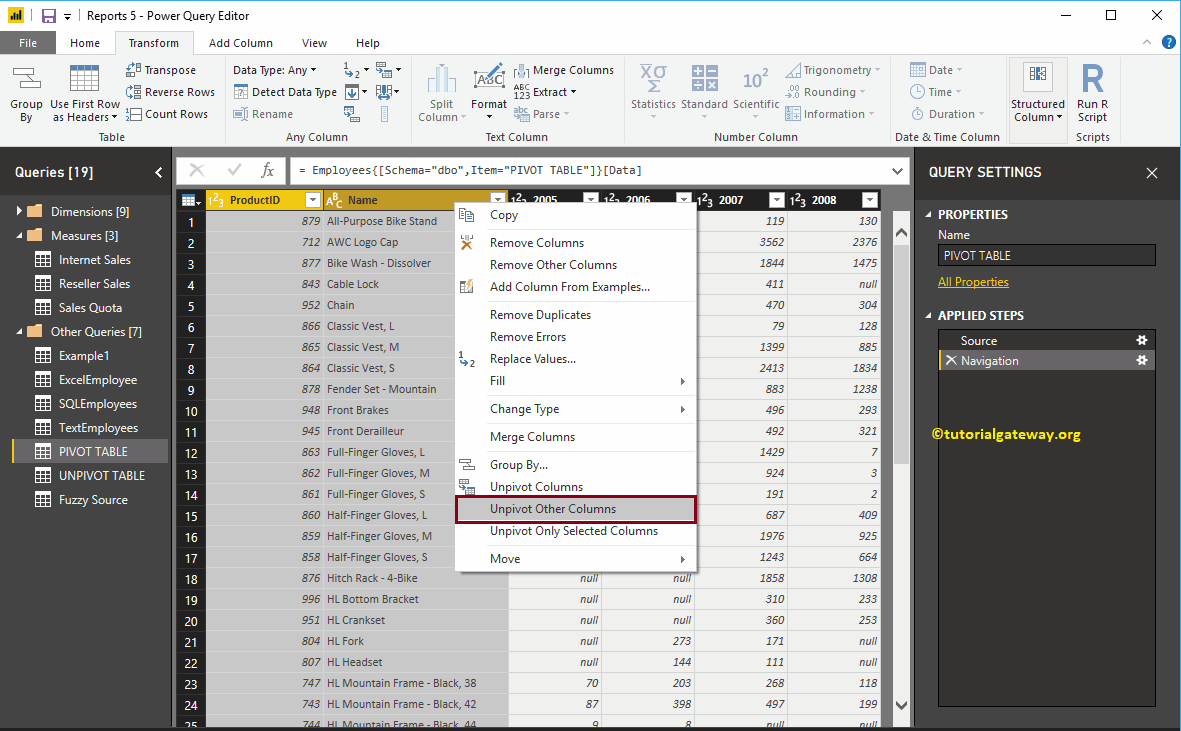
The Unpivot table option in Power BI converts selected columns to rows. Let's see how to create Unpivot table or how to convert pivot table to Unpivot table ...
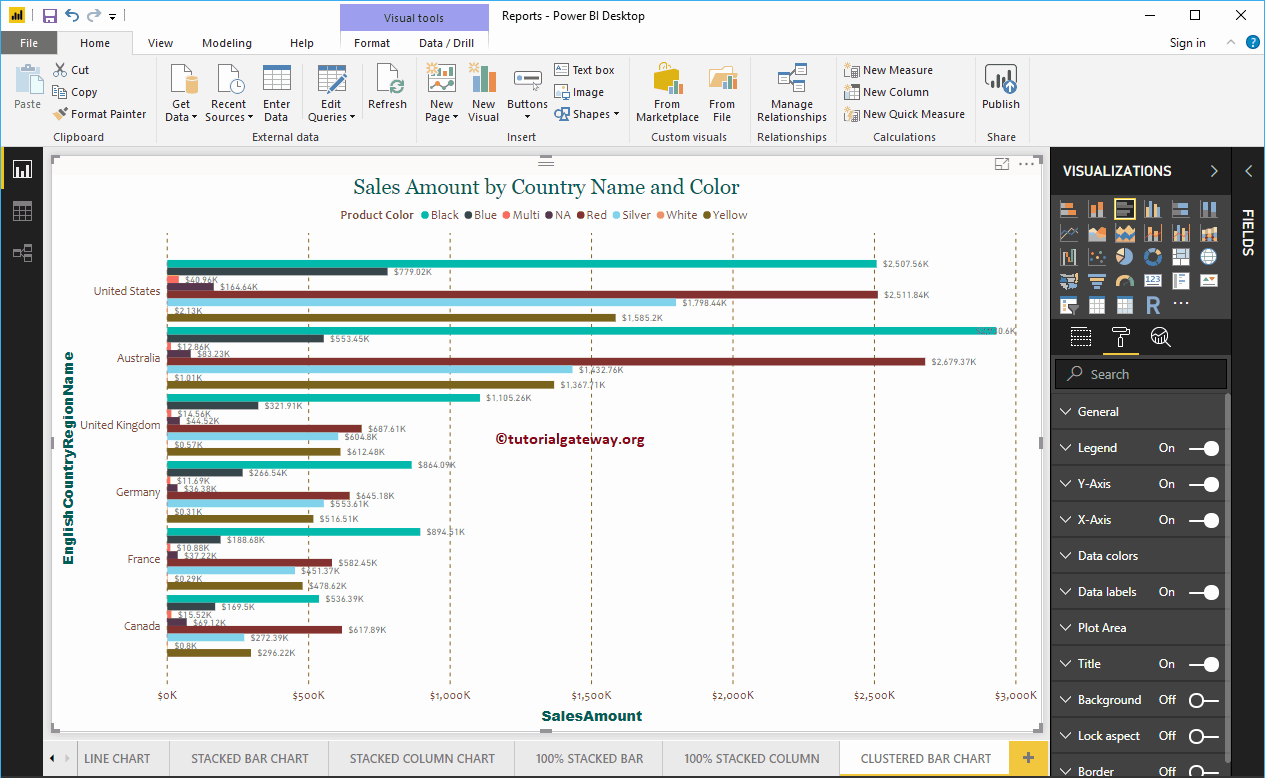
The Power BI clustered bar chart is used to display horizontal bars from multiple regions of data (measures) in a single metric. Let me show you how to create a ...
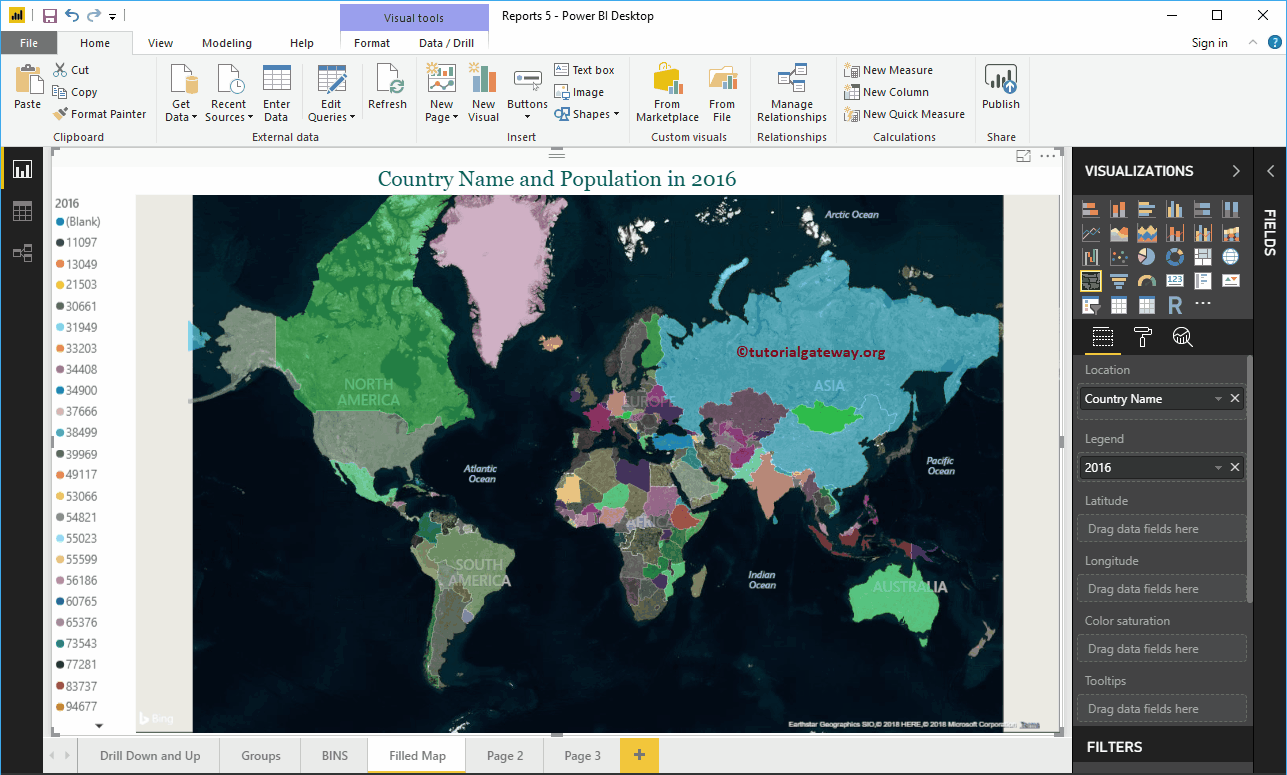
Power BI filled maps fill the map with colors based on the geological data you provide. Let me show you how to create a filled map in Power BI with an example.…