How to create a report using Excel data in Power BI Workspace with a practical example? It is the Excel workbook that we imported in our previous article. Before starting…
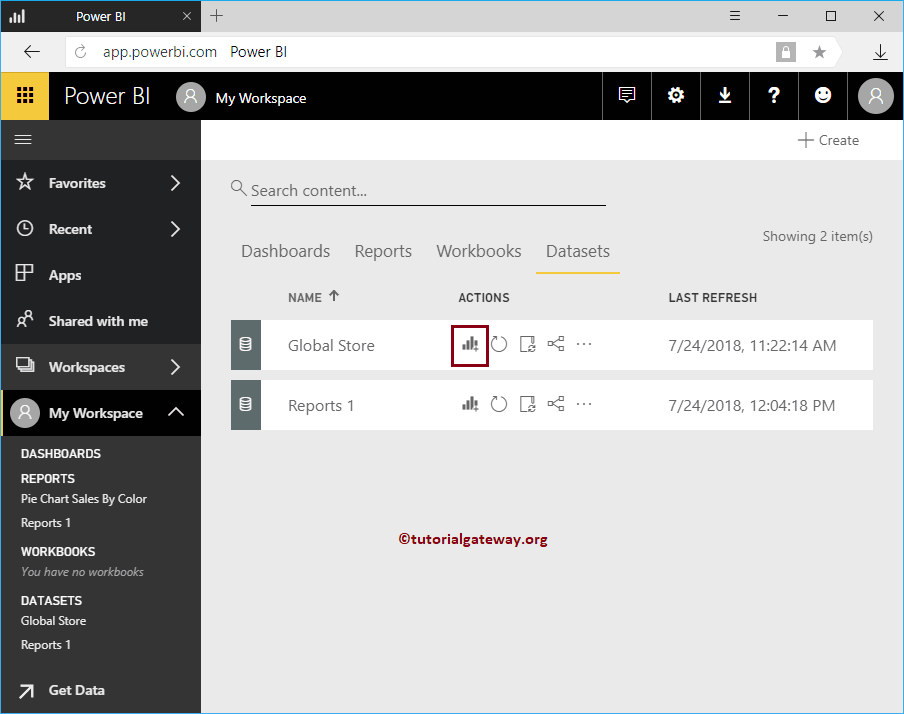
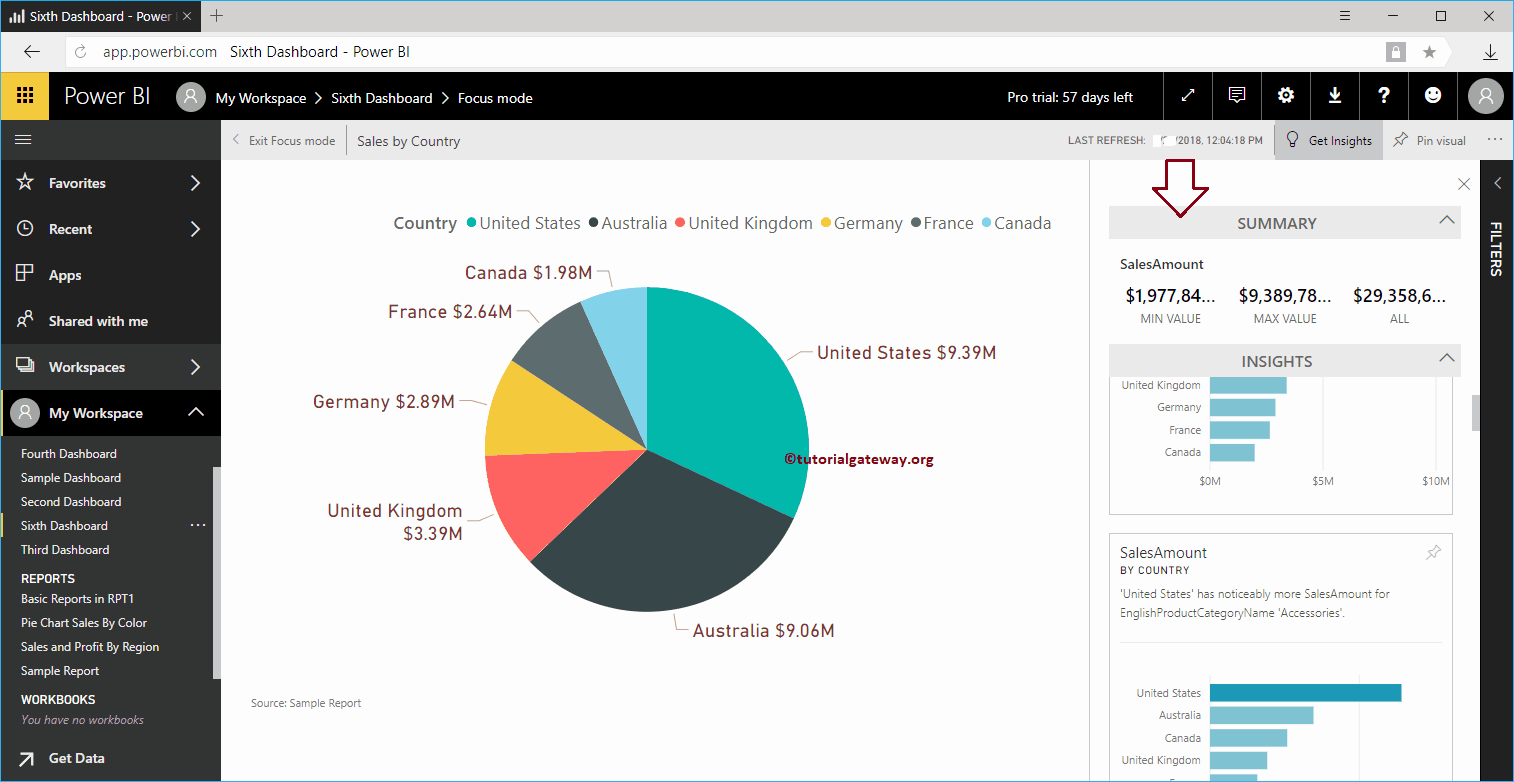
In this session, we show you how to get quick insights into Power BI with a practical example. Generally, there are two types of information in Power BI. One that runs on ...
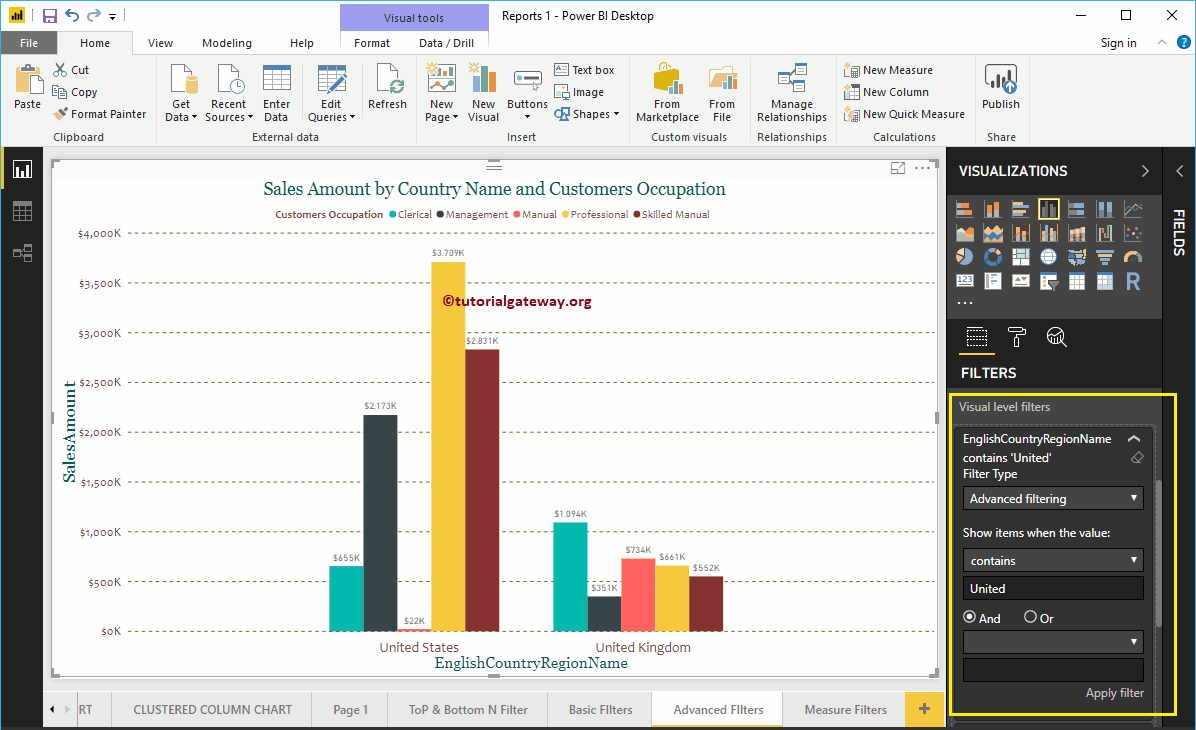
How to create advanced Power BI filters with an example ?. Power BI advanced filters use wildcards to narrow the report data based on requirements. For example,…
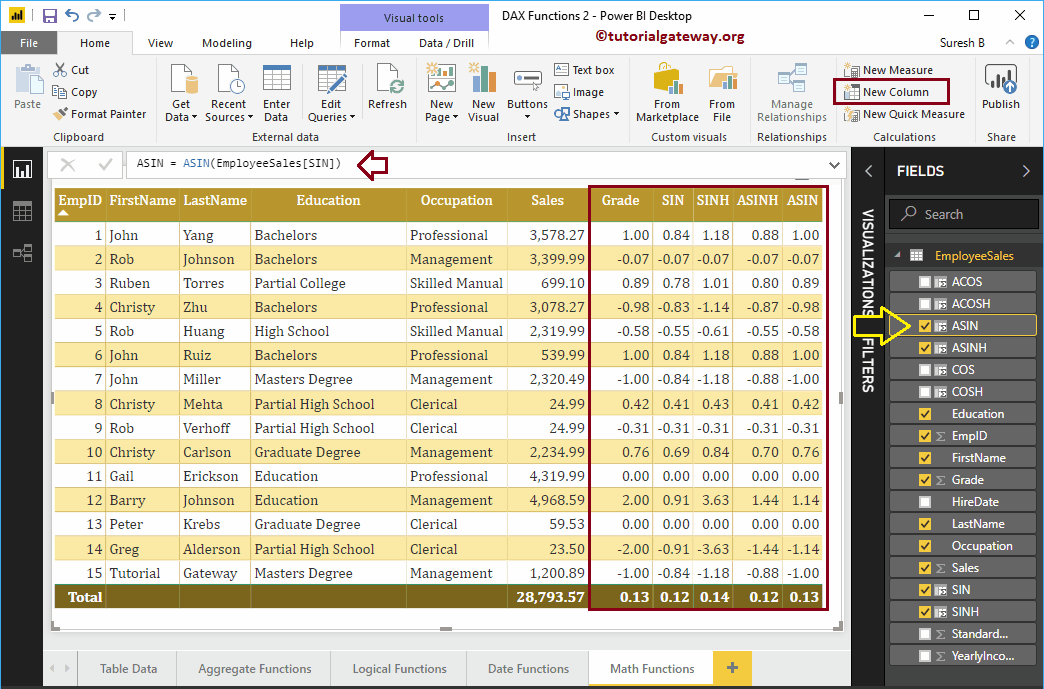
How to use Power BI DAX trigonometric functions with examples? Microsoft Power BI DAX provides several trigonometric functions such as EXP, COS, SIN, TAN, COSH, ACOS, ACOSH, ASIN, SINH, ASINH, ...
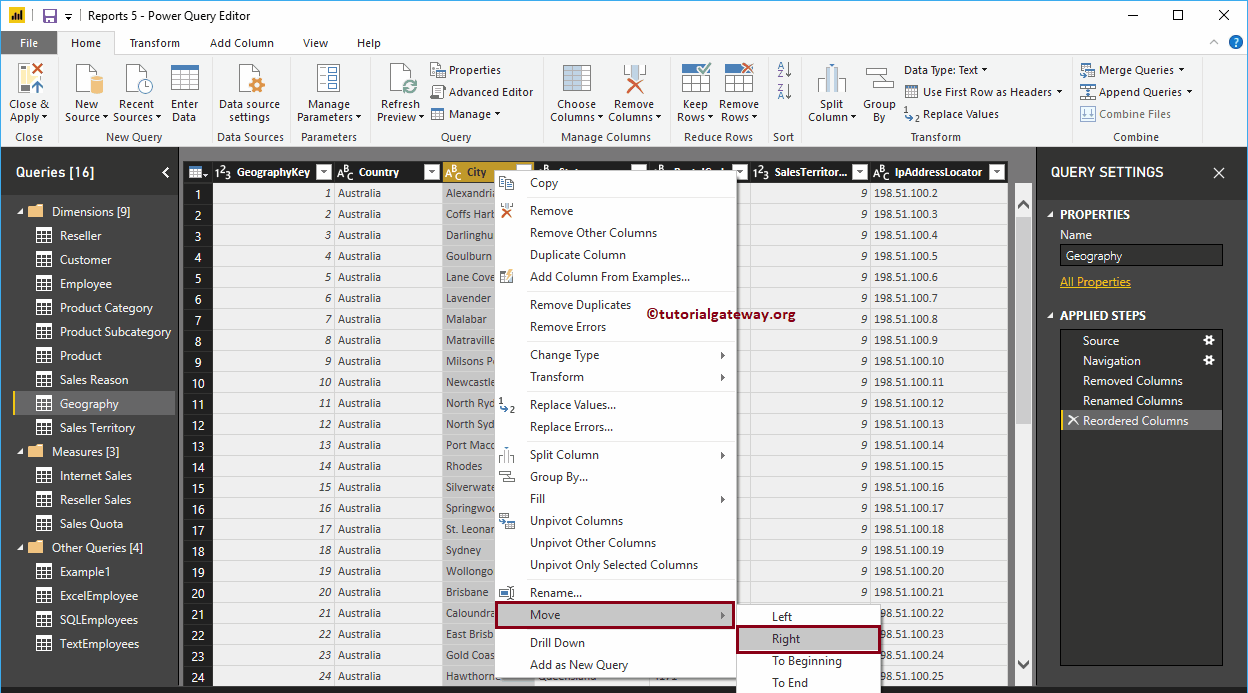
Generally, the data we get from the source may have few columns that may not be necessary for the purpose of the analysis. Let me show you the steps to remove or ...
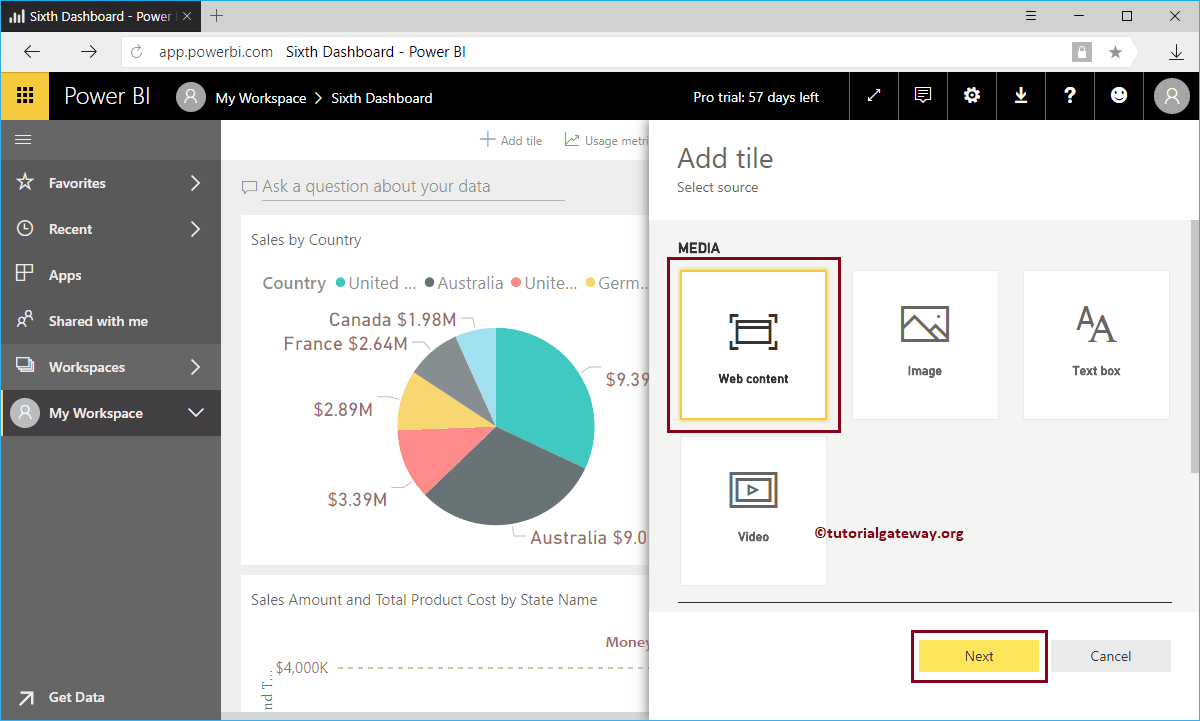
Let me show you how to add web content to Power BI dashboard with a practical example. For this demo of Adding Web Content to the Power BI Dashboard, we're going to insert ...
This article is an introduction to the Power BI dashboard. When you open or sign in to a Power BI service, you can see the default Power BI dashboard. Yes it is…