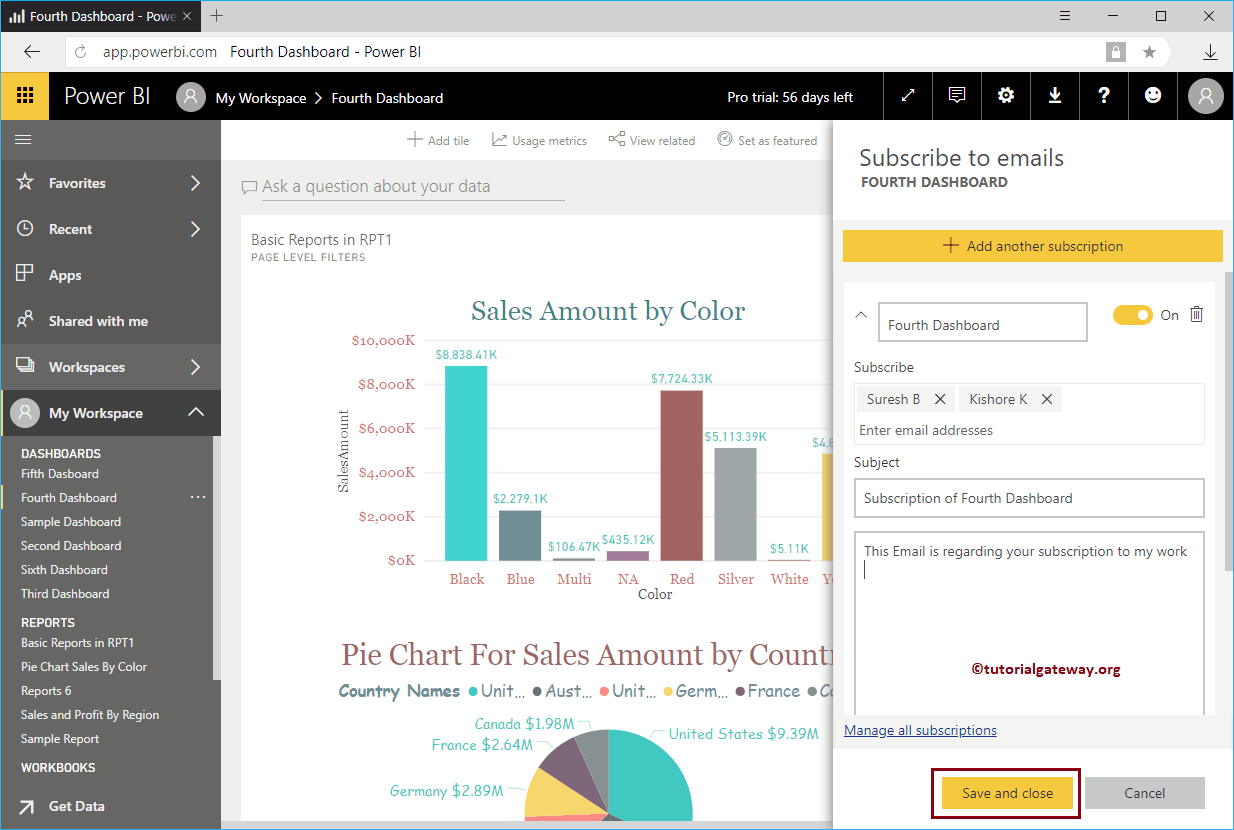
In this section, we show you the step-by-step approach of the Subscribe Power BI dashboard with a practical example. Before starting the subscription process for a panel of ...
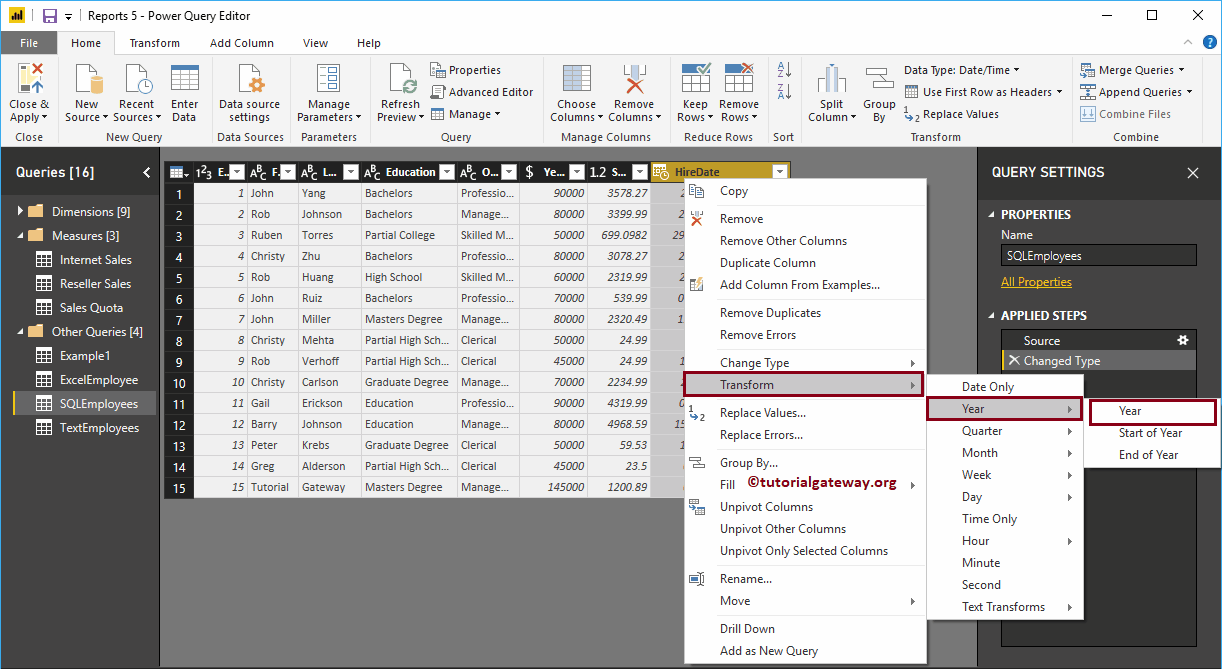
How to format dates in Power BI with an example? With these format date options, you can extract Year, Month, Day, Day number, Day name, Start and end ...
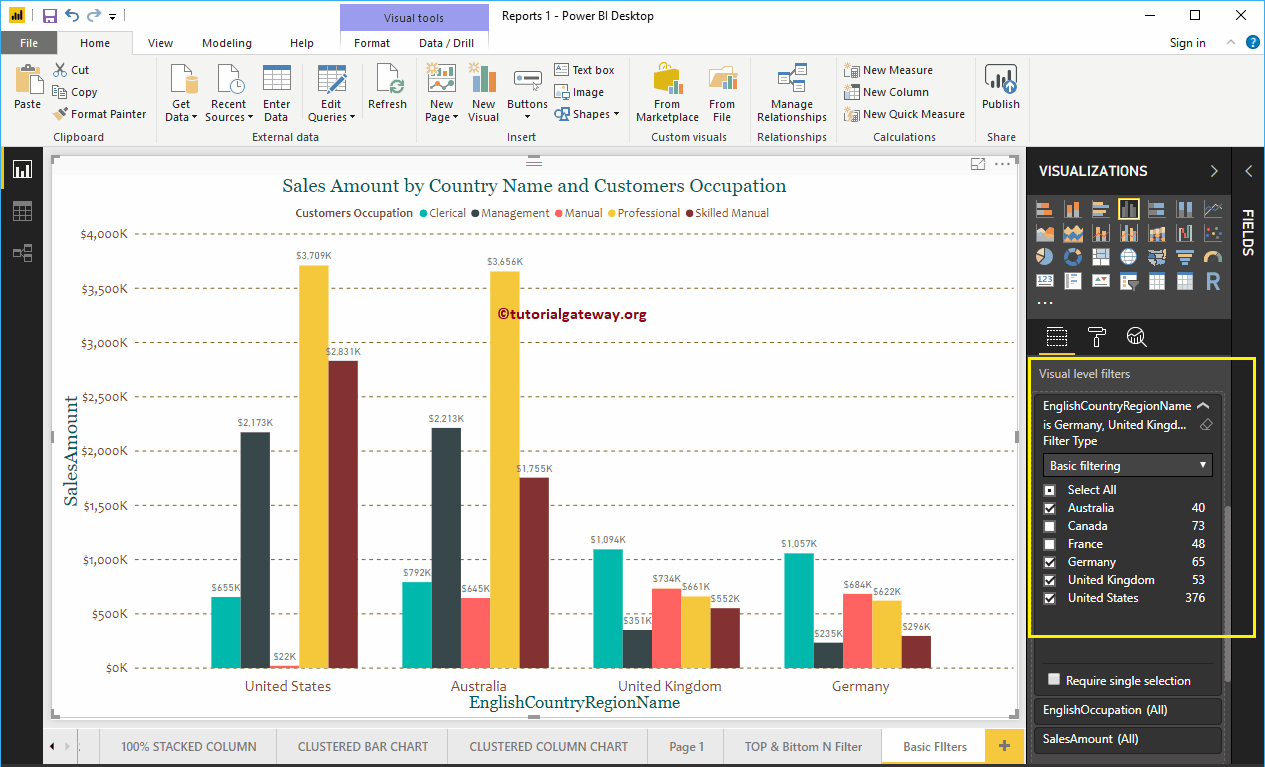
Power BI filters are useful for narrowing down your data based on requirements. For example, when using basic Power BI filters, we can exclude a product from the screen ...
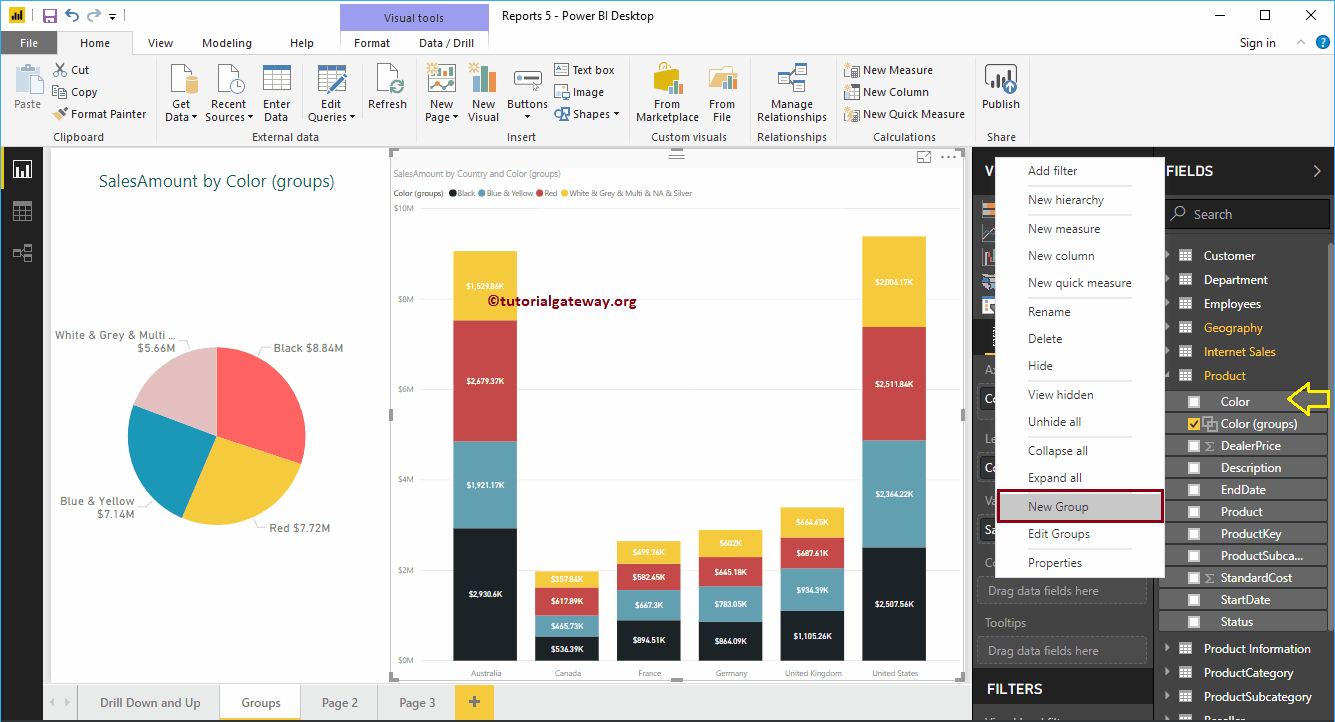
Power BI grouping is the process of combining or merging two or more values for more detailed analysis. For example, when we see a report of products by ...
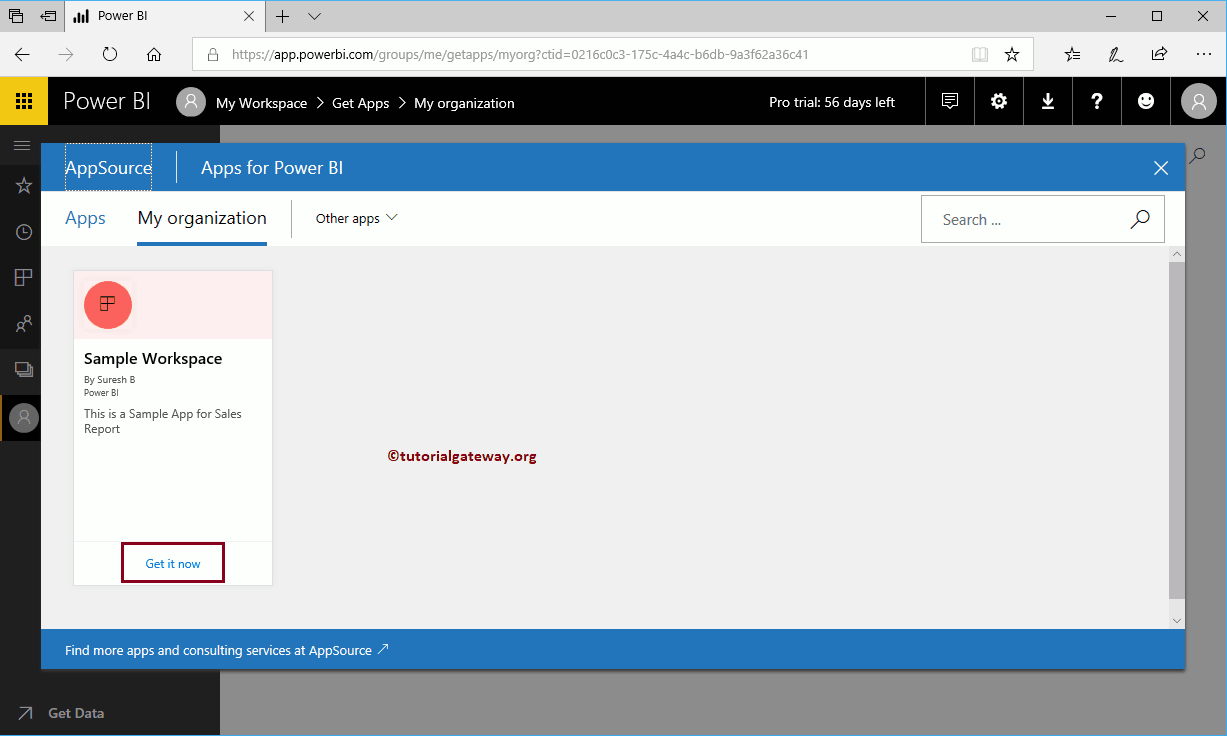
Let me show you the step-by-step approach to view the published application in Power BI with a practical example. If you are the administrator / owner of this application, you can ...
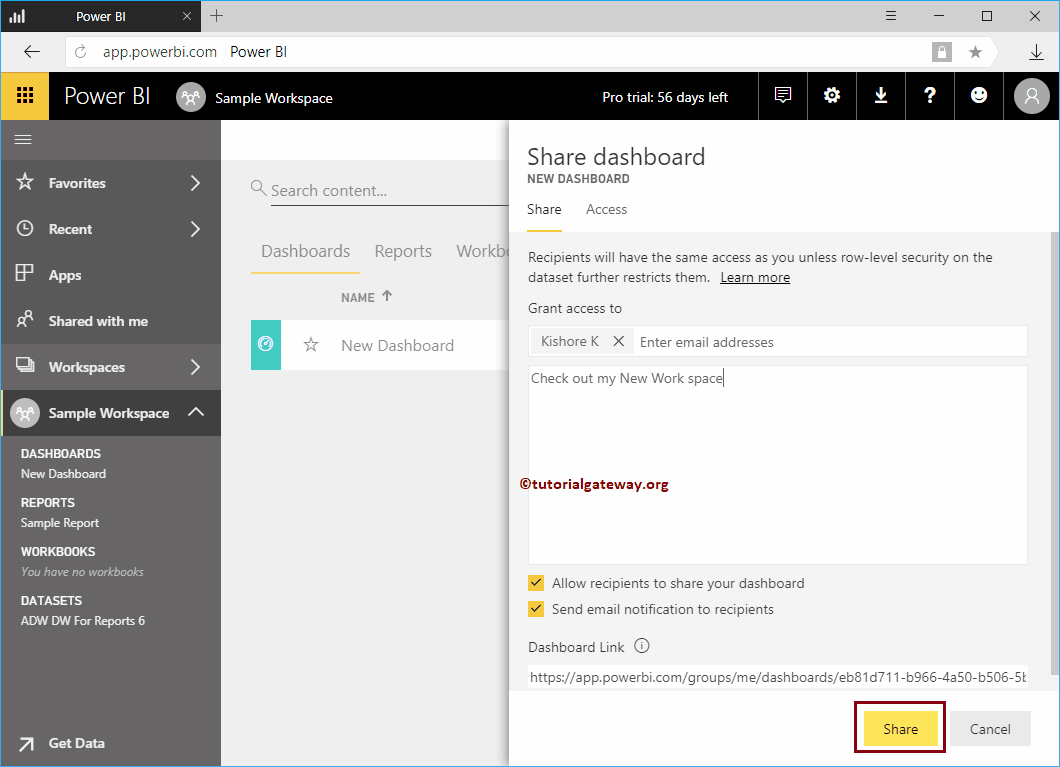
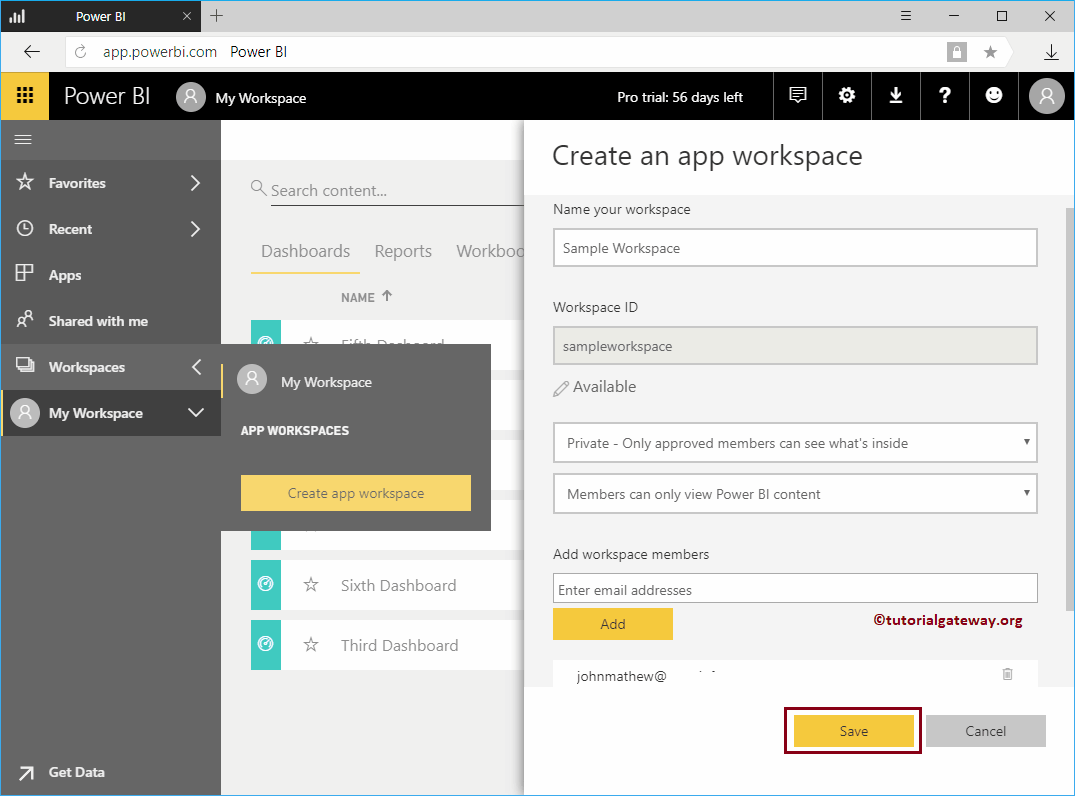
Let's take a step-by-step approach to sharing the Power BI workspace across your organization with a practical example. Before starting to share the area ...
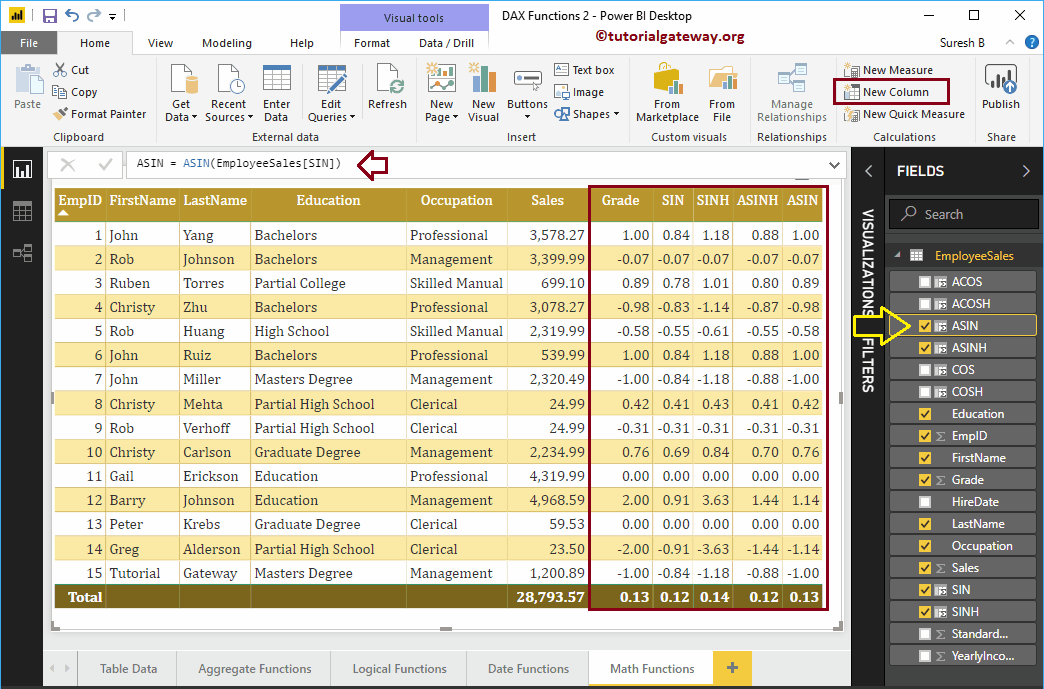
How to use Power BI DAX trigonometric functions with examples? Microsoft Power BI DAX provides several trigonometric functions such as EXP, COS, SIN, TAN, COSH, ACOS, ACOSH, ASIN, SINH, ASINH, ...