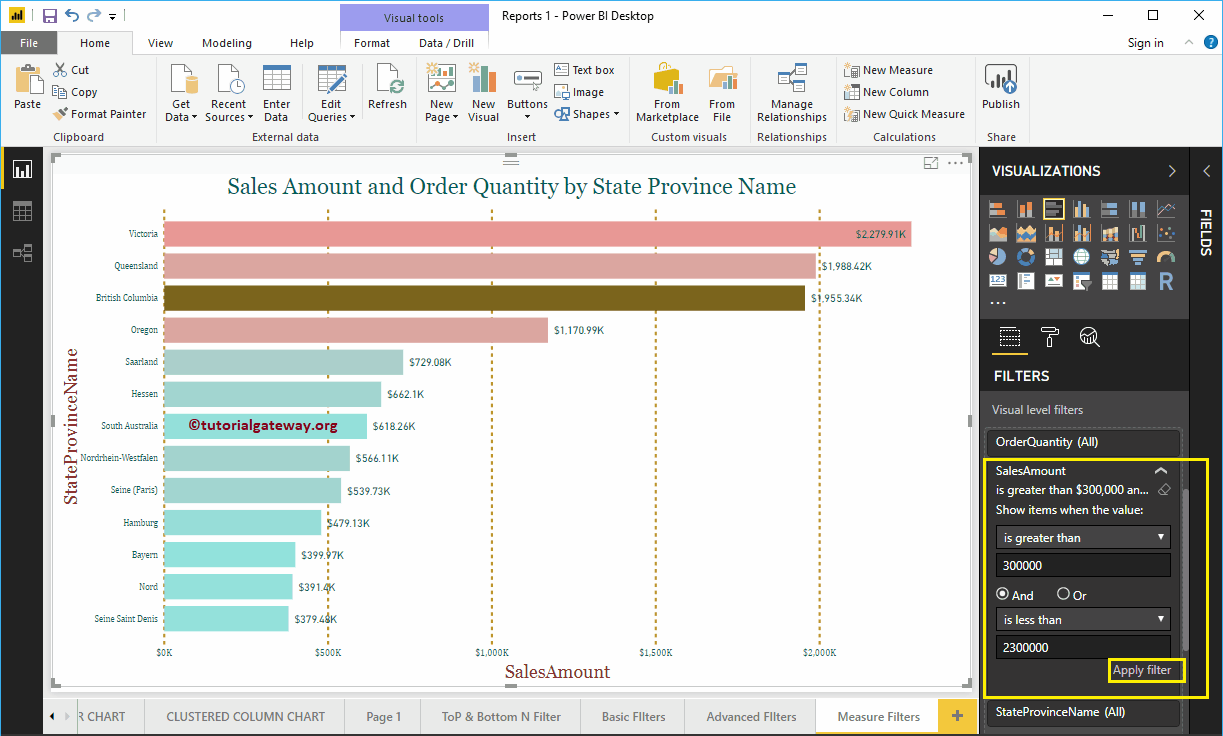
How to create Power BI filters on measures with an example? You use Power BI measure filters to filter measures (metric values). For example, we can ...
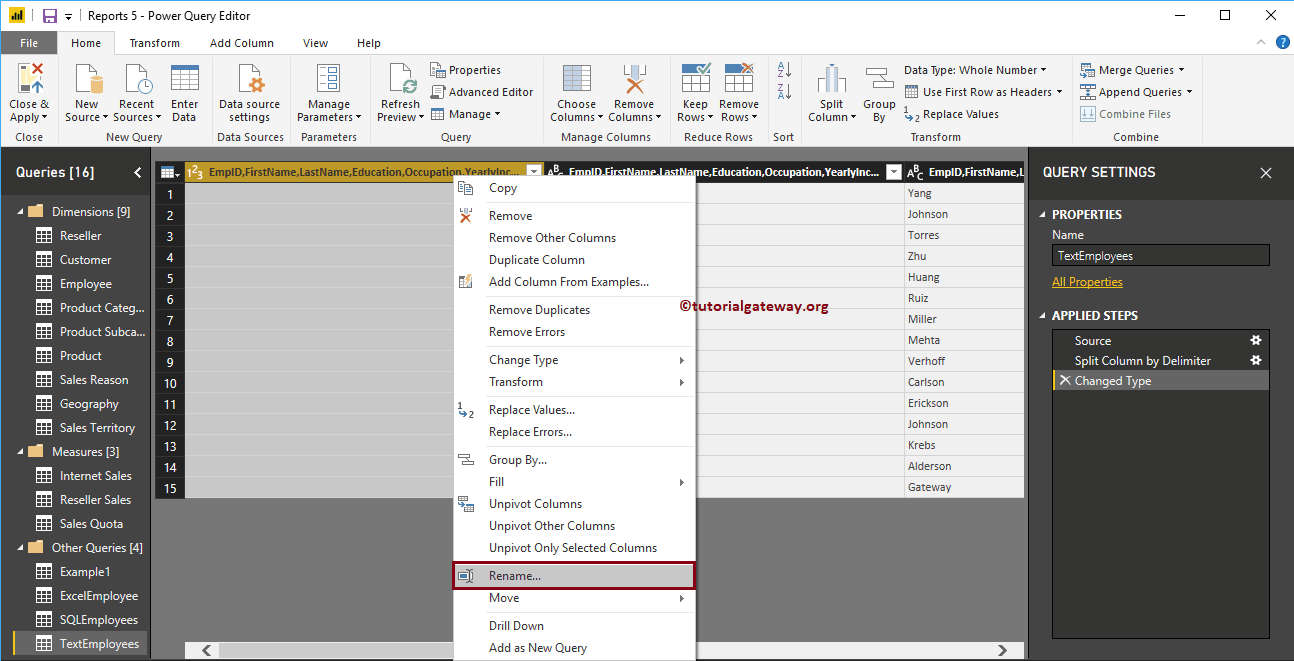
Let's see how to rename columns in Power BI Desktop with an example. Generally, when you load the data from a data source, you get the column names ...
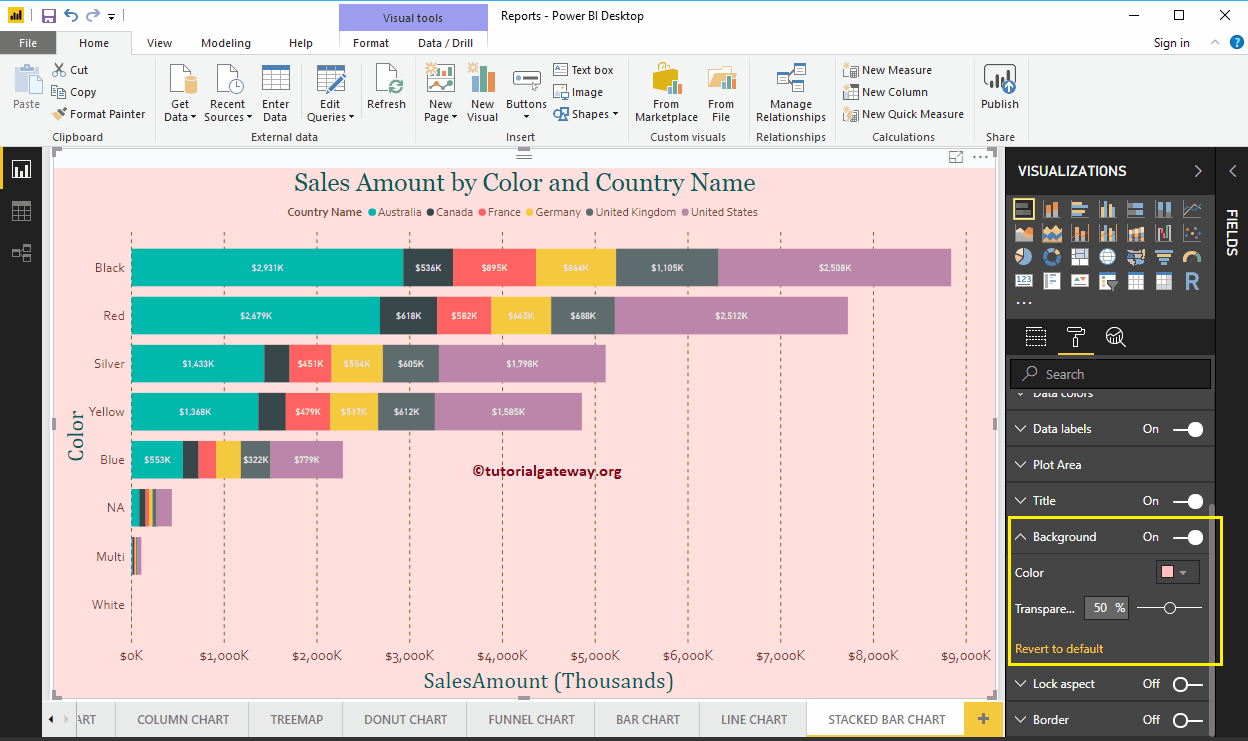
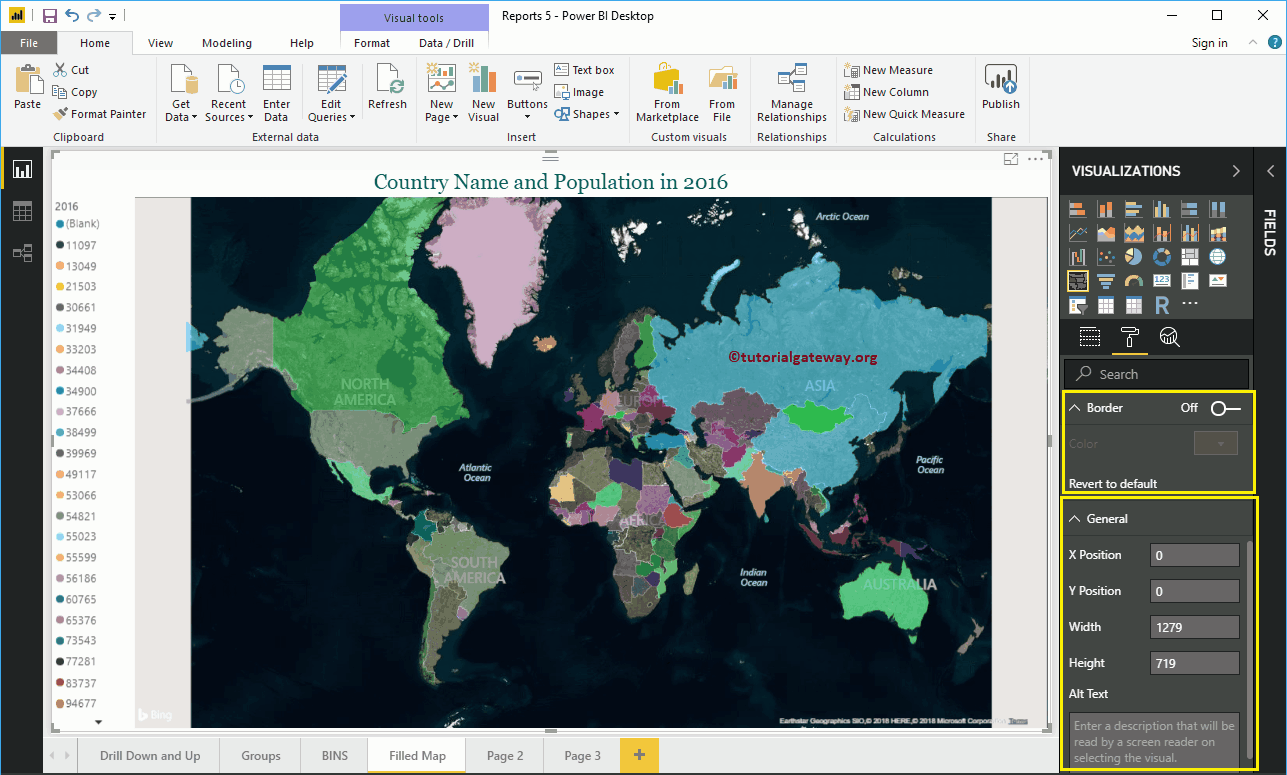
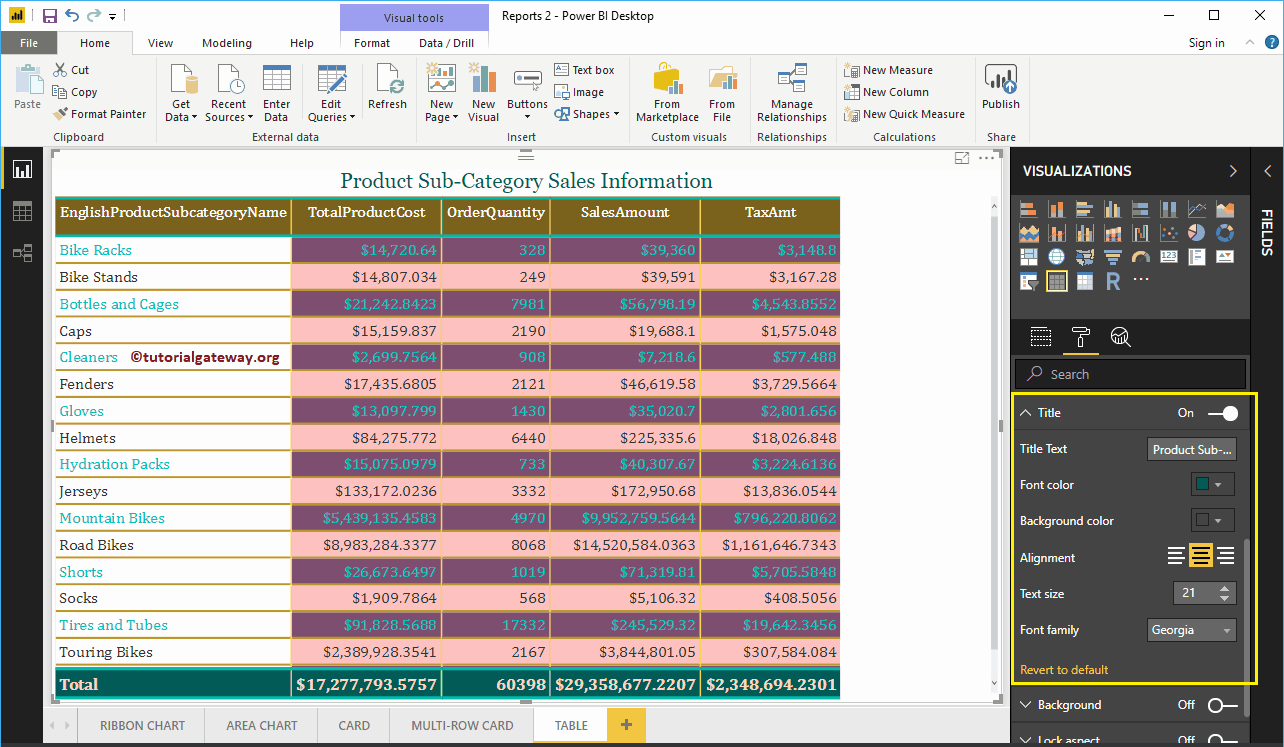
How to format the Power BI filled map with an example? Formatting the filled map in Power BI includes changing the color of the map, the title text ...
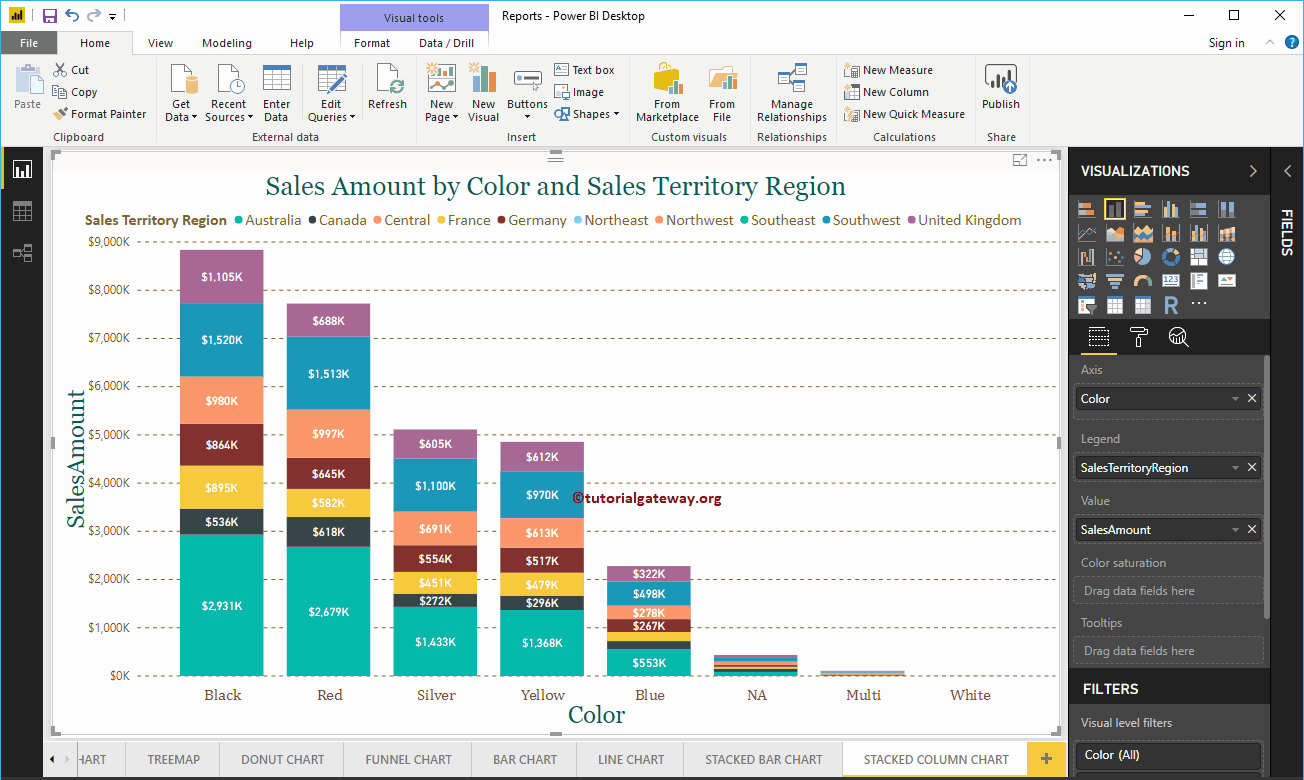
The stacked column chart in Power BI is useful for visualizing multiple dimensions in a single measure. Let me show you how to create a stacked column chart in Power BI ...
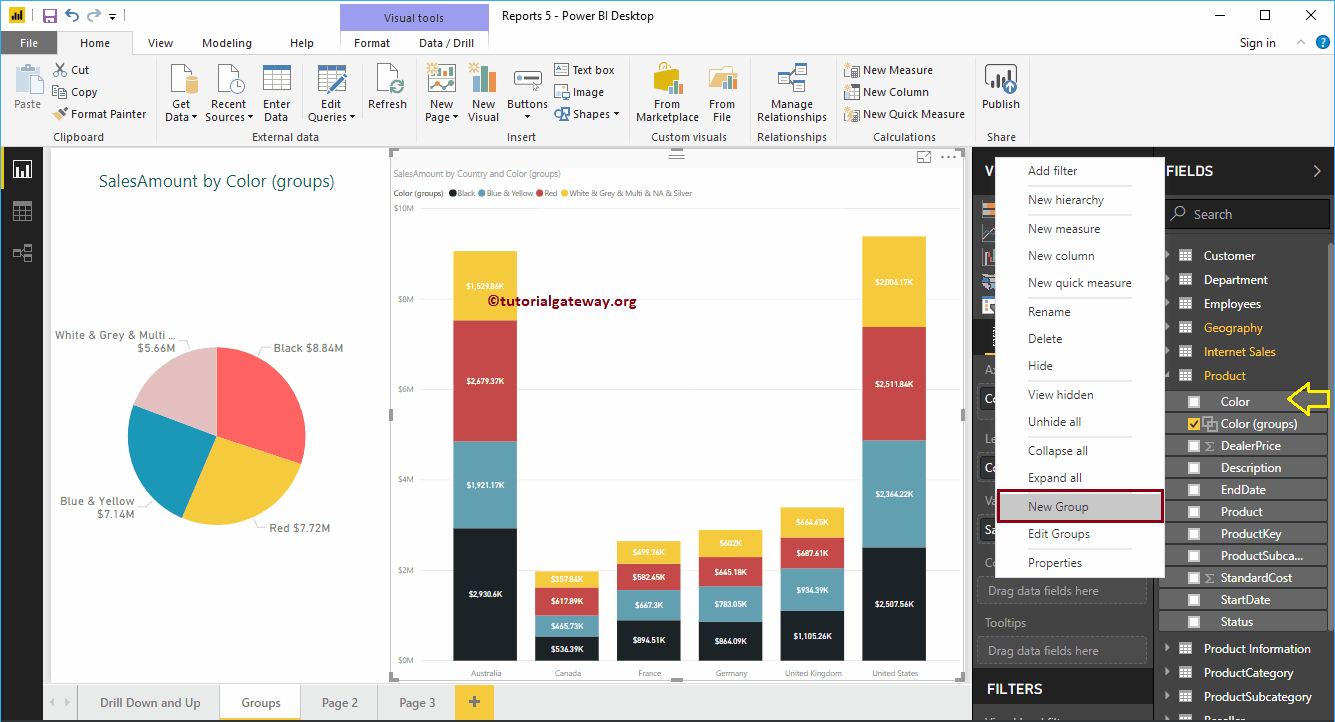
Power BI grouping is the process of combining or merging two or more values for more detailed analysis. For example, when we see a report of products by ...
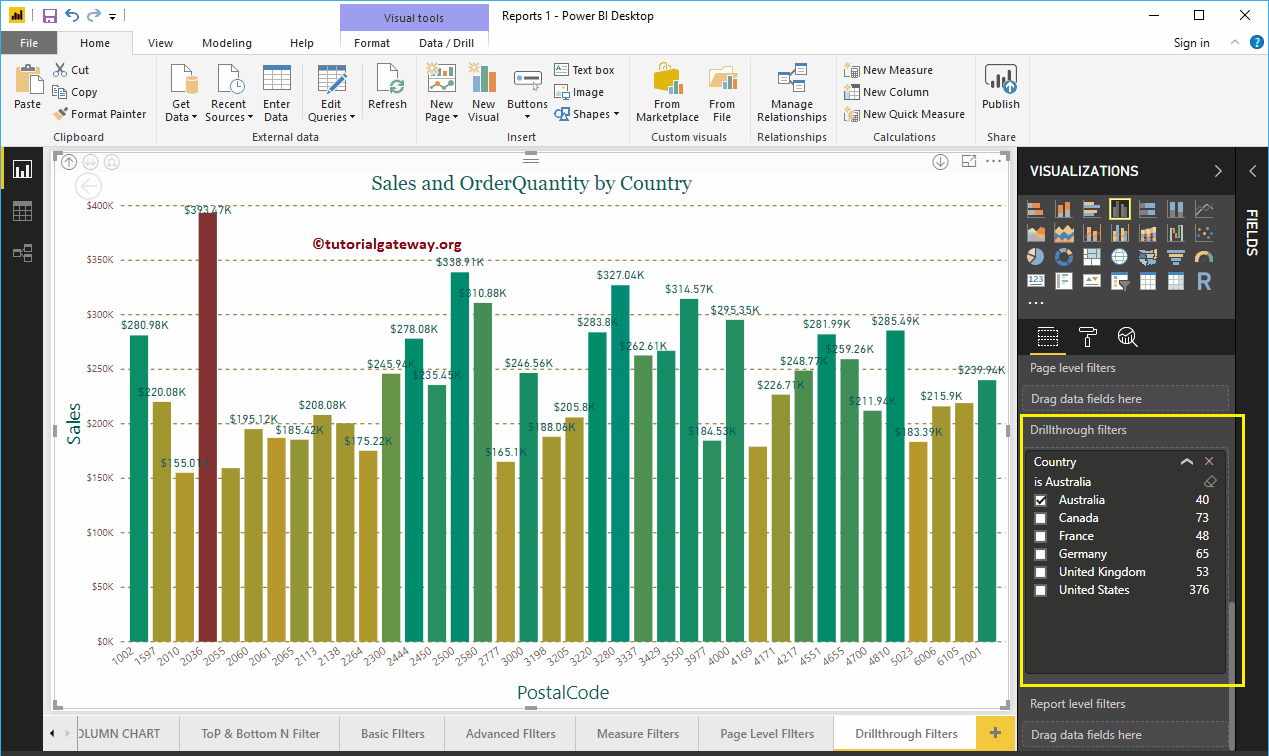
Exploring Power BI Filters are useful for exploring a particular field, or we can say, applying filters on reports at various levels. Let me show you how to create Drill through ...
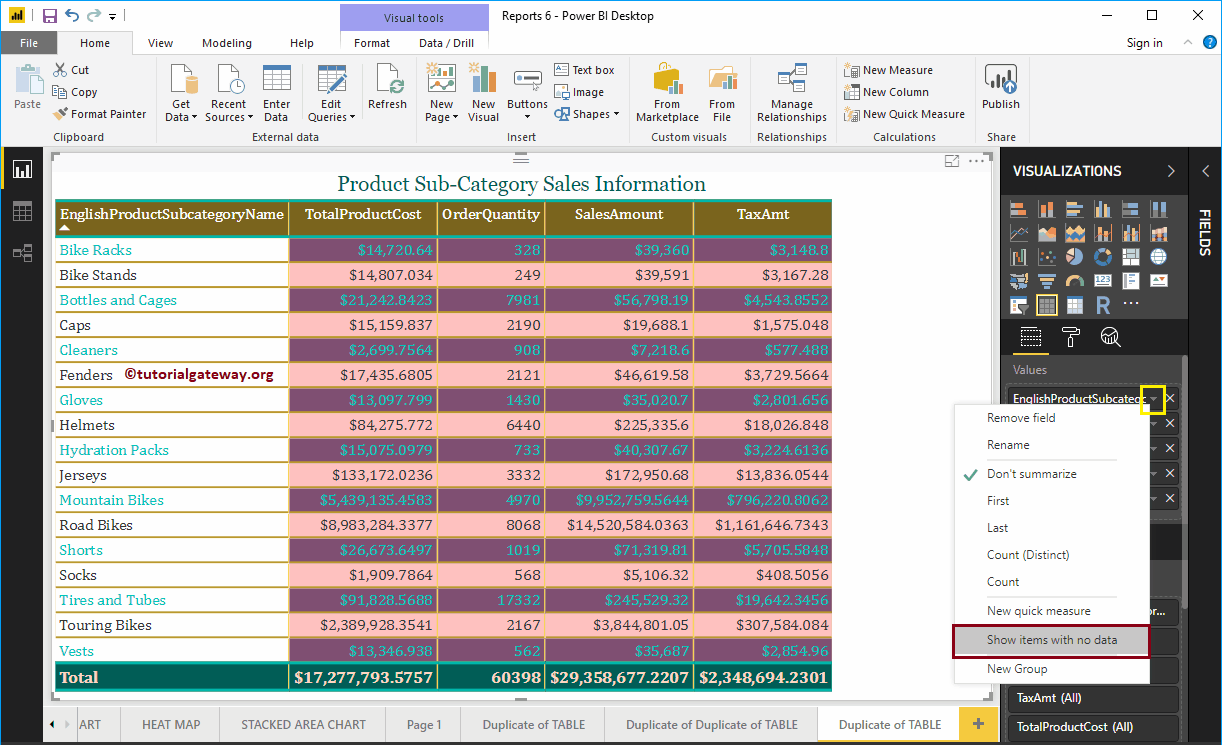
In this section, we show you how to display empty records in a Power BI report with an example. While creating a Power BI report, Power Bi automatically hides the…
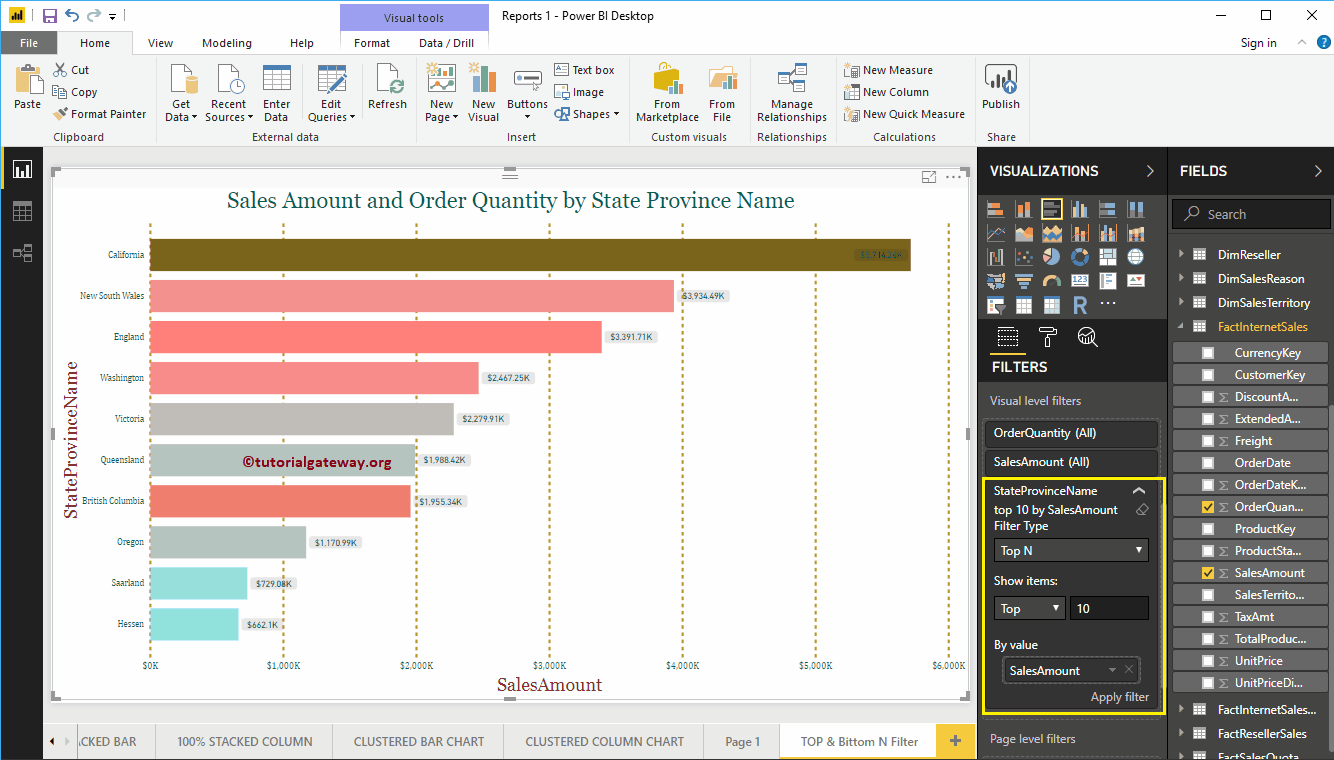
Power BI's Top N filters are useful for displaying the best performing records, and the Bottom N filters are useful for displaying the lowest… records.