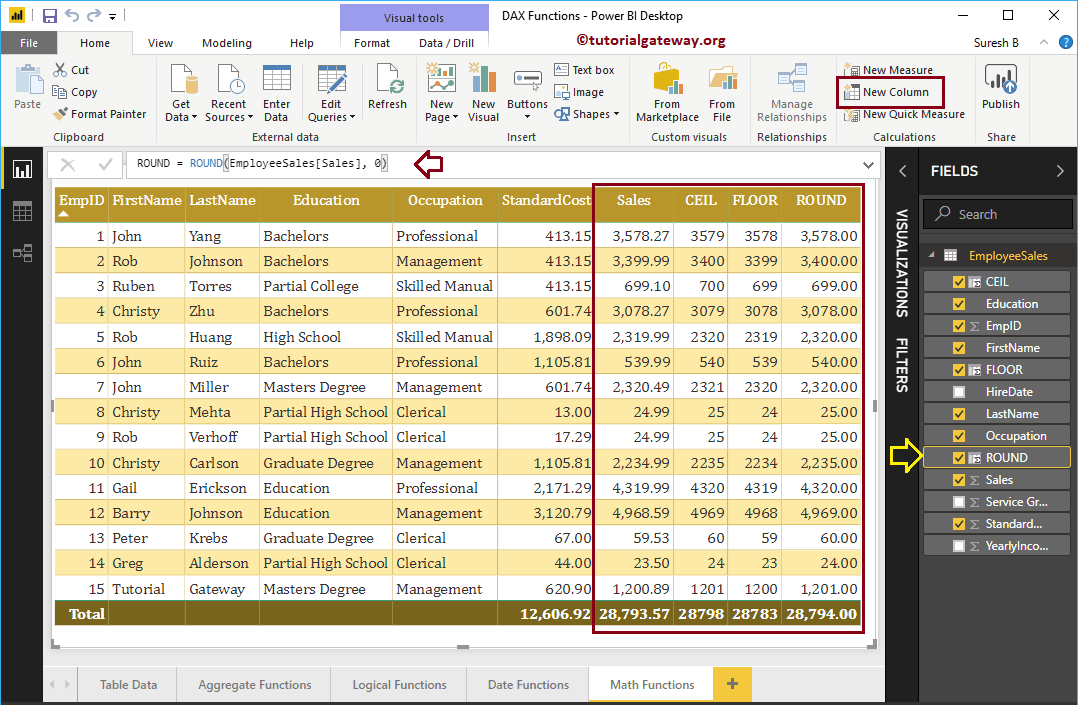
How to use Power BI DAX math functions with examples? Microsoft Power BI DAX provides various mathematical or mathematical functions such as ROOF, FLOOR, CURRENCY, INT, SQRT, POWER, MOD, DIVIDE, ...
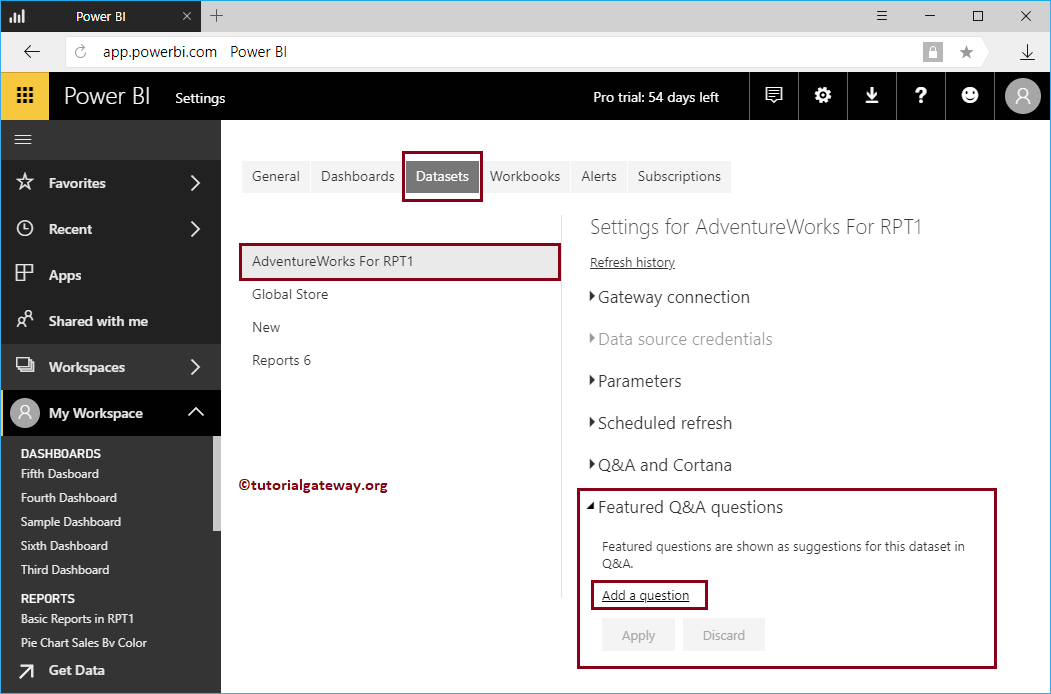
By default, Power BI Q&A suggests a few questions about your data. However, you can customize them according to your requirements. I mean, you can ask your own set of questions based on your ...
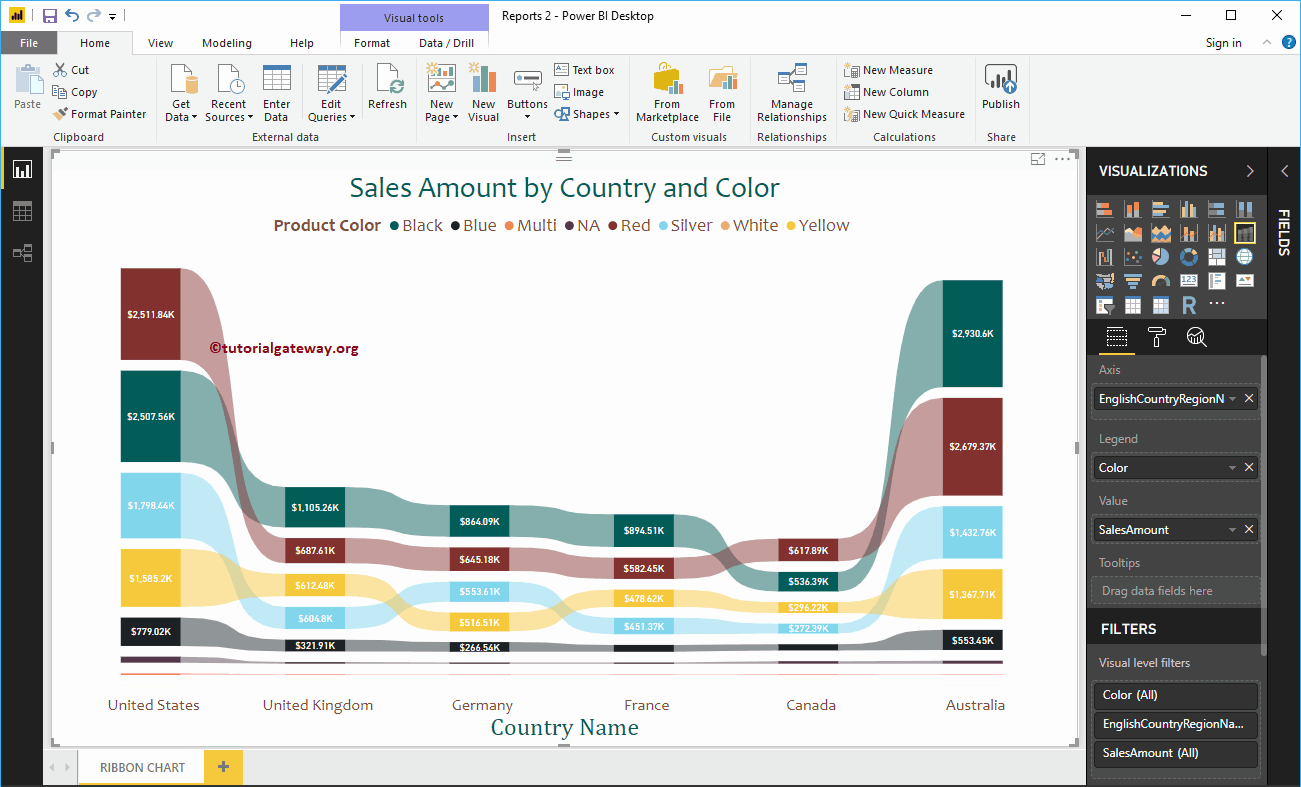
The Power BI ribbon chart is useful for quickly identifying which categorical data has the highest rank (large values). Let me show you how to create a tape chart ...
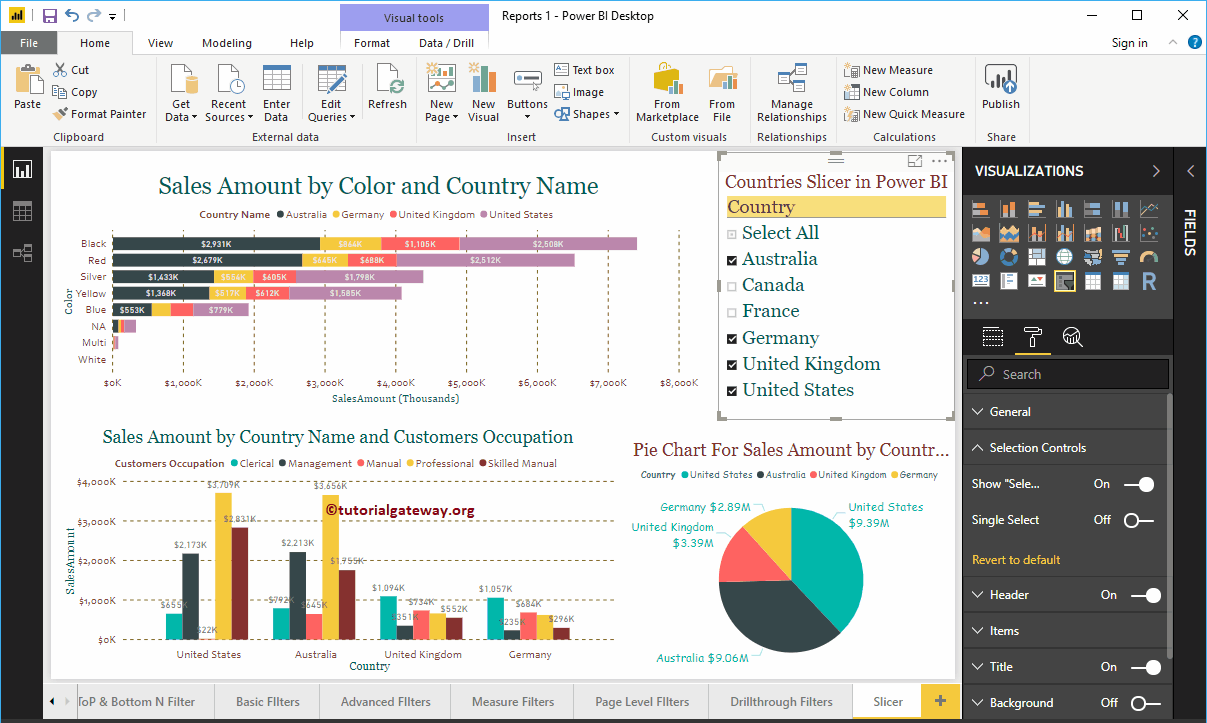
Power BI Slicer is commonly used to add filters to the canvas or to display filters on the report canvas. Let me show you how to create a Slicer in Power BI with ...
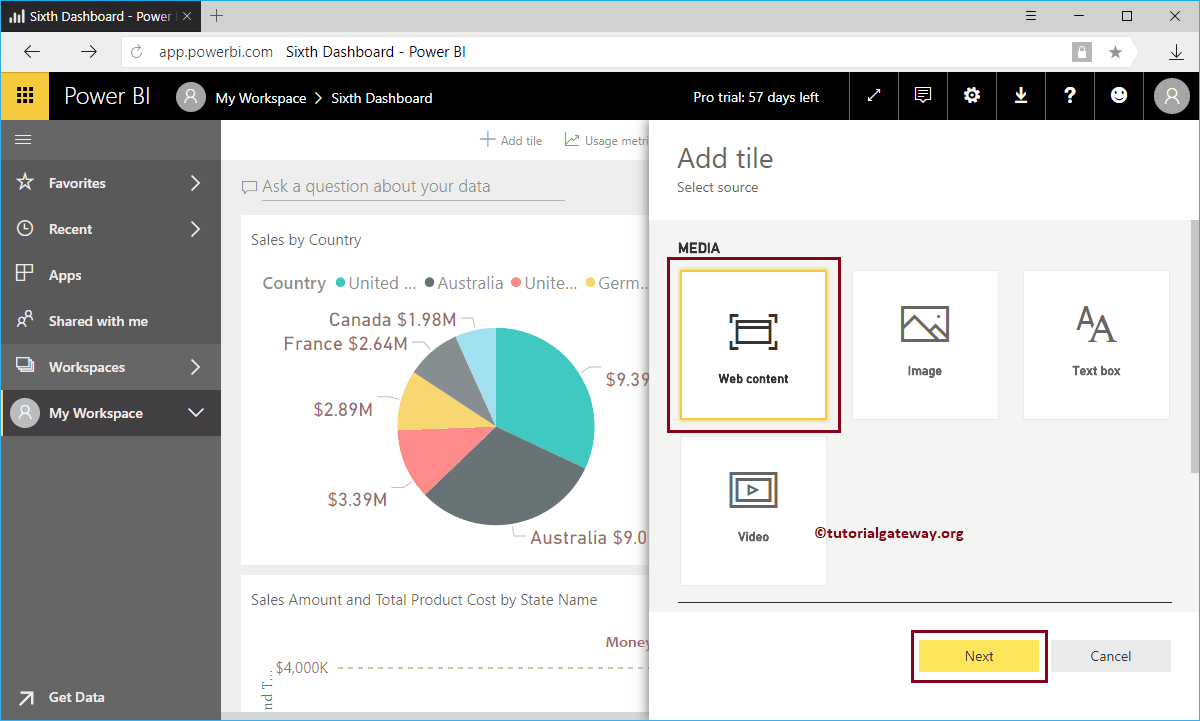
Let me show you how to add web content to Power BI dashboard with a practical example. For this demo of Adding Web Content to the Power BI Dashboard, we're going to insert ...
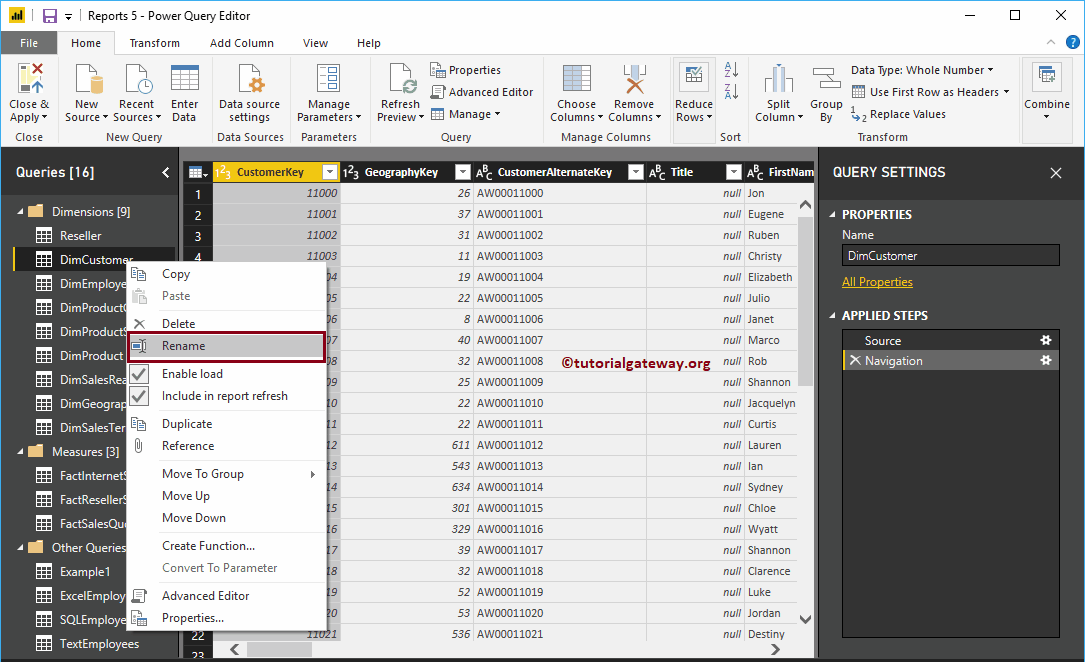
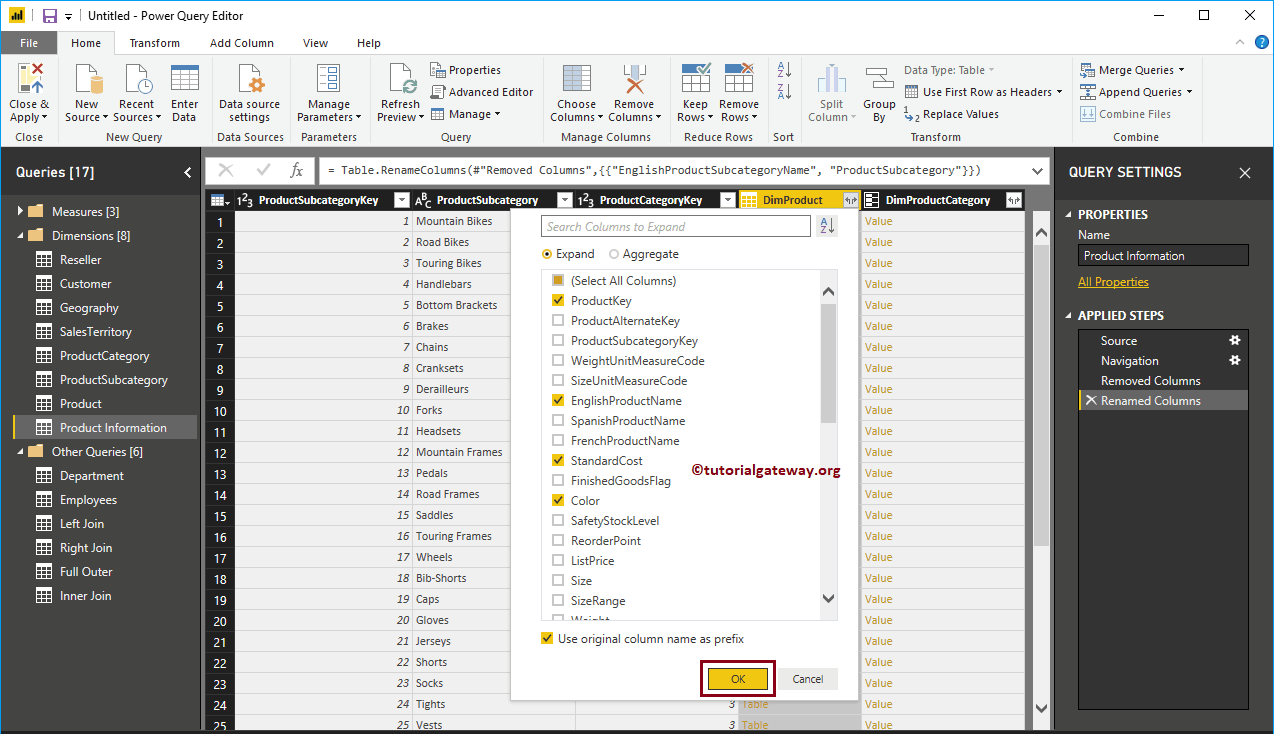
Merge multiple tables in Power BI: In real time, your data is in a normalized format, but in some situations, you may need the data denormalized. In this situation,…