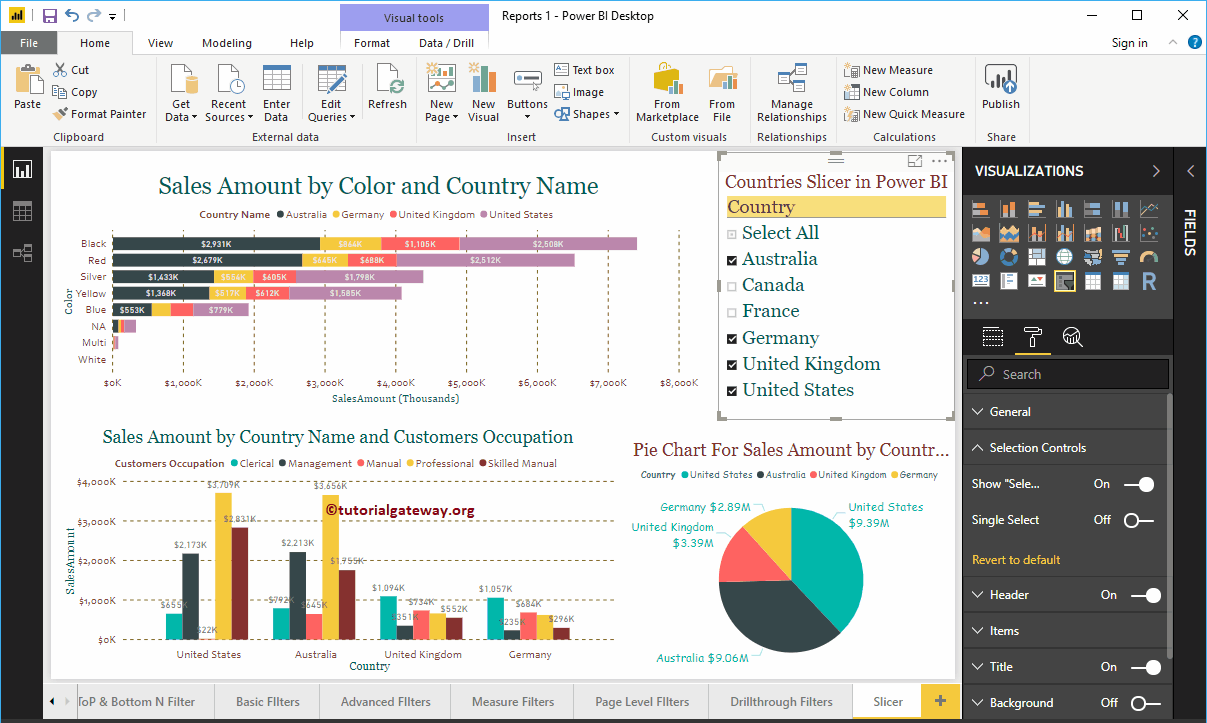
Power BI Slicer is commonly used to add filters to the canvas or to display filters on the report canvas. Let me show you how to create a Slicer in Power BI with ...
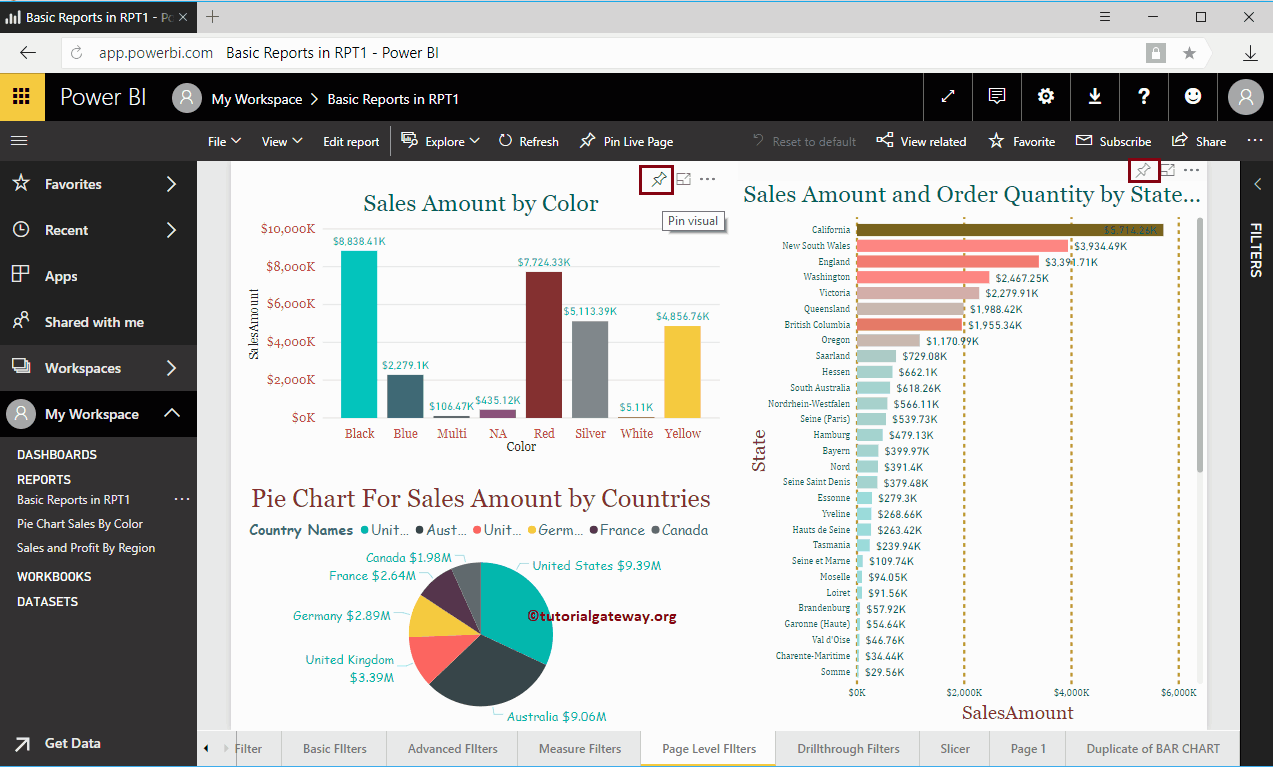
In this article, we show you the step-by-step approach to pin your report to the Power BI dashboard with a practical example. Before you start pinning your reports ...
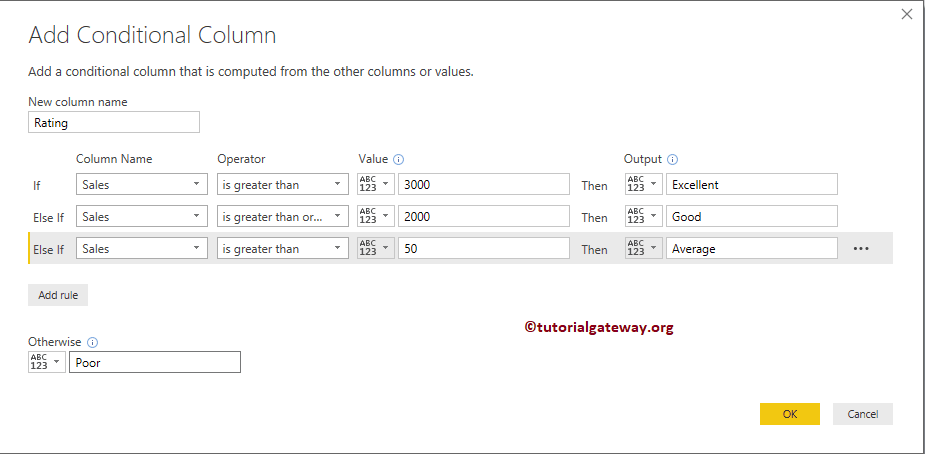
The Power BI Conditional column generates a new column based on the condition we specify, for example, creating an evaluation column based on employee performance, ...
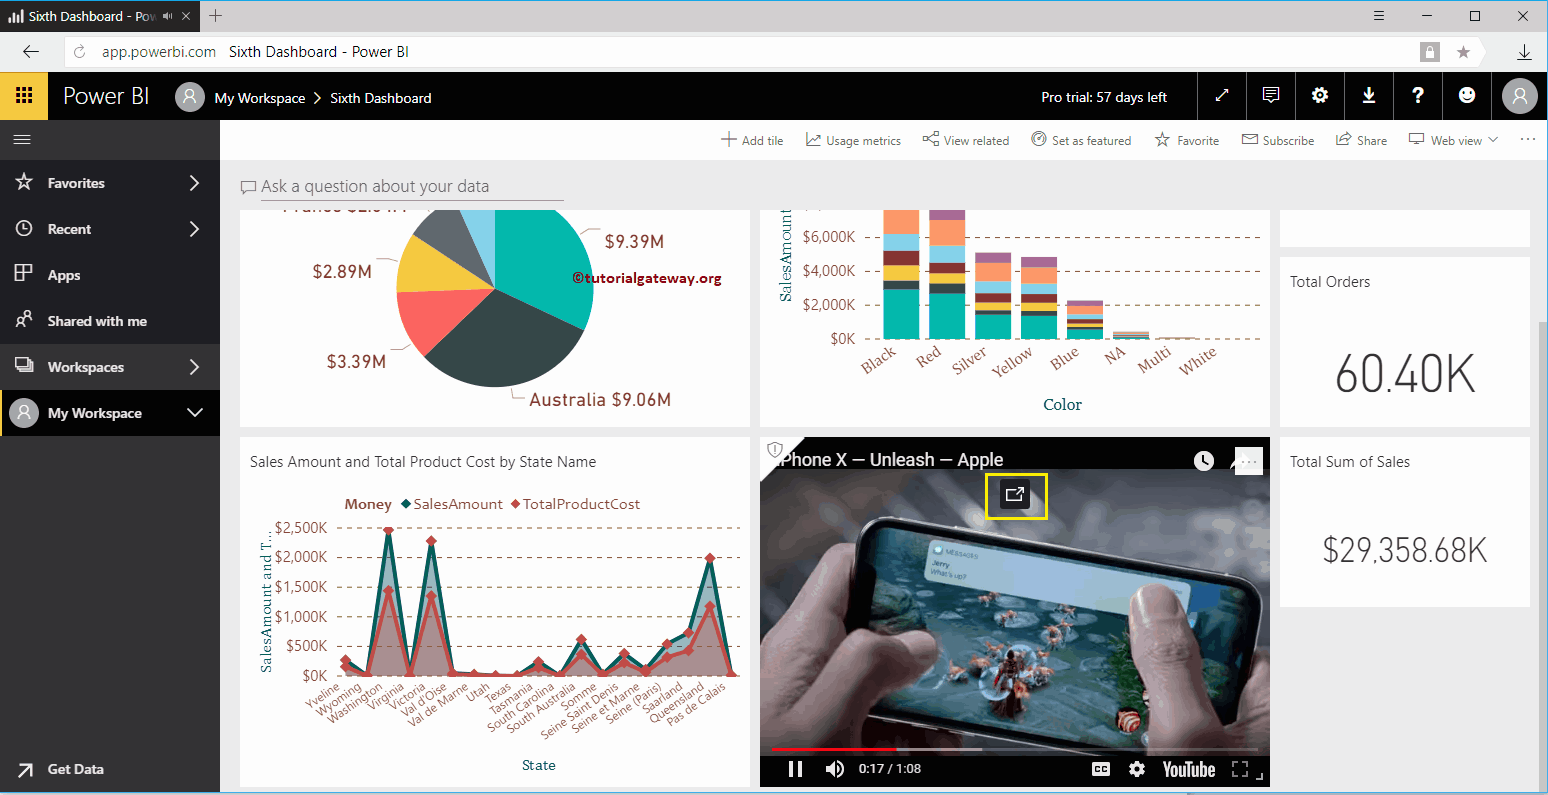
How to add video to Power BI dashboard with a practical example? For this Add Video to Power BI Dashboard demo, we're going to embed a YouTube video ...
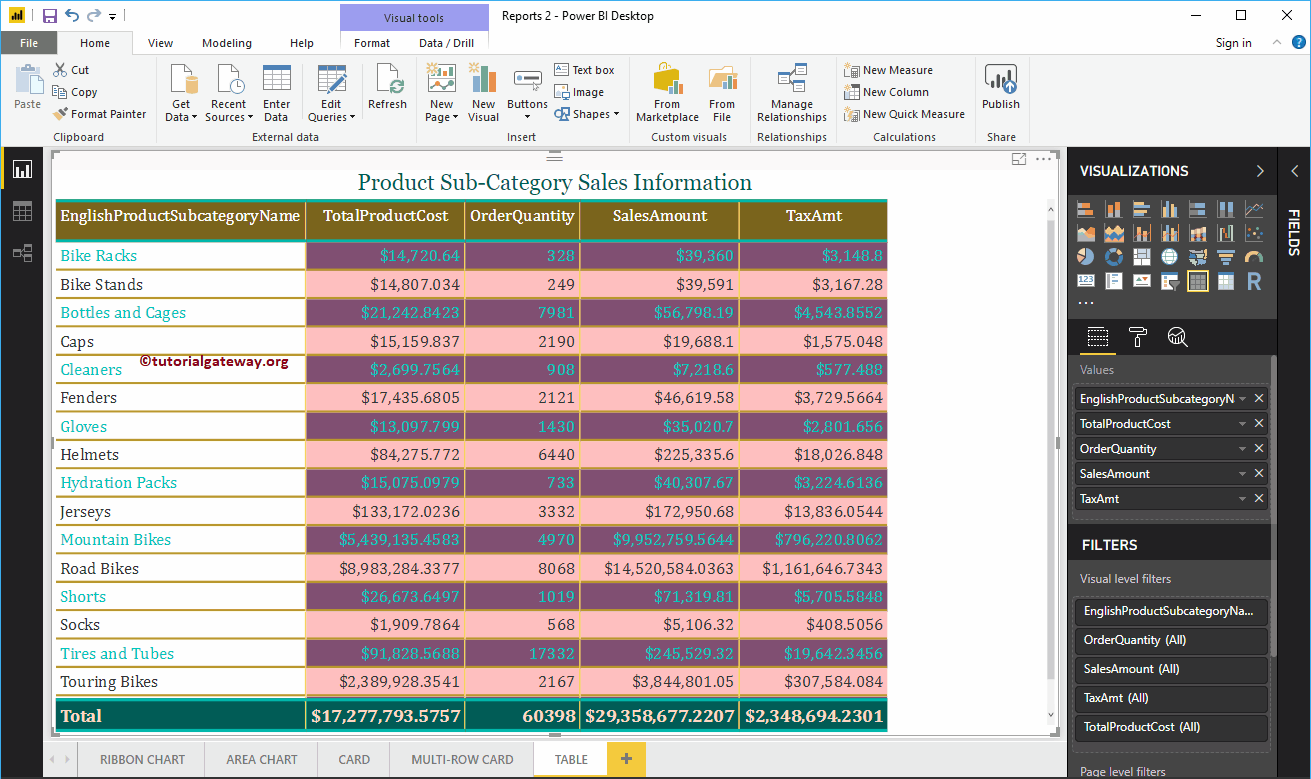
Let me show you how to create a table in Power BI with example. For this Power BI table report demo, we'll be using the SQL data source we created in ...
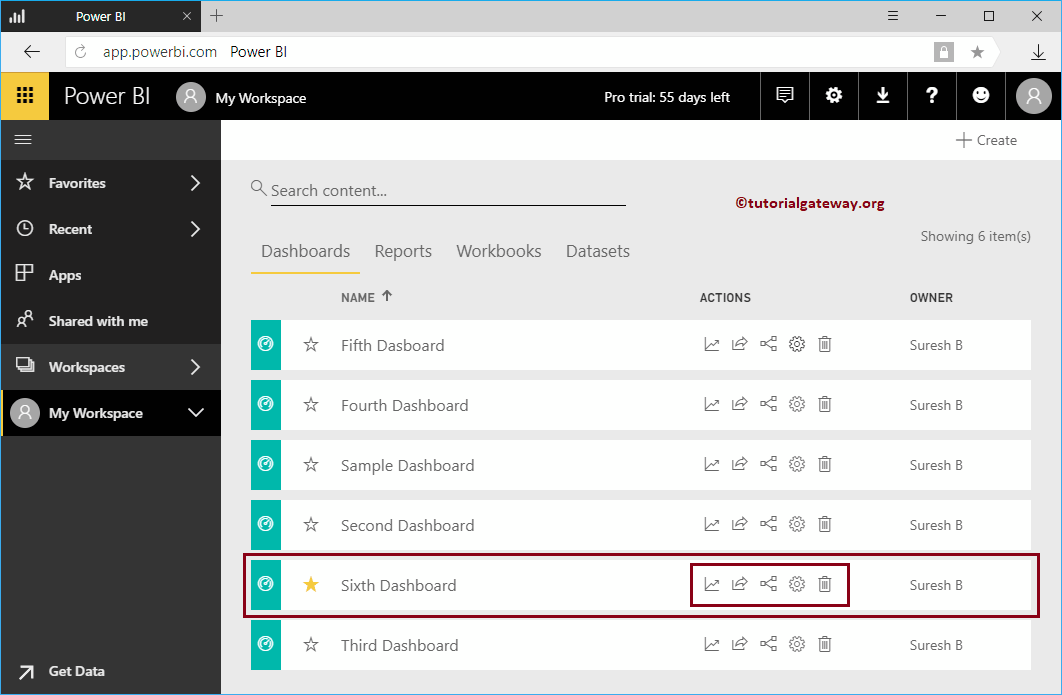
Let me show you the Power BI dashboard actions and their uses. Before you start exploring the list of dashboard actions in Power BI, let me show you the dashboards ...
In this article, we show you the step-by-step approach to pin your report to the Power BI dashboard with a practical example. Before you start pinning your reports ...
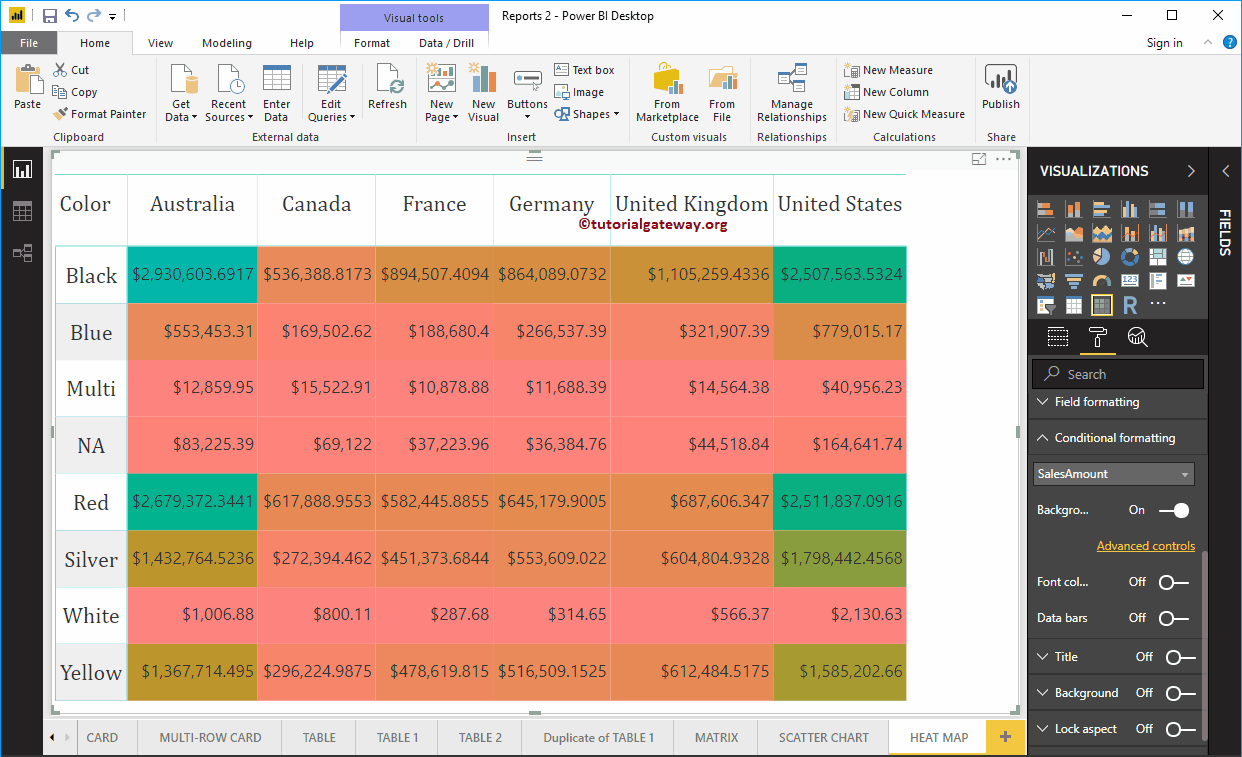
Power BI Heat Map is useful for displaying data along with colors. By seeing the color, one can easily understand the gains. Let me show you how to create a map ...
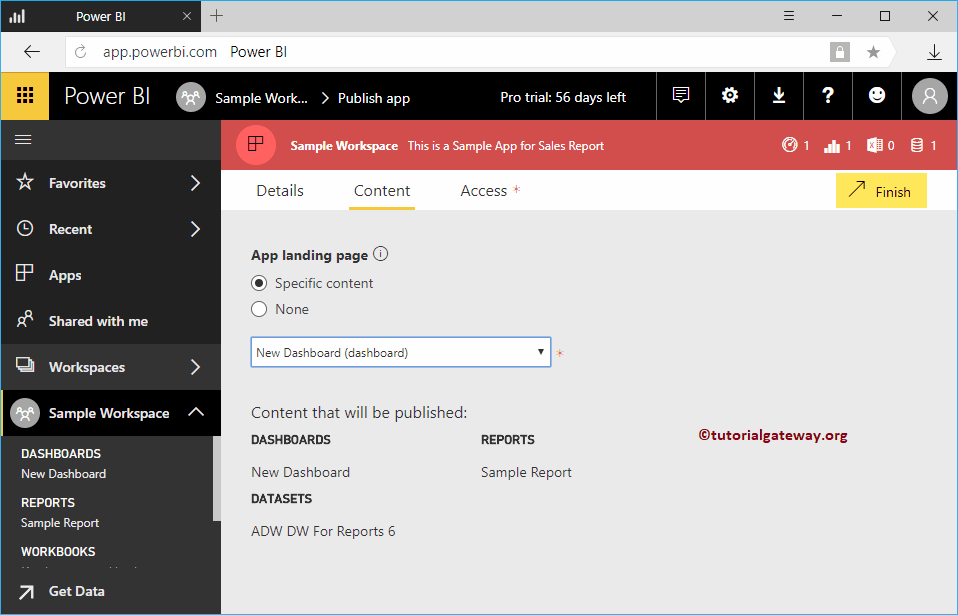
Let me show you the step-by-step approach to publishing apps in Power BI with a practical example. Before you start publishing the Power BI app, let me show you the dashboards ...