Let me show you how to add alternate row colors to Power BI table report with a practical example.
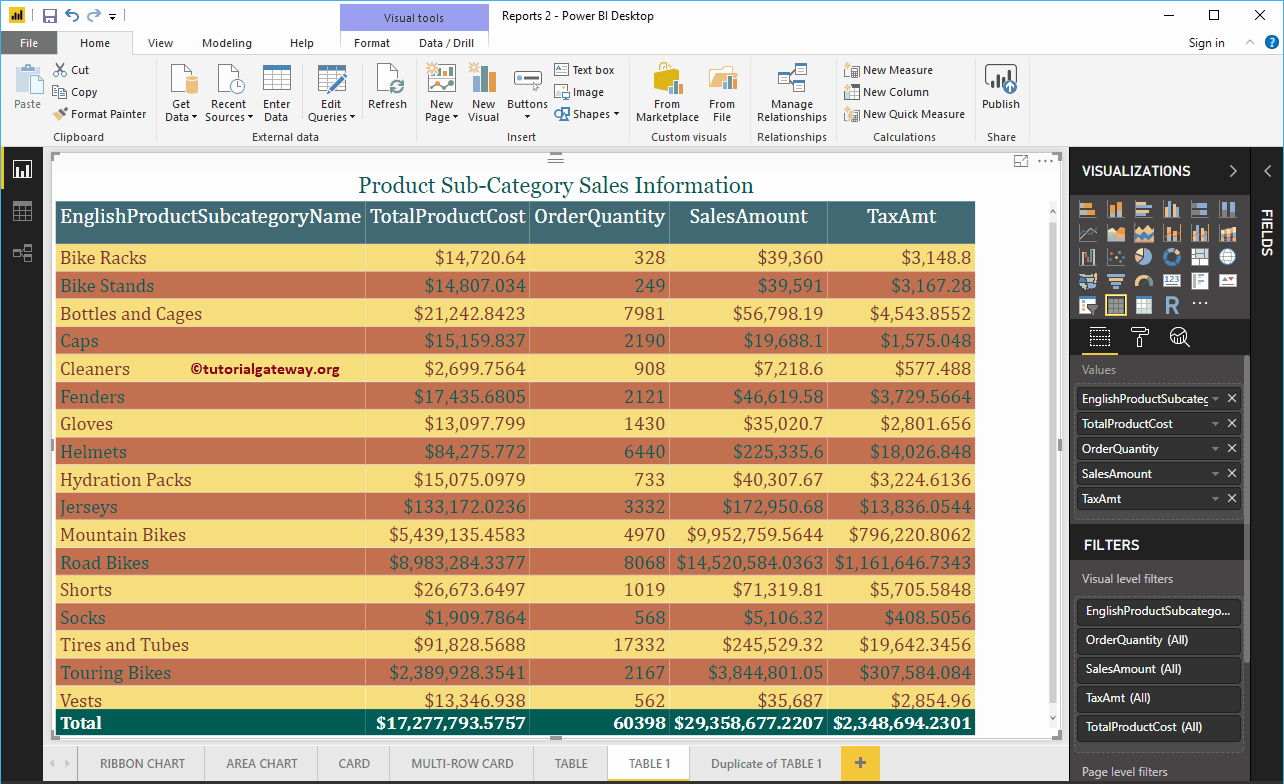
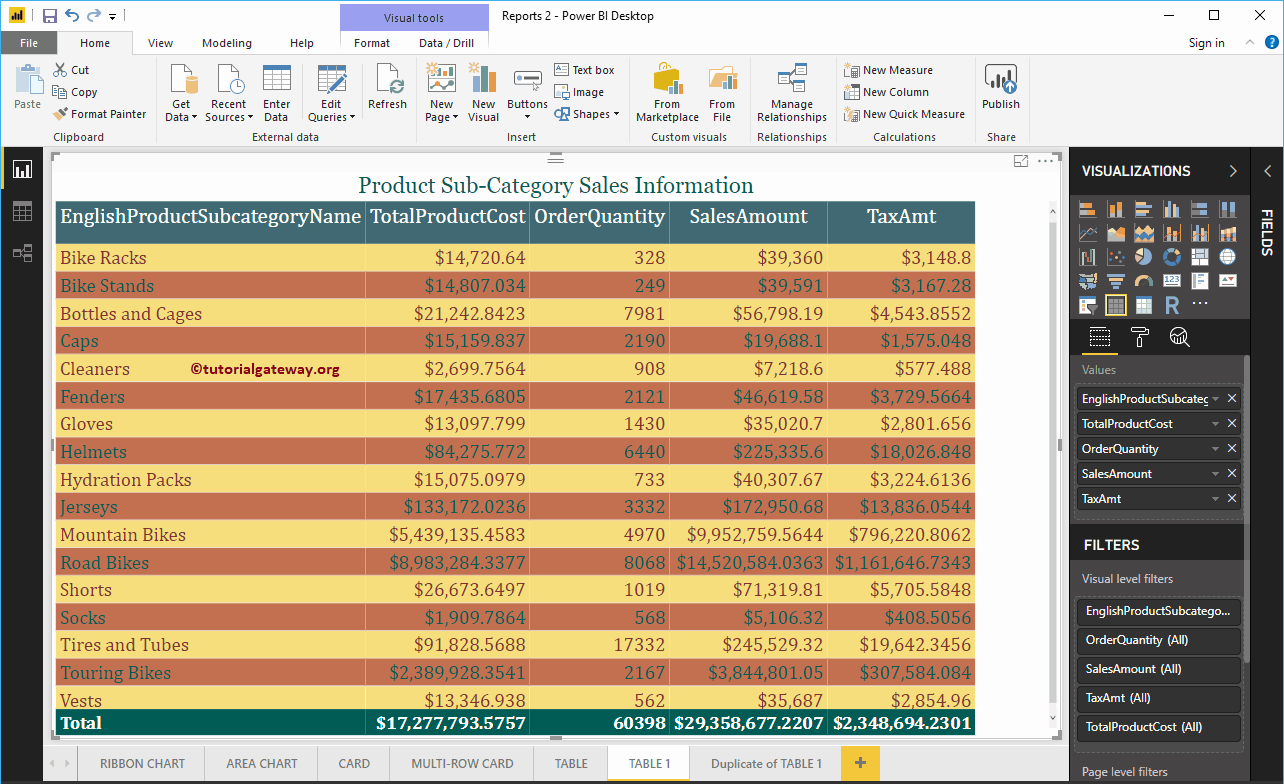
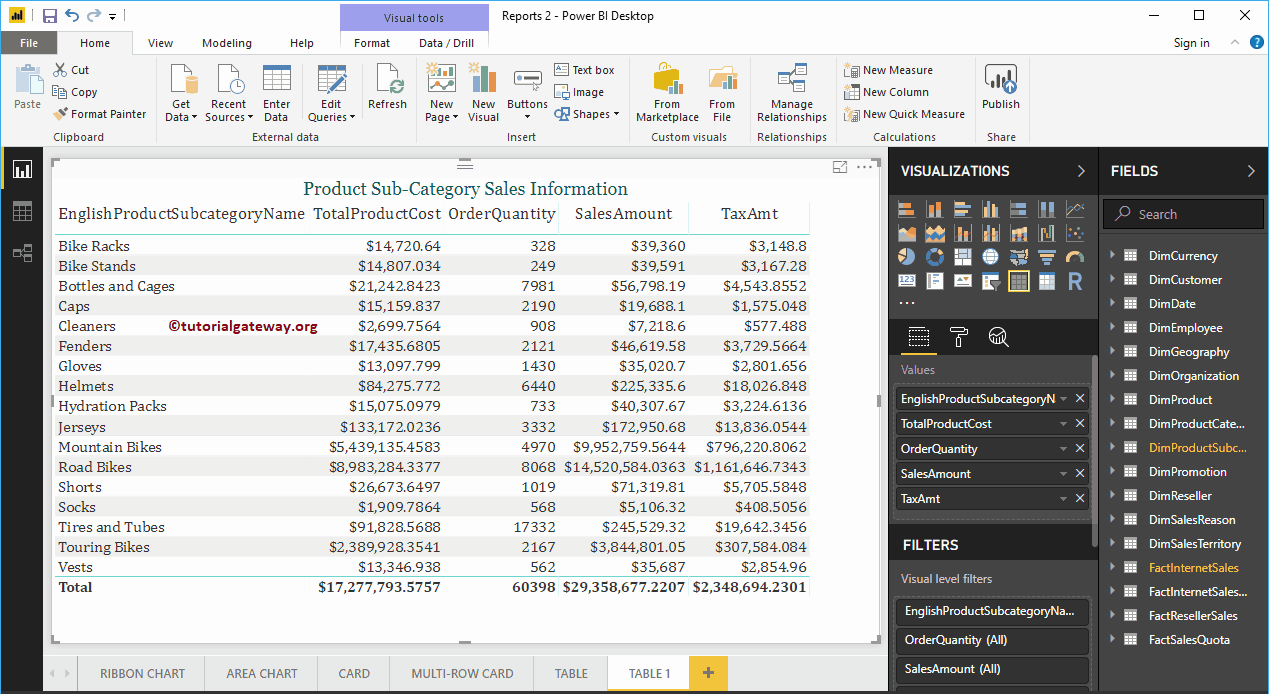
For this demo of adding alternate row colors to the Power BI table, we are going to use a table that we created in our previous post. I suggest you refer to the Create a table article to understand the same.
 <>
<>
Add alternate row colors to the Power BI table sample
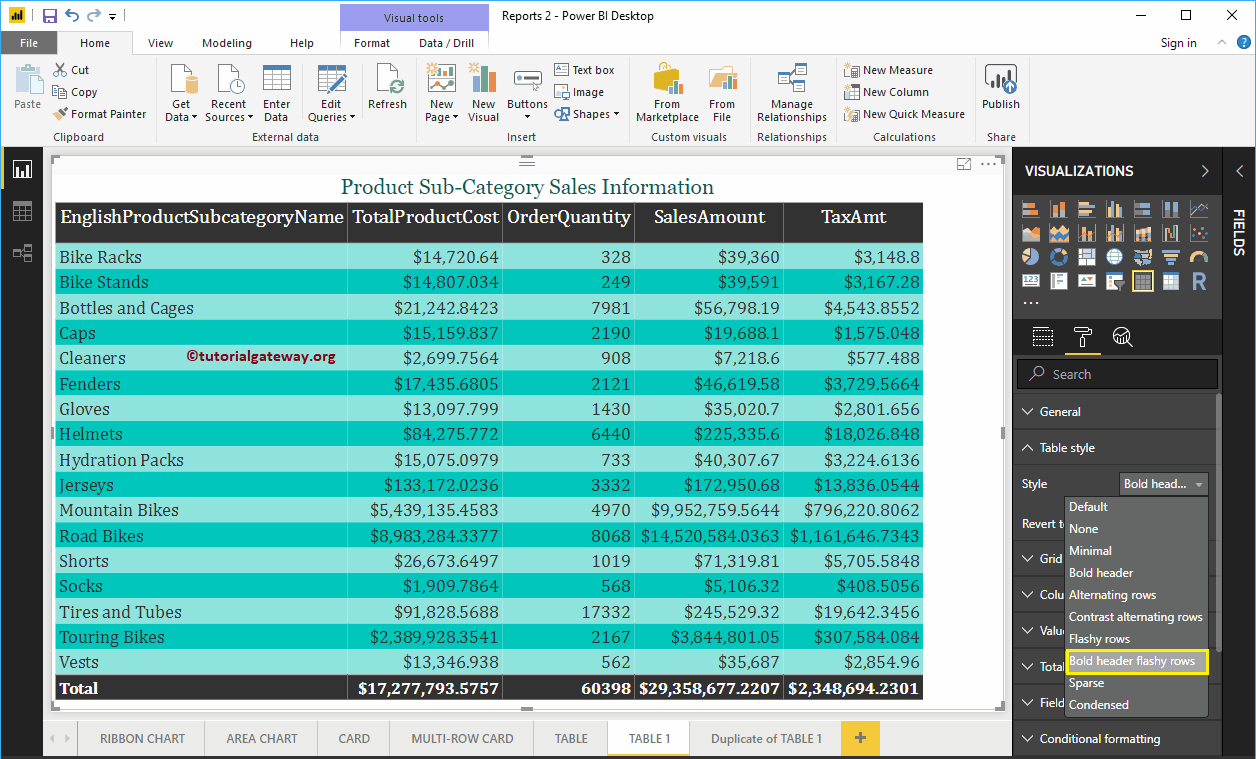
Click on the Format to see the list of available formatting options. Then navigate to Table style section to add alternate row colors to the table report.
In the following Power BI screenshot, you can see the list of styles that are available to design this table.
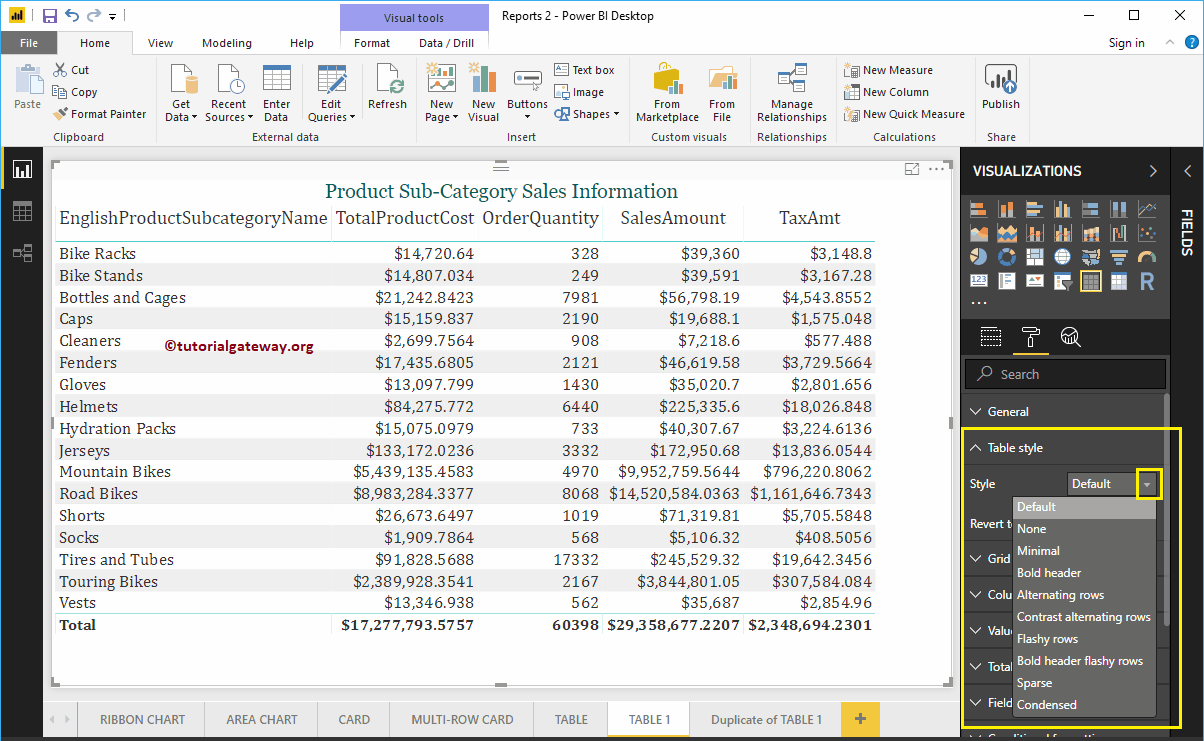
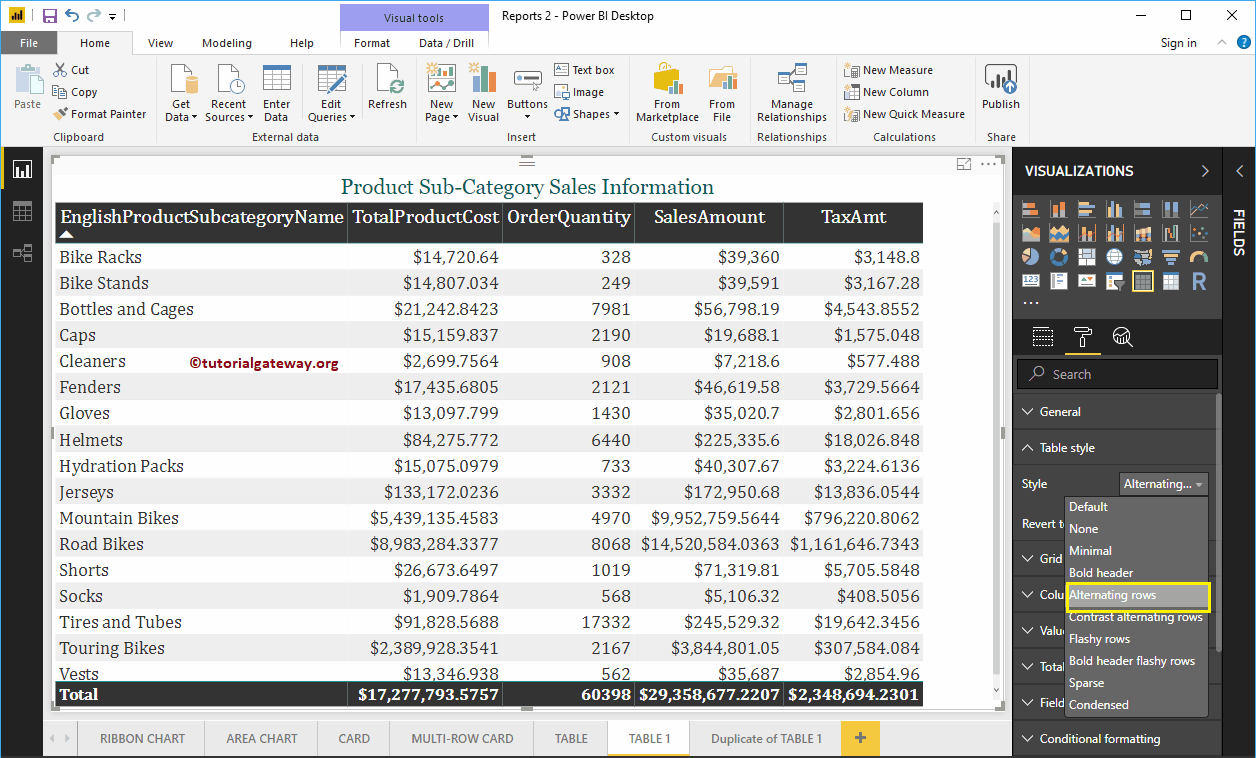
Please select the Alternate rows drop-down list option to add alternate row colors. Remember, this is the default option for any table.
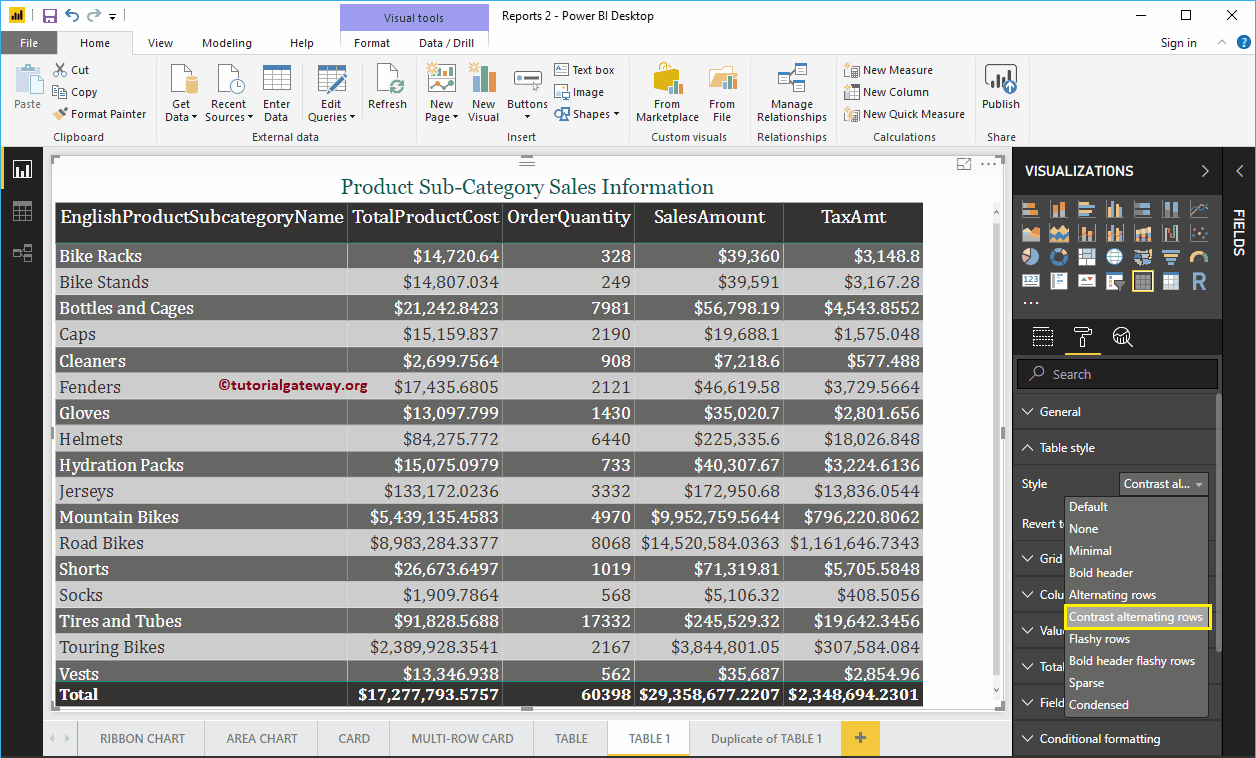
Let me select the Alternate Row Contrast option
If you select Striking rows, then Power BI assigns the following colors.
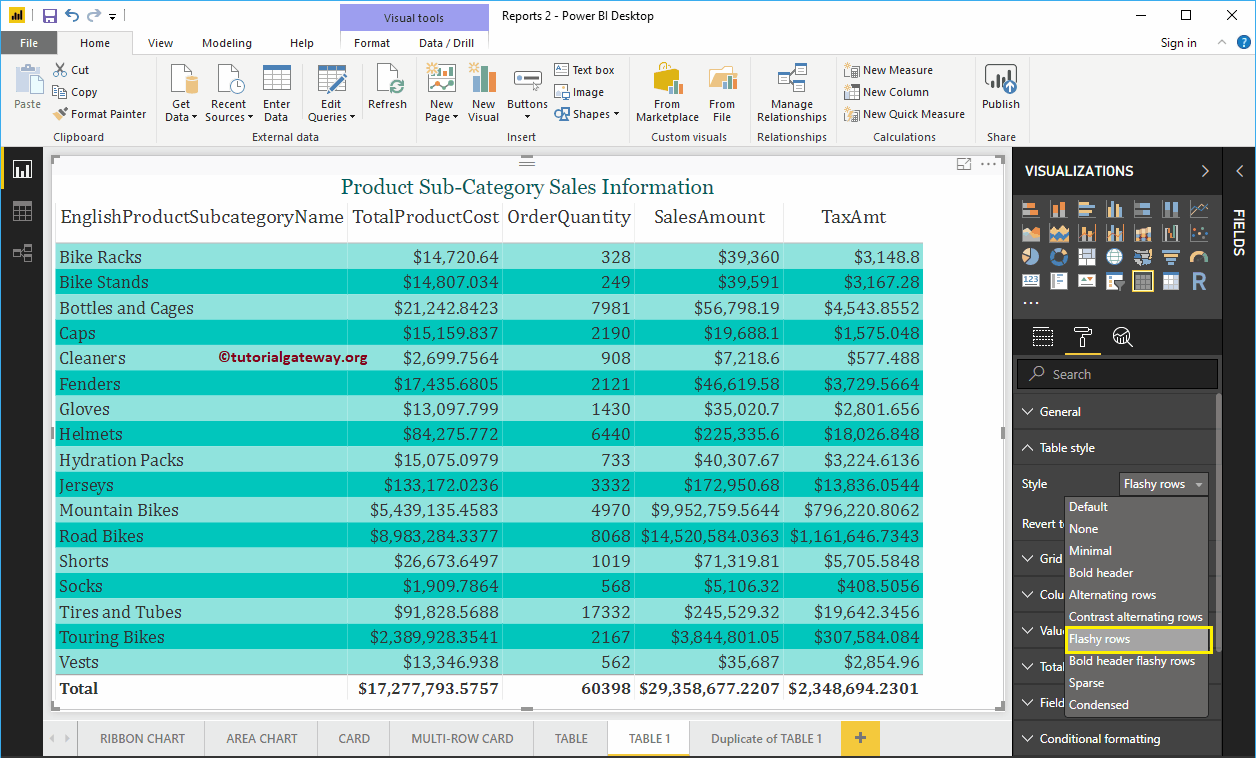
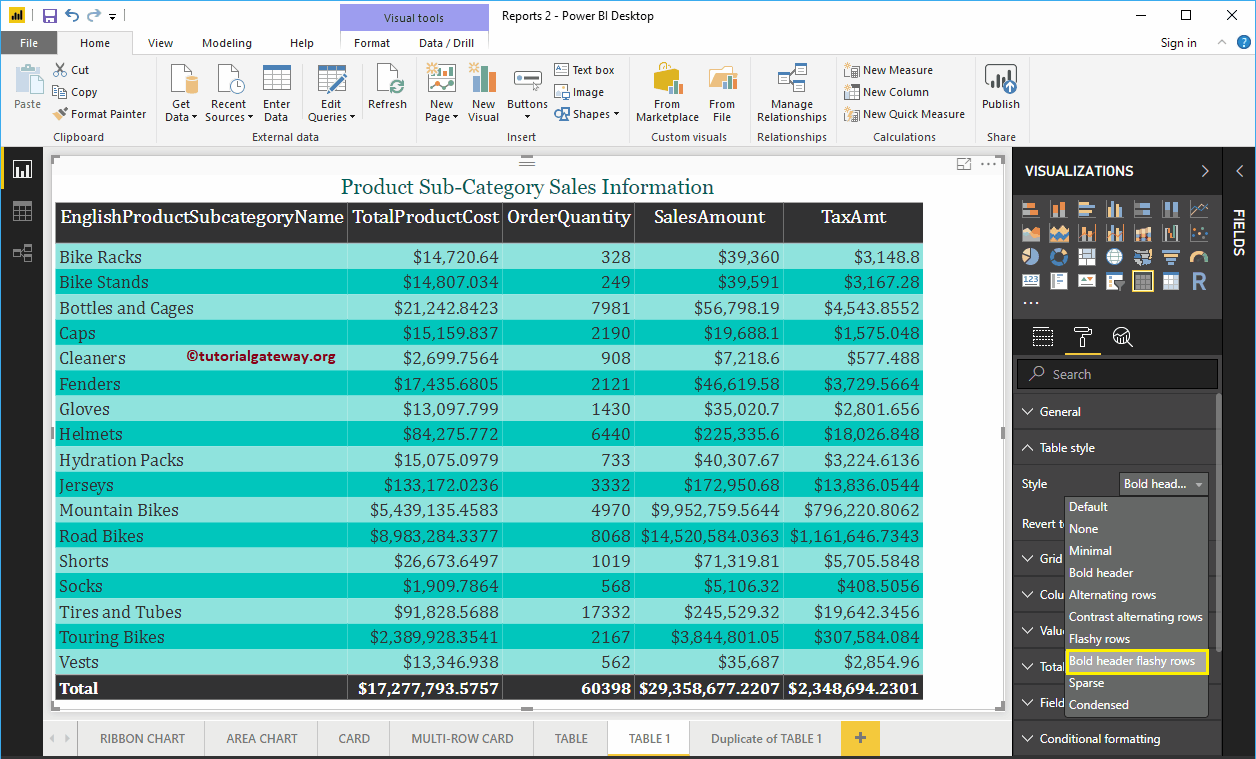
If you select Bold header Striking rows, luego, Power BI asigna un color negro a los headers y colores verdes llamativos para alternar filas.
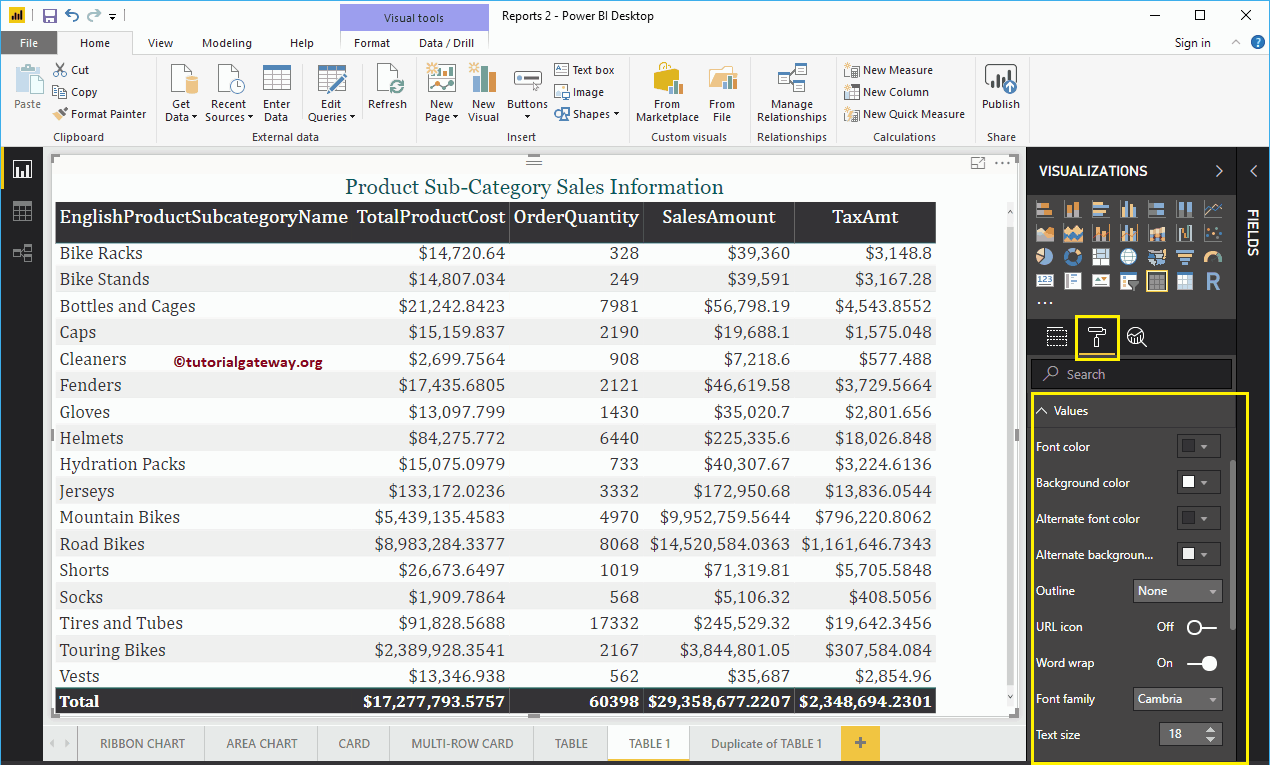
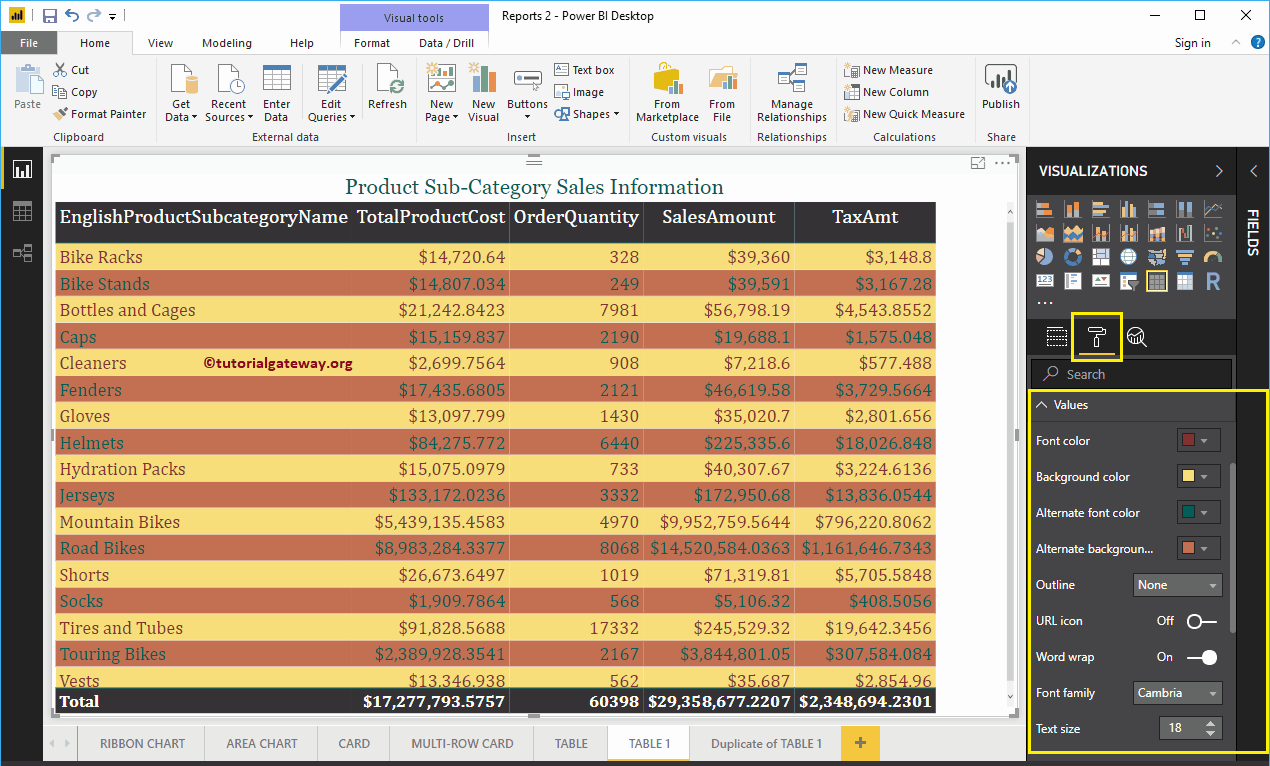
For now, we're sticking with the default option (alternate rows). Then go to Values section to format the colors according to your requirement.
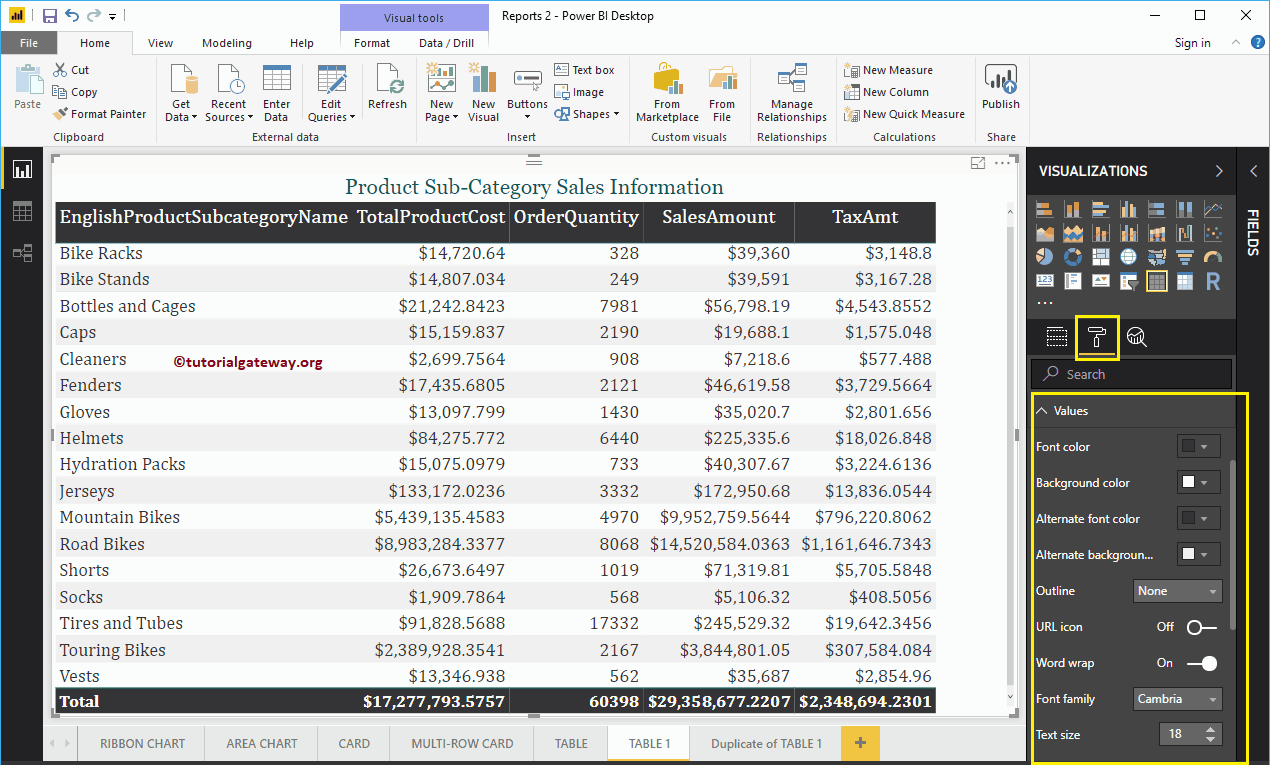
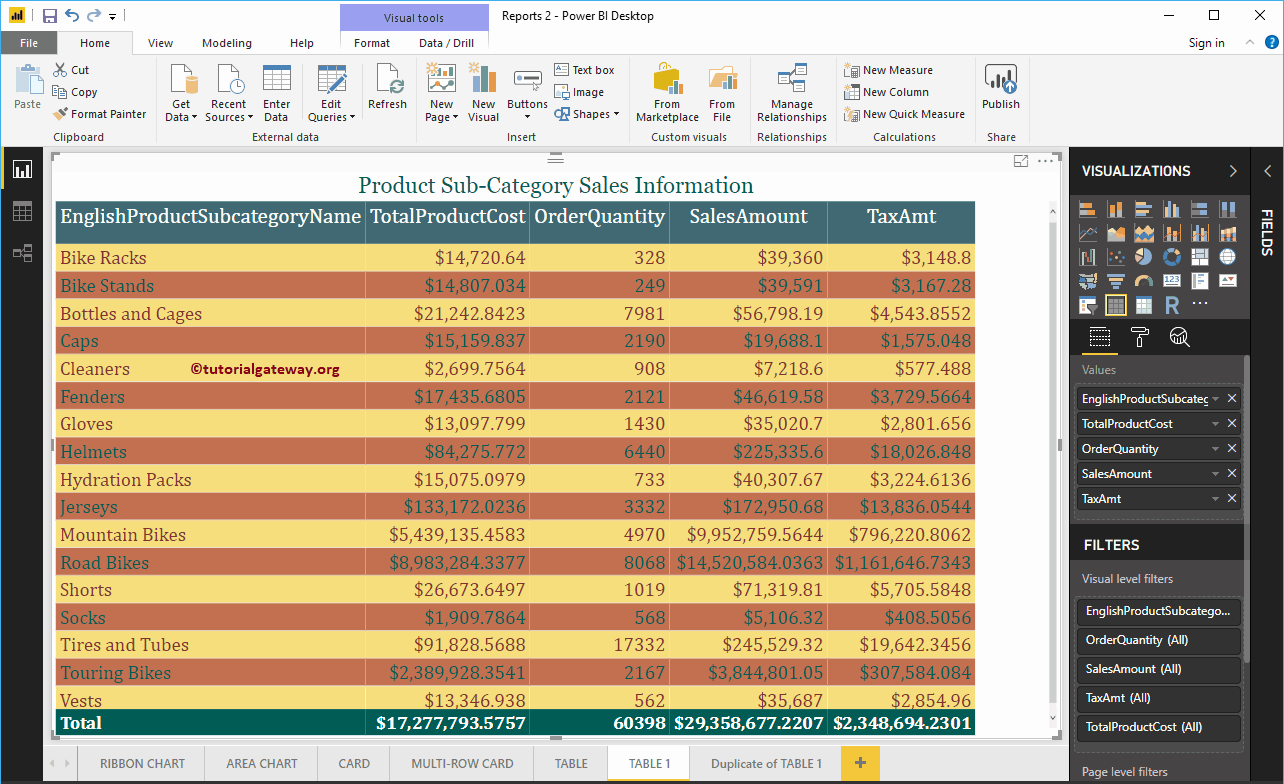
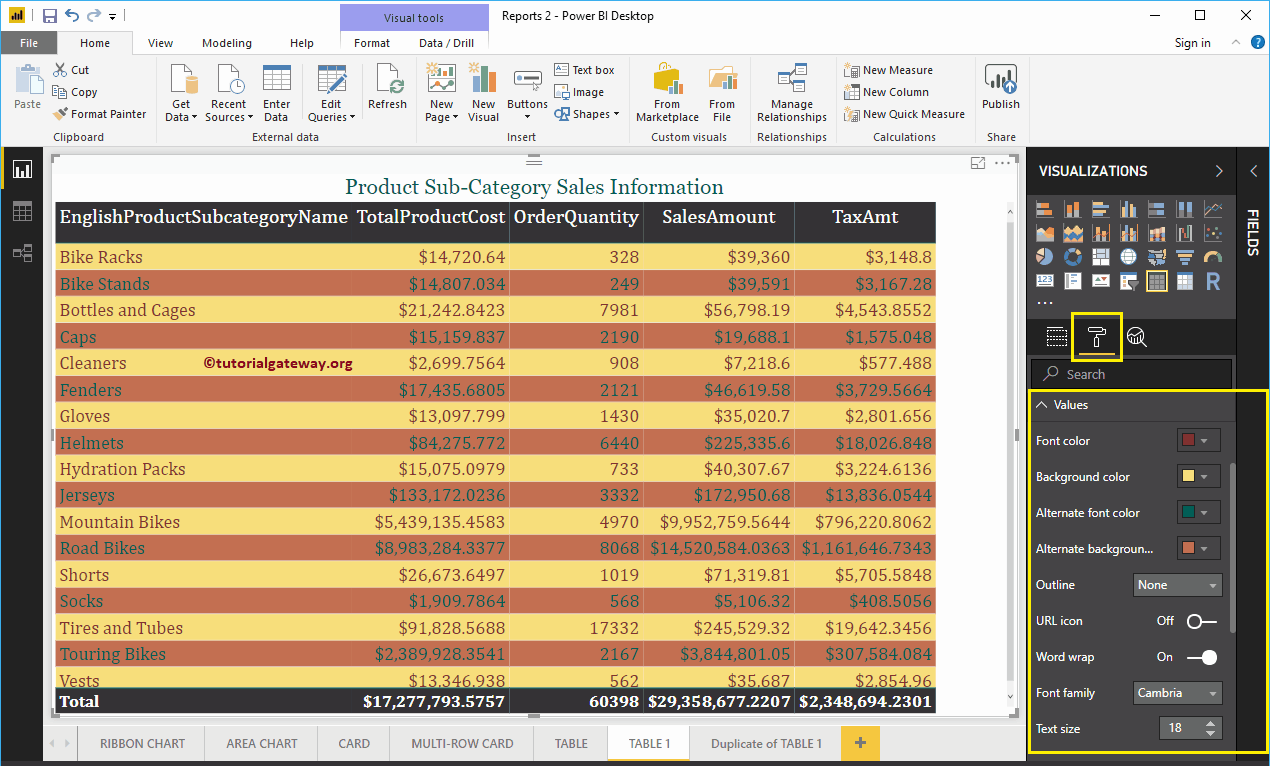
As you can see in the screenshot below, we changed the ForeColor and Back color of the odd and even rows. Here, we also change the font family to Cambria and the text size to 18
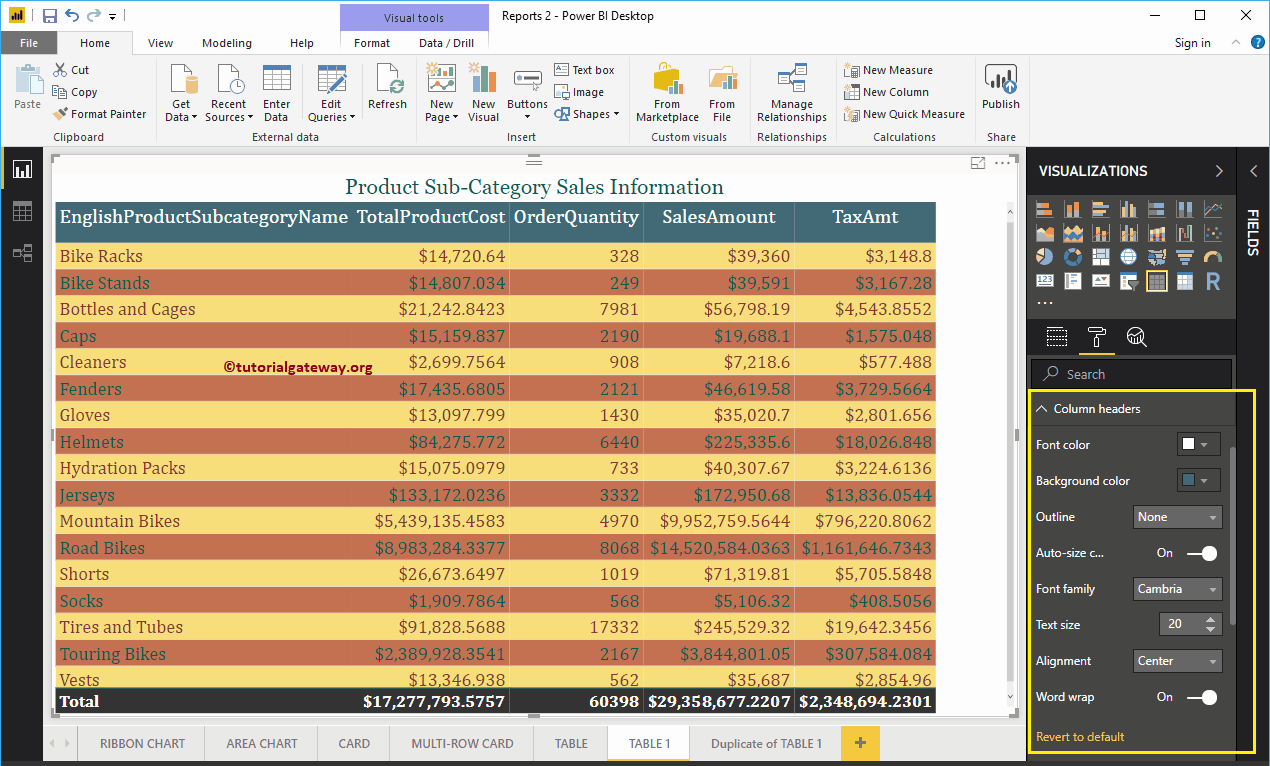
Then go to Column headers to alter the header colors.
As you can see in the screenshot below, we changed the font color to white, the background color to green. And the font family to Cambria, the text size to 25 and the alignment of the header text to the center.
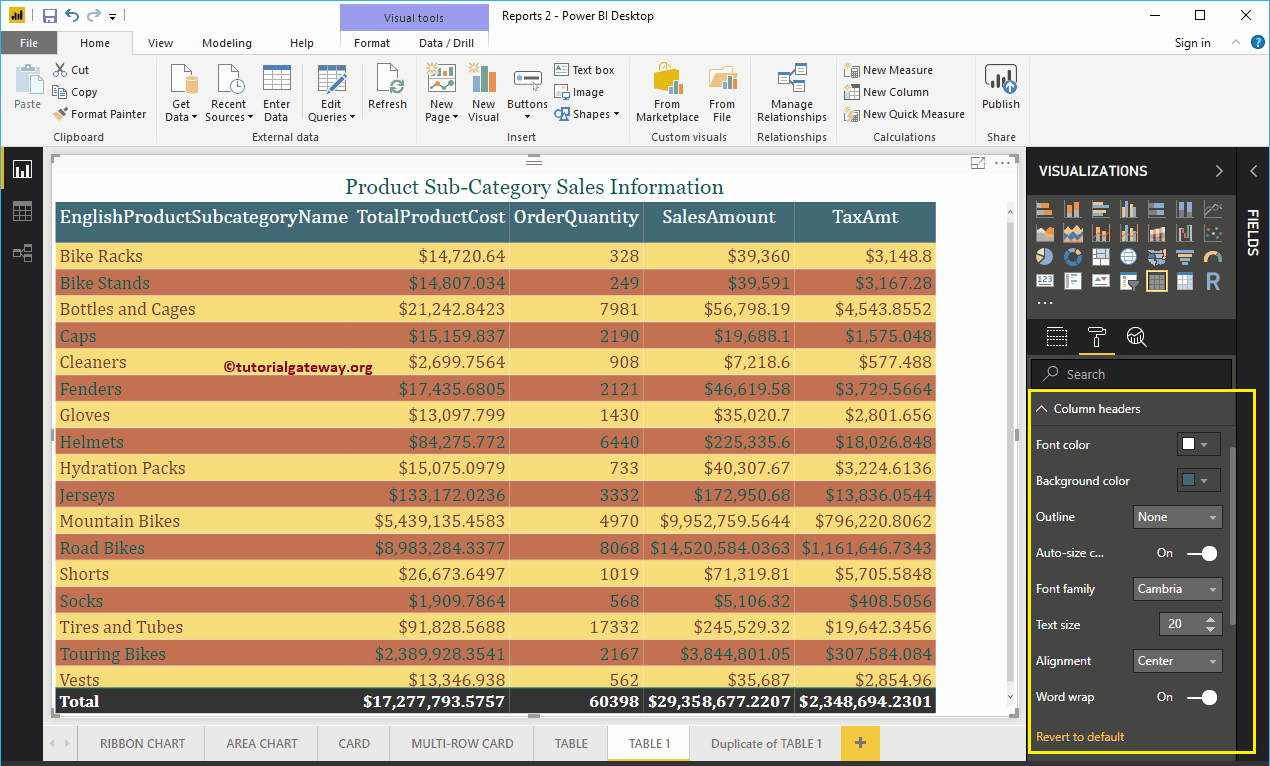
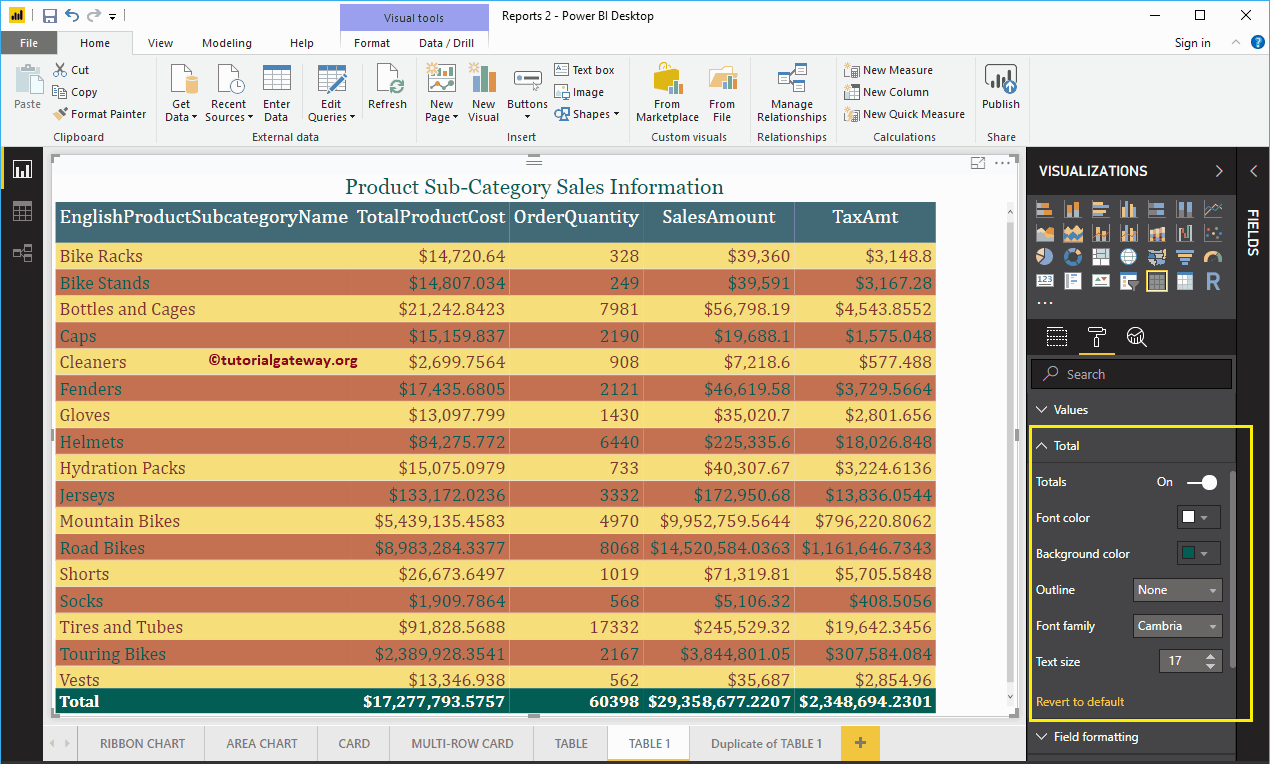
Then go to Total section to modify the text and background color of Total.
As you can see in the screenshot below, we changed the Totals font color to white, the background color to green, the font family to Cambria, and the text size to 17.
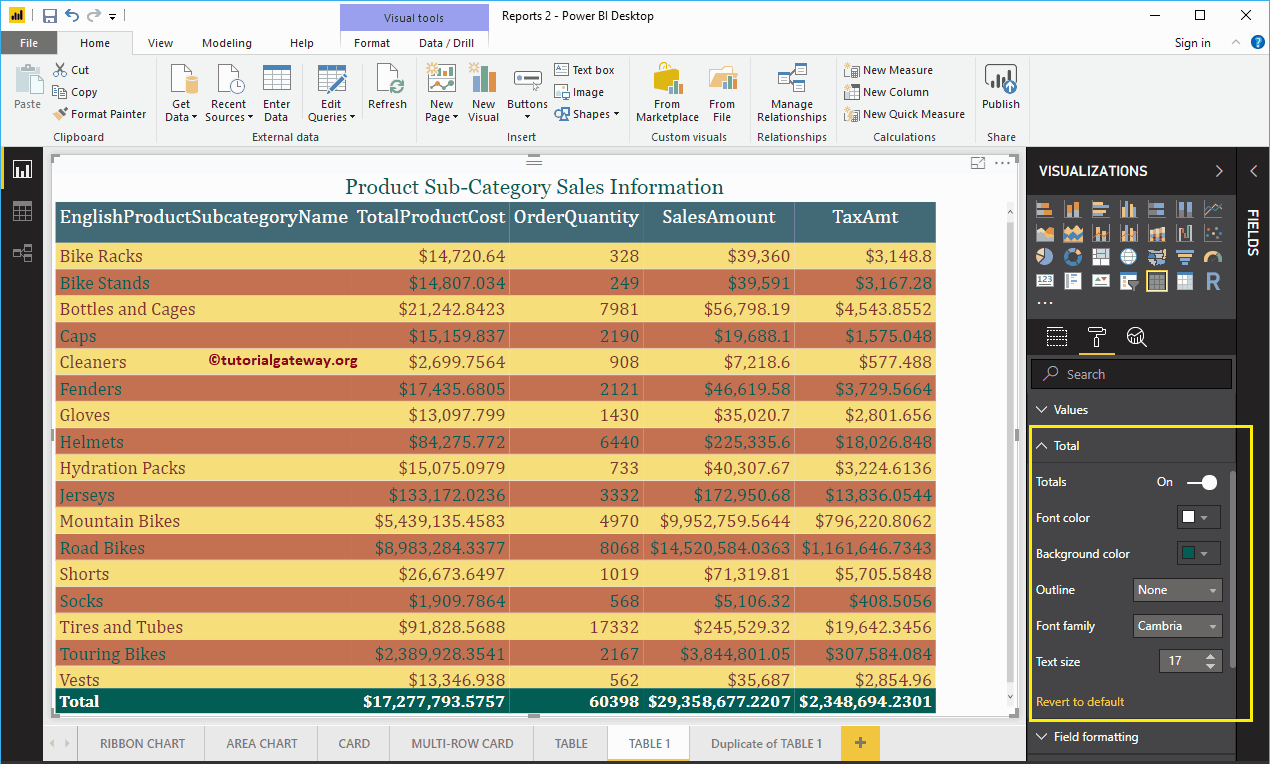
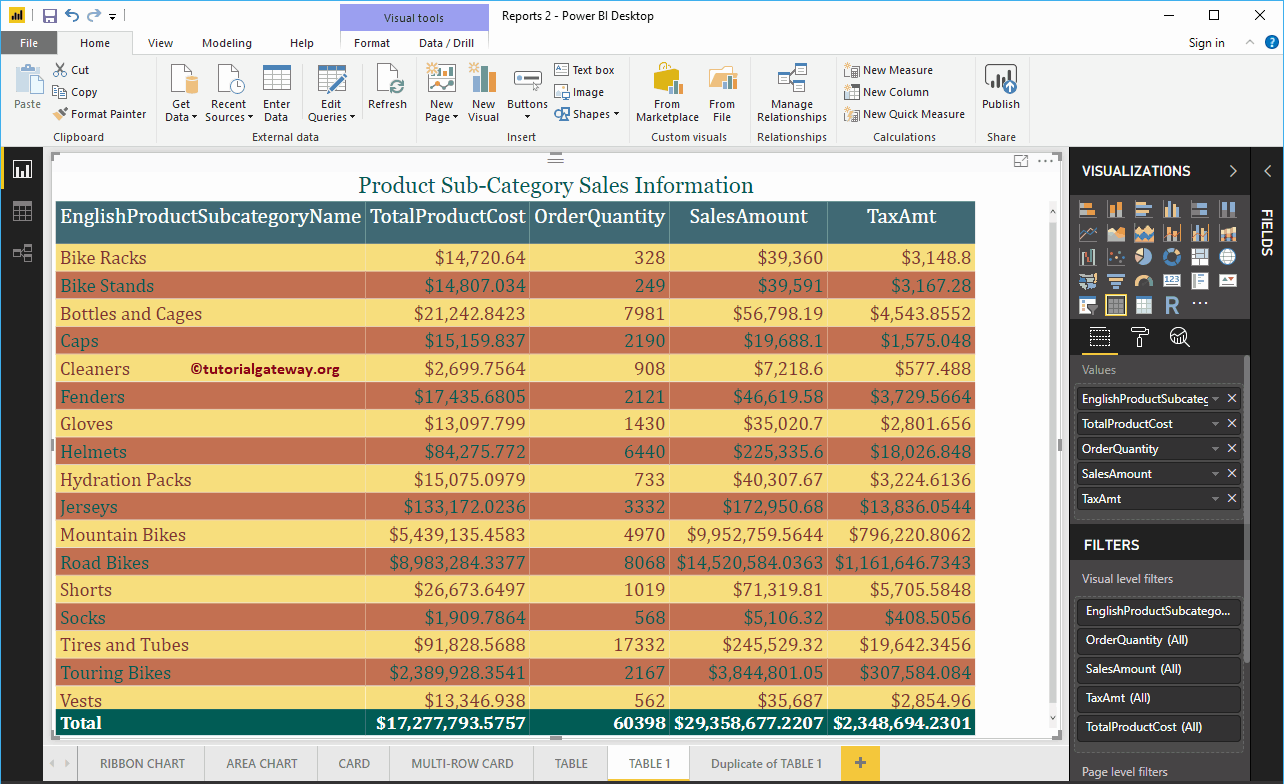
Finally, you can see the alternative colors.
